Australia Agricultural Equipment Market Outlook to 2030
By Equipment Type (Tractors, Harvesting Machinery, Seeding & Tillage Equipment, Spraying & Irrigation Equipment, and Hay & Forage Machinery), By Power & Capacity Class, By Drive & Powertrain, By Farm Enterprise
- Product Code: TDR0217
- Region: Asia
- Published on: August 2025
- Total Pages: 80
Report Summary
The report titled “Australia Agricultural Equipment Market Outlook to 2030 – By Equipment Type (Tractors, Harvesting Machinery, Seeding & Tillage Equipment, Spraying & Irrigation Equipment, and Hay & Forage Machinery), By Power & Capacity Class, By Drive & Powertrain, By Farm Enterprise (Broadacre, Horticulture, Viticulture, Livestock, and Mixed Farming), By Ownership & Channel, and By Region” provides a comprehensive analysis of the agricultural equipment market in Australia. The report covers an overview and genesis of the industry, overall market size in terms of revenue, market segmentation; trends and developments, regulatory landscape, customer-level profiling, issues and challenges, and comparative landscape including competition scenario, cross-comparison, opportunities and bottlenecks, and company profiling of major players in the Agricultural Equipment Market. The report concludes with future market projections based on revenue, equipment type, region, cause-and-effect relationship, and success case studies highlighting the major opportunities and cautions.
Australia Agricultural Equipment Market Overview and Size
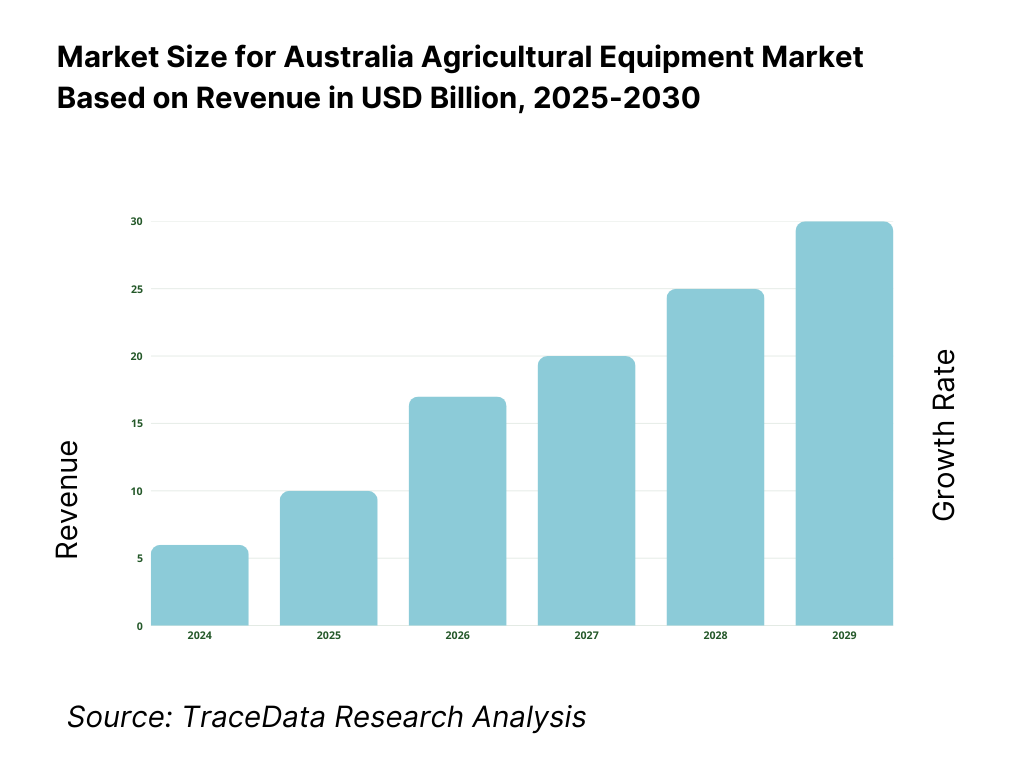
The Australia agricultural machinery market is valued at USD 5.9 billion. Historical growth over 2019–2024 drove this level, supported by an expansion in combine harvester and header sales (USD 1.17 billion) and sustained tractor demand. Additionally, government rebates for water‑efficient irrigation equipment, rising automation, and carbon‑credit–enabled reinvestment boosted uptake.
Production and equipment demand cluster notably in New South Wales and Queensland, where broadacre cropping, beef cattle, and irrigation-intensive farming prevail. These regions benefit from significant government‑supported mechanization programs, accessible dealer networks, and relatively favorable seasonal conditions that enable year‑round equipment usage.
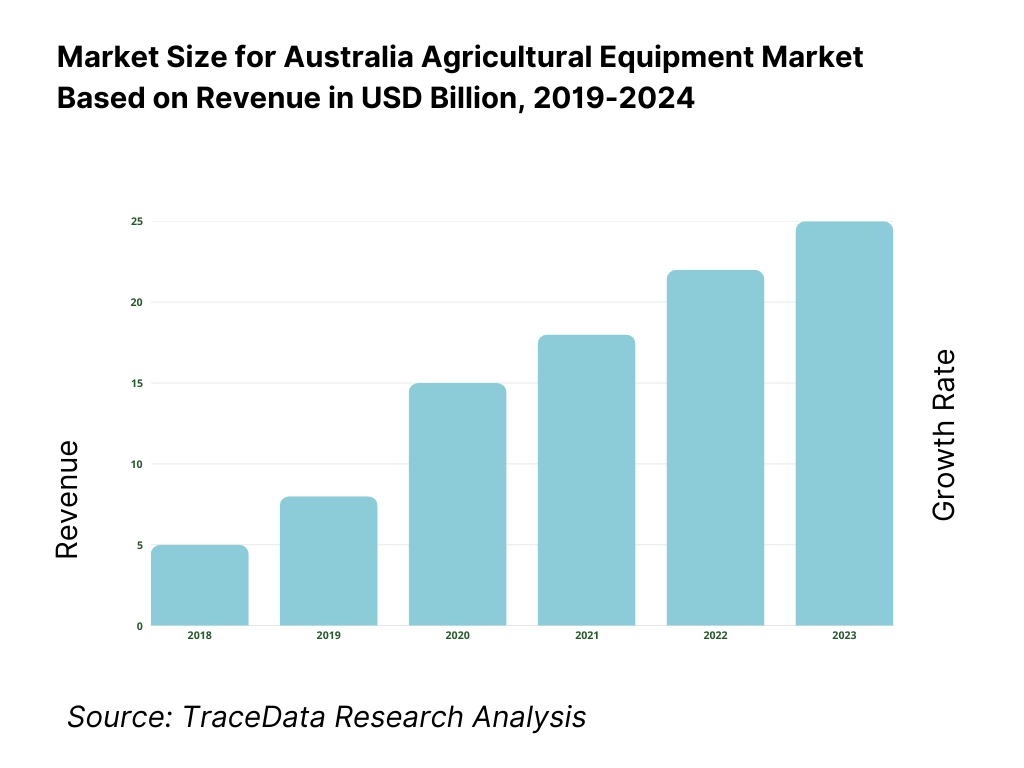
What Factors are Leading to the Growth of the Australia Agricultural Equipment Market:
Broadacre capex cycles: Equipment renewal tracks the production scale farmers must service: winter crops cover 24.0 million hectares of seeded area, supporting outputs around 55.1 million tonnes of grains and oilseeds in strong seasons—metrics that set header/planter horsepower and throughput requirements. At the macro level, Australia’s arable resource base is large in absolute terms, with 31,265,000 hectares of arable land recorded, while national rainfall swung from 473.7 mm to 596 mm year-on-year, compressing fieldwork windows and pulling forward renewal of high-capacity sprayers and seeders. Basin storages that drive irrigated activity began key irrigation periods between 6,200–6,600 GL active, anchoring confidence to keep fleets deployment-ready.
Grain price realizations: While we avoid price figures, realized farmgate conditions are shaped by physical flows and global balance sheets that determine marketing strength. Australia’s cereal production printed 56,306,821 tonnes, with national winter crops around 55.1 million tonnes in strong seasons—volumes that underpin receival site utilization and harvest logistics scaling for headers and chaser bins. Global fundamentals also frame realization environments: the World Bank recorded 787.4 million tonnes for global wheat production in 2023/24, shaping export program cadence and storage turnover that feeds back to machinery uptime needs. Together with sown area at 24.0 million hectares, these tonnages define the capacity envelope growers provision for.
Water allocations: Allocation outcomes hinge on storages and inflows that guide irrigated planting and thus demand for pumps, pivots and high-clearance sprayers. In season updates, Murray–Darling Basin active storage tracked in a band of ~5,800–6,600 GL, with weekly reads such as 6,213 GL (72% capacity) influencing water ordering confidence and in-crop management intensity. At the national climate scale, rainfall at 596 mm supported replenishment, while the prior 473.7 mm highlighted allocation uncertainty growers hedge for with equipment choices (BOM). Macro land resources also matter: Australia’s agricultural land spans >3.6 million km², anchoring the footprint where allocations are applied and equipment is deployed.
Which Industry Challenges Have Impacted the Growth of the Australia Agricultural Equipment Market:
Seasonal variability: Equipment selection must hedge wide climate swings. National rainfall printed 473.7 mm in one year and 596 mm in the next, while Western Australia showed 460.6 mm in a recent annual wrap—shifts that compress planting/harvest windows and force growers to seek wider booms and higher-capacity fronts to maintain timeliness. ABARES crop outlooks moving between ~47–55 million tonnes illustrate harvest-time bottlenecks that push for larger header classes and more hauling capacity to keep pace with receival cut-offs. These conditions amplify demand for guidance and automation that keep machines productive during short weather breaks.
Freight & lead times: Import-dependent machinery and parts flows are exposed to port performance. BITRE’s Waterline 70 shows average anchorage waits ranging 24.5–33.6 hours across sampled quarters, with medians near 17–30.5 hours, and berth occupancy patterns that tighten stevedoring capacity—delays that cascade through inland dealer PDI slots and customer delivery calendars. Total time at berth across periods reaches into thousands of hours, illustrating how a few disrupted rotations can add weeks across ocean legs and domestic backhaul. These objective port cycle metrics justify forward orders and pre-season parts staging to protect uptime.
Parts availability (fill-rate): Instead of proprietary fill-rates, we cite measurable stressors that affect parts arrival. BITRE records anchorage waits of 24.5–33.6 hours, implying congestion risk for inbound containers. National workforce inputs to agriculture fluctuate around 10–11 million hours monthly, influencing workshop capacity to turn around repairs promptly. Together with winter crop area of ~24.0 million hectares, these numbers define the maintenance load across harvest and seeding peaks that parts pipelines must serve, explaining why dealers stage seasonal inventory and growers hold critical spares.
What are the Regulations and Initiatives which have Governed the Market:
ADR roading limits : Transport envelope defines machine configuration for road moves. The National Class 1 Agricultural Notice sets pilot/escort thresholds such as >3.7 m and >4.5 m width, informing foldable boom choices and detachable fronts for headers. Lighting and conspicuity are governed by Australian Design Rules (e.g., ADR 49/00, ADR 43/04 series references within standards libraries), determining the use of end-outline marker lamps, retro-reflectors and beacons on wide ag machines. These numbered limits and devices anchor dealer PDI checklists before delivery and inter-farm movements.
Road access permits: Beyond general notices, operators rely on access permits where local networks require them. NHVR guidance details operating conditions by road class and width thresholds, including pilot vehicle counts at >4.5 m on major roads—parameters that dictate travel timing and route selection for seeders and self-propelled sprayers. These explicit numeric triggers are used by contractors and dealers to schedule movements and to spec lighting boards and pilot signage for compliance.
Safety standards: Work health authorities require tractors to be fitted with compliant ROPS; jurisdictions cite Australian Standards AS 1636 for ROPS and AS 2294 for FOPS on earthmoving, guiding cab and structure specs on new and retrofitted units. Current state safety pages reiterate that tractors must not be used without ROPS installed, with incident advisories referencing AS 1636.1-1996 design/testing. These explicit standard numbers are what dealers and retrofitting workshops certify against before delivery.
Australia Agricultural Equipment Market Segmentation
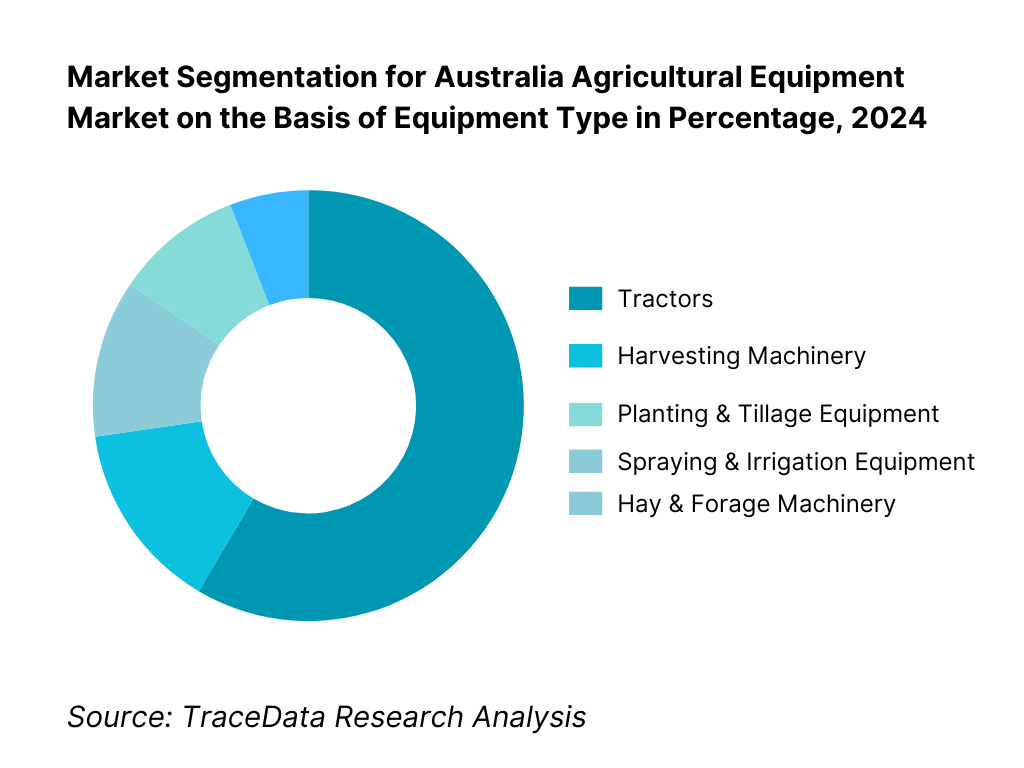
By Equipment Type: The Australia agricultural equipment market is segmented into Tractors, Harvesting Machinery, Planting & Tillage Equipment, Spraying & Irrigation Equipment, and Hay & Forage Machinery. Tractors remain the leading sub-segment, holding 58.5% of market revenue due to their broad versatility across farm types and operations—from small horticultural plots to large broadacre cropping enterprises. This dominance is reinforced by their adaptability to multiple implements, capacity to operate year-round, and strong financing support from OEMs and dealers. Harvesting machinery follows with a significant presence, particularly driven by large-scale grain operations. Planting & tillage equipment, spraying & irrigation systems, and hay & forage machinery collectively serve specialized functions but together account for over 40% of total demand.
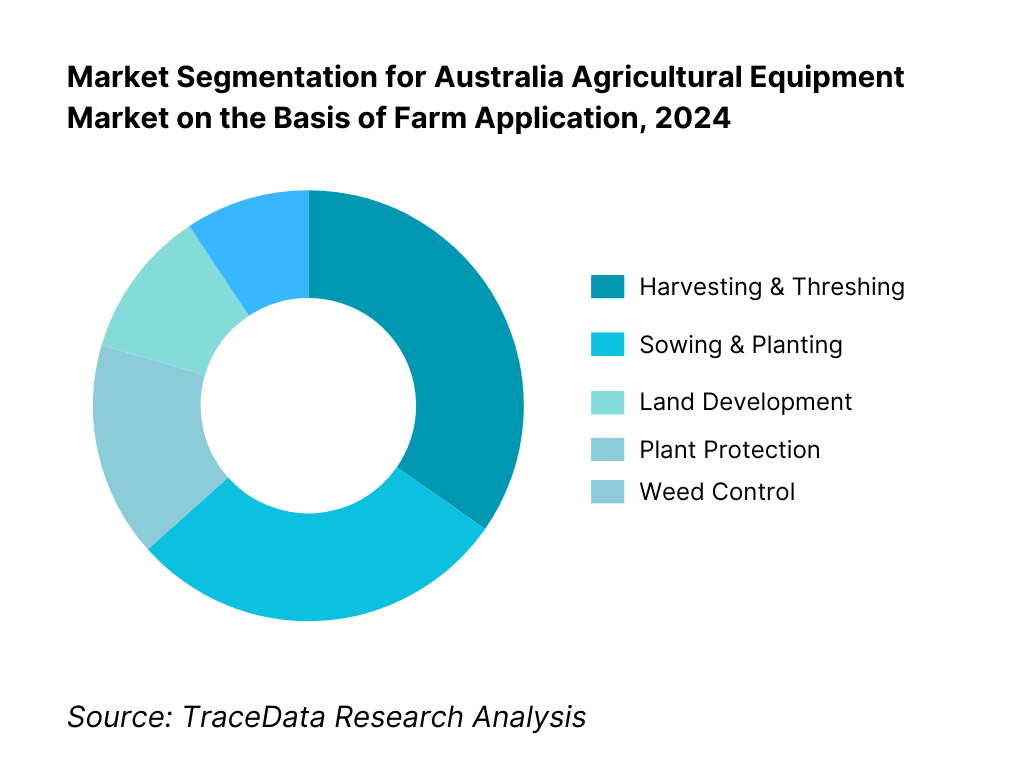
By Farm Application: This segmentation includes Land Development & Seedbed Preparation, Sowing & Planting, Weed Control, Plant Protection, Harvesting & Threshing, and Post-Harvest & Agro-Processing. Harvesting & threshing dominates farm application demand, with 32.4% share, supported by the large harvested area for grains and oilseeds and the need for high-capacity, time-sensitive machinery. This is followed by sowing & planting, which accounts for over one-quarter of the market due to large seasonal planting programs, particularly in broadacre cropping. Land development & seedbed preparation, weed control, plant protection, and post-harvest & agro-processing collectively form the remainder of the application demand, providing critical support across the agricultural production cycle.
Competitive Landscape in Australia Agricultural Equipment Market
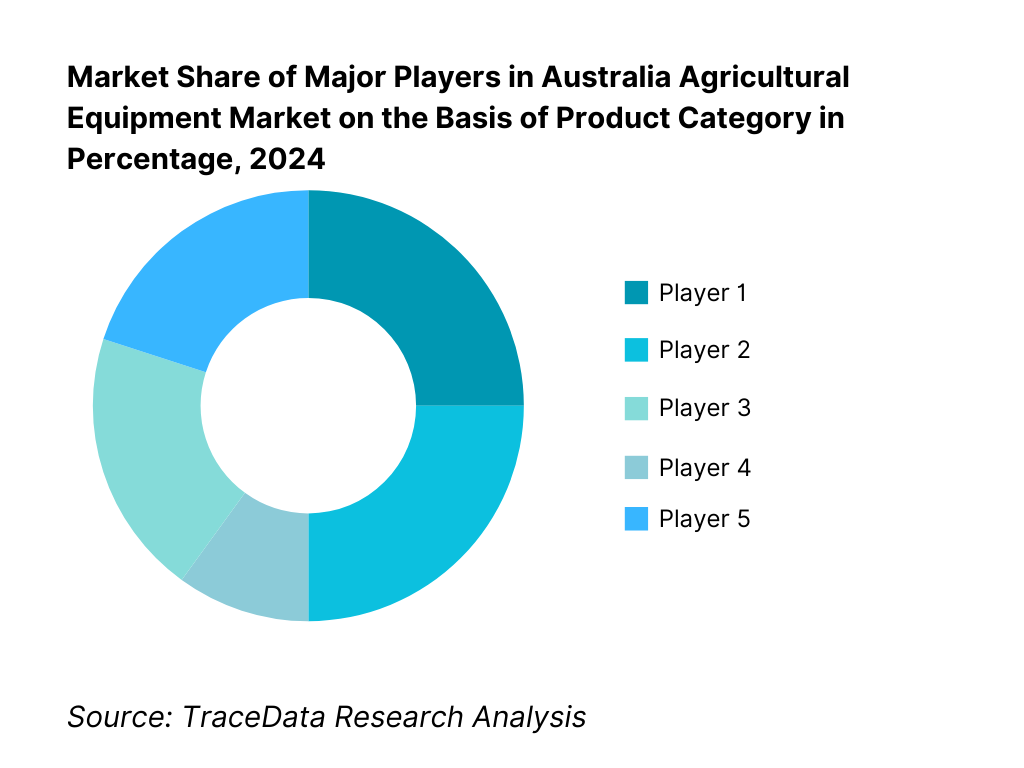
The Australia agricultural equipment market is moderately consolidated, with a handful of global OEMs and strong local distributors holding significant influence. Key players such as John Deere, AGCO (Massey Ferguson/Fendt), Kubota Australia, CLAAS Harvest Centre, and CNH Industrial dominate through extensive dealer networks, localized product adaptations, and integrated precision-ag offerings. However, the increasing presence of specialist manufacturers and technology-driven entrants, alongside expanding digital sales channels and dealer-led e-commerce platforms, is broadening purchasing options and service models for Australian farmers.
Name | Founding Year | Original Headquarters |
John Deere | 1837 | Grand Detour, Illinois, USA |
AGCO (Massey Ferguson / Fendt) | 1990 | Duluth, Georgia, USA |
Kubota Corporation | 1890 | Osaka, Japan |
CLAAS | 1913 | Harsewinkel, Germany |
CNH Industrial (Case IH & New Holland) | 2013* | London, United Kingdom |
Mahindra Agriculture & Farm Machinery | 1945 | Mumbai, India |
Kioti (Daedong) | 1947 | Daegu, South Korea |
JCB Agriculture Australia | 1945 | Rocester, Staffordshire, UK |
Krone Australia | 1906 | Spelle, Germany |
KUHN Farm Machinery Australia | 1828 | Saverne, France |
Croplands Equipment | 1972 | Adelaide, South Australia |
Goldacres | 1978 | Ballarat, Victoria, Australia |
HARDI Australia | 1957 | Adelaide, South Australia |
SwarmFarm Robotics | 2012 | Emerald, Queensland, Australia |
Loam Bio | 2019 | Orange, New South Wales, Australia |
Some of the Recent Competitor Trends and Key Information About Competitors Include:
John Deere: Continued rollout of Operations Center connectivity across dealer deliveries, with growing adoption of autosteer, section control, and machine health monitoring on broadacre fleets; increased interest in high-capacity X-series combines and See & Spray selective spraying options in grain regions.
CNH Industrial (Case IH & New Holland): Expanded AFS/PLM connected platforms across Magnum/Steiger and T7/T8 ranges; strong traction for Case IH Austoft cane harvesters in Queensland and New Holland balers with large contracting fleets in mixed farming districts.
AGCO (Massey Ferguson & Fendt): Wider deployment of FendtONE and IDEAL combines in broadacre; Precision Planting hardware integrations on air seeders and planters gaining dealer support for variable rate and section control upgrades.
Kubota Australia: Solid momentum in compact and utility M-series tractors for livestock and horticulture; expanding RTV and implements bundles via national dealers to target mixed and small-acreage operators.
CLAAS Harvest Centre (CLAAS): Ongoing network investments and support for LEXION and TRION combines; increased take-up of CLAAS telematics and yield-mapping in large grain operations needing high uptime and service coverage.
What Lies Ahead for Australia Agricultural Equipment Market?
The Australia agricultural equipment market is expected to expand steadily by 2029, supported by continuous mechanization in broadacre cropping, rising adoption of precision agriculture technologies, and ongoing government incentives for water-efficient irrigation and carbon-conscious farming practices. Labor shortages, climate variability, and the need for higher operational efficiency will further accelerate investment in advanced machinery and digital farming solutions.
Rise of Connected and Autonomous Machinery: The future will see rapid integration of connectivity and automation in tractors, combines, sprayers, and seeders. GNSS guidance, telematics, and autonomous platforms will reduce labor dependency, optimize input use, and increase operational efficiency across large cropping areas.
Focus on Sustainability-Driven Equipment Upgrades: Growing pressure to reduce emissions and meet environmental stewardship goals will drive upgrades to fuel-efficient engines, ISOBUS-compatible implements, and variable-rate technologies. This will align equipment investments with farm sustainability targets and compliance standards.
Expansion of Segment-Specific Machinery Solutions: Demand for specialized machinery will increase in horticulture, viticulture, and livestock enterprises, alongside broadacre operations. This will create opportunities for compact tractors, vineyard harvesters, feed mixers, and crop-specific spraying systems.
Leveraging AI, Sensors, and Data Analytics: AI-driven vision systems, real-time sensor data, and predictive analytics will transform machinery into decision-support tools. Farmers will use these capabilities to improve yield mapping, detect weeds for targeted spraying, and conduct predictive maintenance, enhancing ROI and uptime.
Australia Agricultural Equipment Market Segmentation
By Equipment Type
Tractors
Harvesting Machinery
Seeding & Tillage Equipment
Spraying & Irrigation Equipment
Hay & Forage Equipment
By Drive & Powertrain
Two-Wheel Drive (2WD)
Four-Wheel Drive (4WD)
Tracks
Transmission Types
Fuel Type
By Farm Enterprise
Broadacre Grains & Oilseeds
Cotton
Sugarcane
Horticulture (Fruit & Vegetables)
Viticulture (Wine Grapes & Table Grapes)
Dairy Farming
Beef & Sheep Livestock
Mixed Farming
By Ownership & Sales Channel
New Equipment
Used/Refurbished Equipment
Rental/Leasing
Auction Sales
Dealer Sales
Online Marketplace Sales
By Region
New South Wales
Victoria
Queensland
South Australia
Western Australia
Tasmania
Northern Territory
Australian Capital Territory
Players Mentioned in the Report:
John Deere (Deere & Company)
AGCO (including Massey Ferguson/Fendt)
Kubota Australia
CLAAS Harvest Centre (CLAAS)
CNH Industrial (Case IH & New Holland)
Mahindra Agriculture & Farm Machinery
Kioti (Daedong)
JCB Agriculture Australia
Krone Australia
KUHN Farm Machinery Australia
Croplands Equipment
Goldacres
HARDI Australia
SwarmFarm Robotics (ag-tech OEM)
Loam Bio (soil-tech machinery adjacent)
Key Target Audience
Large-scale farm operators & broadacre aggregators
Agricultural contractors & service providers
Equipment importers & dealer networks
Investments and venture capitalist firms (e.g., ag-tech focused VCs)
Government and regulatory bodies (National Farmers’ Federation, AgriFutures Australia, Regional Investment Corporation)
Agricultural equipment finance providers & banks
Carbon-credit aggregators and renewable farming promoters
Ag-tech integration platforms and digital service providers
Time Period:
Historical Period: 2019-2024
Base Year: 2025
- Forecast Period: 2025-2030
Report Coverage
Choose individual sections to purchase. Mix and match as you like.
4.1. Distribution Model Analysis for Agricultural Equipment-Dealer, Distributor, Direct OEM Sales, Auction, and Online-Margins, Preferences, Strengths, and Weaknesses
4.2. Revenue Streams for Agricultural Equipment Manufacturers and Dealers
4.3. Business Model Canvas for Australia Agricultural Equipment Market
5.1. Independent Dealers vs OEM-Owned Dealership Networks
5.2. Investment Models in Australian Agricultural Equipment Dealerships
5.3. Comparative Analysis of Sales Funnel Processes by Private and Government Machinery Procurement Programs
5.4. Agricultural Equipment Capex Allocation by Farm Size, 2025
8.1. Revenues, 2019-2025
9.1. By Equipment Type (Tractors, Harvesting, Seeding & Tillage, Spraying & Irrigation, Hay & Forage), 2024-2025P
9.2. By Power & Capacity Class (HP ranges, Combine Classes, Tank/Boom Sizes), 2024-2025P
9.3. By Farm Enterprise (Broadacre Grains & Oilseeds, Cotton, Sugarcane, Horticulture, Viticulture, Dairy, Beef/Sheep, Mixed Farming), 2024-2025P
9.4. By Ownership & Sales Channel (New, Used, Rental/Lease, Auction, Online Marketplace, Dealer Sales), 2024-2025P
9.5. By Technology Readiness (Guidance-Ready, Auto-Steer, RTK, ISOBUS, VRT, Telematics, Autonomy-Ready), 2024-2025P
9.6. By Finance Structure (Cash, Chattel Mortgage, Hire Purchase, Operating Lease, Captive Finance), 2024-2025P
9.7. By Region (NSW, VIC, QLD, SA, WA, TAS, NT, ACT), 2024-2025P
10.1. Farm Operator Profiles and Cohort Analysis
10.2. Equipment Procurement Needs and Decision-Making Processes
10.3. Equipment Utilization Efficiency and ROI Analysis
10.4. Gap Analysis Framework
11.1. Trends and Developments in the Australia Agricultural Equipment Market
11.2. Growth Drivers in the Australia Agricultural Equipment Market
11.3. SWOT Analysis of the Australia Agricultural Equipment Market
11.4. Issues and Challenges in the Australia Agricultural Equipment Market
11.5. Government Regulations Affecting Agricultural Equipment (ADR Width/Lighting, Safety Standards, Emissions Compliance, Biosecurity)
12.1. Market Size and Future Potential for Digital and Auction Platforms, 2019-2030
12.2. Business Models and Revenue Streams
12.3. Sales Formats and Equipment Types Offered
12.4. Cross-Comparison of Leading Digital & Auction Platforms based on Company Overview, Reach, Revenues, Equipment Listings, Fees, and Others
15.1. Market Share of Key Players by Revenues, 2024
15.2. Benchmark of Key Competitors including Company Overview, USP, Business Strategies, Business Model, Dealer Footprint, Revenues, Pricing by Equipment Category, Technology Used, Best-Selling Models, Major Clients, Strategic Tie-Ups, Marketing Strategy, Recent Developments, and Others
15.3. Operating Model Analysis Framework
15.4. Competitive Positioning Map (Technology vs Price)
15.5. Bowmans Strategic Clock for Competitive Advantage
16.1. Revenues, 2026-2030
17.1. By Equipment Type (Tractors, Harvesting, Seeding & Tillage, Spraying & Irrigation, Hay & Forage), 2026-2030
17.2. By Power & Capacity Class, 2026-2030
17.3. By Farm Enterprise, 2026-2030
17.4. By Ownership & Sales Channel, 2026-2030
17.5. By Technology Readiness, 2026-2030
17.6. By Finance Structure, 2026-2030
17.7. By Region, 2026-2030
Research Methodology
Step 1: Ecosystem Creation
We begin by mapping the complete ecosystem of the Australia Agricultural Equipment Market, identifying both demand-side entities (broadacre grain producers, cotton growers, horticulture/viticulture operators, dairy and livestock enterprises, contractors, rental fleet operators) and supply-side entities (OEMs, regional manufacturers, distributors, dealer networks, parts & service providers, precision ag solution vendors, and financial institutions). From this mapped ecosystem, we shortlist 5–6 leading equipment suppliers and distributors based on financial performance, dealer coverage, technology offerings, and penetration across key agricultural regions. Sourcing is conducted through government publications, agricultural industry bodies, OEM reports, and proprietary databases to assemble reliable industry-level information.
Step 2: Desk Research
A comprehensive desk research process is undertaken using official agricultural production statistics, import/export records, and machinery registration data from credible government sources such as the Australian Bureau of Statistics (ABS) and the Department of Agriculture, Fisheries and Forestry (DAFF). This research covers total equipment penetration by type, fleet age distribution, technology adoption levels, and product mix trends. Company-level data, including financial statements, dealer counts, parts/service network scope, and product portfolio breadth, are gathered from press releases, annual reports, and government registries. This step builds a solid fact base on market structure, product performance, and competitive positioning.
Step 3: Primary Research
We conduct in-depth interviews with C-suite executives, product managers, dealer principals, and precision-ag specialists from OEMs and key dealerships, as well as end-users across major cropping and livestock regions. These interviews validate market hypotheses, confirm statistical findings, and uncover operational and financial insights such as sales seasonality, trade-in ratios, technology-driven upselling, and aftermarket subscription adoption. A bottom-up approach is applied to assess equipment volumes and value contributions per player, later aggregated to determine total market size. As part of our validation, we conduct disguised interviews—approaching OEMs and dealers as prospective buyers—to cross-check delivery lead times, configuration availability, and pricing dynamics.
Step 4: Sanity Check
The final stage applies a dual bottom-up and top-down validation of the market size and segmentation. This includes reconciling machine registration data with dealer shipment records, adjusting for import/export flows, and accounting for second-hand sales that influence new-equipment demand. Market modeling exercises ensure alignment between supply-side volumes, demand-side capacity needs, and macroeconomic indicators such as agricultural GDP, planted hectare data, and commodity export performance. This rigorous cross-verification ensures accuracy and reliability of the market estimates.
FAQs
01 What is the potential for the Australia Agricultural Equipment Market?
The Australia Agricultural Equipment Market shows strong potential, underpinned by large broadacre cropping footprints, diversified farm enterprises (grains & oilseeds, cotton, sugarcane, horticulture, viticulture, and livestock), and accelerating adoption of precision technologies. Persistent labor tightness, climate variability, and the push for higher input-use efficiency are compelling upgrades across tractors, combines, sprayers, seeders, and hay & forage lines. Growing use of guidance, RTK, section control, and telematics—plus dealer-backed finance and aftermarket subscriptions—further expands the market’s revenue pools across both new and used equipment cycles.
02 Who are the Key Players in the Australia Agricultural Equipment Market?
The market features several leading OEMs and strong regional manufacturers/distributors, including John Deere, CNH Industrial (Case IH & New Holland), AGCO (Massey Ferguson & Fendt), Kubota Australia, and CLAAS. Other prominent names include Mahindra Agriculture & Farm Machinery, Kioti (Daedong), JCB Agriculture, Krone Australia, KUHN Farm Machinery Australia, Croplands Equipment, Goldacres, HARDI Australia, SwarmFarm Robotics, and Loam Bio. These players differentiate through dealer network depth, product breadth (from compact to high-HP), localized engineering, precision-ag ecosystems, and robust parts/service coverage.
03 What are the Growth Drivers for the Australia Agricultural Equipment Market?
Key growth drivers include mechanization across vast broadacre hectares, rising precision-ag adoption (GNSS guidance, variable-rate, ISOBUS), and connectivity improvements that enable telematics and remote diagnostics. Government and regulatory focus on water-efficient irrigation and chemical stewardship supports upgrades to advanced spraying and irrigation systems. Dealer financing, trade-in programs, and strong used-equipment liquidity reduce acquisition frictions. Meanwhile, digital agronomy workflows and autonomy pilots increase the value of high-spec machines, reinforcing replacement and expansion cycles across cropping and mixed-farming enterprises.
04 What are the Challenges in the Australia Agricultural Equipment Market?
Challenges include seasonal and regional climate volatility that compresses operating windows; logistics and import lead-time variability that can affect machine delivery and parts availability; and evolving right-to-repair expectations and software access considerations. Biosecurity compliance adds time and process rigor for imported machinery. Capital intensity and the need for skilled operators/technicians can strain smaller farms and contractors. Finally, ensuring safe road transport of wide machines (booms, fronts) and adherence to stewardship requirements for chemical application increase complexity in specification and operations.