Australia Alcoholic Drinks Market Outlook to 2029
By Market Structure, By Product Types (Beer, Wine, Spirits, Others), By Consumer Demographics, By Distribution Channels (On-trade, Off-trade), and By Region
Report Overview
Report Code
TDR0110
Coverage
Asia
Published
January 2025
Pages
80
Flexible Purchase Options
Select and purchase only the chapters you need for your strategic decisions
On This Page
Report Overview
The report titled "Australia Alcoholic Drinks Market Outlook to 2029 - By Market Structure, By Product Types (Beer, Wine, Spirits, Others), By Consumer Demographics, By Distribution Channels (On-trade, Off-trade), and By Region" provides a comprehensive analysis of the alcoholic drinks market in Australia. The report covers an overview and genesis of the industry, overall market size in terms of revenue, market segmentation, trends and developments, regulatory landscape, consumer preferences, issues and challenges, and a comparative landscape including competition scenario, opportunities, and bottlenecks. It also includes company profiling of major players in the Australian alcoholic drinks market.
Report Coverage
Verified Market Sizing
Multi-layer forecasting with historical data and 5–10 year outlook
Deep-Dive Segmentation
Cross-sectional analysis by product type, end user, application and region
Competitive Benchmarking & Positioning
Market share, operating model, pricing and competition matrices
Actionable Insights & Risk Assessment
High-growth white spaces, underserved segments, technology disruptions and demand inflection points
Review Methodology & Data Structure
Preview report structure, data sources and research framework
Executive Summary
The report titled "Australia Alcoholic Drinks Market Outlook to 2029 - By Market Structure, By Product Types (Beer, Wine, Spirits, Others), By Consumer Demographics, By Distribution Channels (On-trade, Off-trade), and By Region" provides a comprehensive analysis of the alcoholic drinks market in Australia. The report covers an overview and genesis of the industry, overall market size in terms of revenue, market segmentation, trends and developments, regulatory landscape, consumer preferences, issues and challenges, and a comparative landscape including competition scenario, opportunities, and bottlenecks. It also includes company profiling of major players in the Australian alcoholic drinks market. The report concludes with future market projections based on revenue, market structure, product types, and region, highlighting key opportunities and challenges.
Australia Alcoholic Drinks Market Overview and Size
The Australia alcoholic drinks market reached a valuation of AUD 20 billion in 2023, driven by a growing population of legal drinking age, increased consumer preference for premium drinks, and a shift towards healthier alcoholic options such as low- and non-alcoholic beverages. Major players in this market include Carlton & United Breweries, Lion, Accolade Wines, and Treasury Wine Estates. These companies are known for their strong distribution networks, diversified product portfolios, and innovative marketing strategies.
In 2023, Treasury Wine Estates launched a new range of organic wines to cater to growing consumer demand for sustainable and healthier drink options. Key regions such as New South Wales, Victoria, and Queensland are significant markets due to their high population densities and robust hospitality industries.
Market Size for Australia Alcoholic Beverage Industry on the Basis of Revenue in USD Billion, 2018-2024

What Factors are Leading to the Growth of Australia Alcoholic Drinks Market:
Economic Factors: The economic recovery post-pandemic and rising disposable income have contributed to increased spending on premium alcoholic beverages in Australia. In 2023, premium alcohol products accounted for approximately 35% of total sales in the country, driven by consumers' preference for quality over quantity. This shift is especially evident in craft beers, boutique spirits, and premium wines, where consumers are willing to pay more for better experiences.
Health Consciousness and New Preferences: As health consciousness rises, there has been a noticeable shift towards low- and non-alcoholic drinks. In 2023, low-alcohol beverages accounted for 12% of total market sales, up from 8% in 2020. This trend is fueled by consumers looking for healthier alternatives while still enjoying the taste and social aspects of drinking. Brands are increasingly innovating in this space, offering more options that align with the demand for "better for you" drinks.
Digitalization of Sales Channels: The digitalization of retail channels has significantly impacted the way consumers purchase alcoholic drinks. In 2023, around 25% of alcohol sales were conducted online, a marked increase from 15% in 2020. E-commerce platforms and alcohol delivery services have enhanced convenience, allowing consumers to access a wide variety of brands and product types at the click of a button. This shift has especially benefited the sale of niche products, such as boutique spirits and international wines.
Which Industry Challenges Have Impacted the Growth for Australia Alcoholic Drinks Market:
Regulatory and Taxation Hurdles: High excise taxes on alcoholic beverages, particularly on spirits, remain a significant barrier to market growth. In 2023, excise taxes accounted for up to 50% of the retail price for certain alcoholic products, limiting affordability and constraining consumption, especially for budget-conscious consumers. This high tax burden can also discourage smaller players from entering the market due to the associated costs and compliance complexity.
Health Concerns and Alcohol Regulations: Increasing awareness of health risks associated with alcohol consumption has led to stricter regulations on marketing and advertising. In 2023, Australia implemented new advertising restrictions targeting alcohol promotions on social media and public platforms, limiting exposure to younger audiences. Additionally, campaigns promoting alcohol moderation, such as "Dry July" and "Ocsober," have gained popularity, contributing to a decline in overall consumption.
Supply Chain Disruptions: The alcoholic drinks market in Australia has faced challenges due to global supply chain disruptions, particularly for imported spirits and wine. In 2023, delays in raw material sourcing and increased transportation costs resulted in inventory shortages and higher prices for imported alcoholic products. This issue has particularly impacted small and medium-sized businesses that rely heavily on international suppliers, further hindering market growth.
What are the Regulations and Initiatives which have Governed the Market:
Excise Tax Regulations: The Australian government imposes a specific excise duty on alcoholic beverages, which varies based on the type and alcohol content. In 2023, beer, spirits, and ready-to-drink (RTD) products faced significant tax hikes, with spirits taxed at higher rates compared to wine. The taxation system is designed to discourage excessive alcohol consumption, but it has also placed financial pressure on manufacturers and consumers alike, influencing market dynamics.
Alcohol Advertising Regulations: To mitigate the impact of alcohol consumption, particularly on minors, the Australian government has implemented stringent advertising regulations. As of 2023, restrictions have been placed on alcohol-related advertisements during live sports broadcasts, digital platforms, and social media, particularly during times when children may be exposed. These regulations aim to curb alcohol consumption by younger demographics and promote responsible marketing practices.
Government Initiatives for Low and Non-Alcoholic Beverages: In response to growing health consciousness, the Australian government has supported the production and marketing of low- and non-alcoholic beverages. In 2023, incentives were introduced, such as reduced taxes and funding grants, to promote the development of healthier alcoholic alternatives. This initiative has contributed to a rise in sales of low-alcohol and alcohol-free products, which now account for a growing segment of the market.
Australia Alcoholic Drinks Market Segmentation
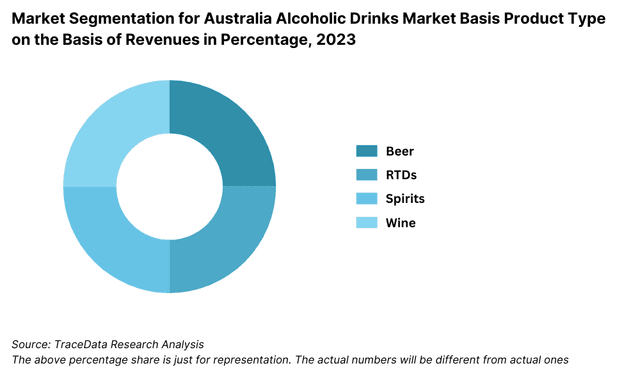
By Product Type: The alcoholic drinks market in Australia is segmented into beer, wine, spirits, and ready-to-drink (RTD) beverages. Beer continues to dominate the market, accounting for over 40% of total sales in 2023, driven by the popularity of craft beers and a wide range of local and international brands. Wine follows closely, with both premium and mid-range wine products enjoying strong demand. Spirits, especially gin and whiskey, have seen a rise in popularity due to the growing cocktail culture, while RTDs have gained traction among younger consumers seeking convenience and lower alcohol content.
Market Segmentation for Australia Alcoholic Drinks Market Basis Product Type on the Basis of Revenues in Percentage, 2023
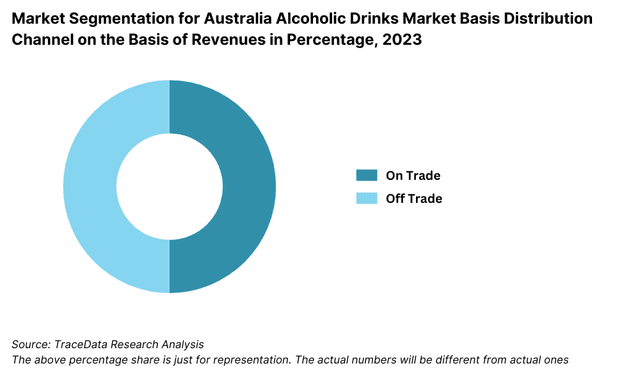
By Distribution Channel: Supermarkets and liquor stores are the leading distribution channels for alcoholic beverages in Australia, contributing to more than 70% of sales in 2023. Online sales have rapidly expanded, accounting for approximately 15% of total sales as consumers increasingly opt for the convenience of home delivery. Pubs, bars, and restaurants also play a key role, especially in urban areas where social drinking is prevalent, contributing significantly to premium alcohol sales.
Market Segmentation for Australia Alcoholic Drinks Market Basis Distribution Channel on the Basis of Revenues in Percentage, 2023
By Consumer Demographics: Consumers aged 25-44 are the most significant contributors to the alcoholic drinks market, driven by social gatherings and a preference for premium beverages. Younger consumers (18-24) tend to favor RTDs and lighter alcoholic drinks, while older demographics (45+) show a preference for wine, particularly premium and organic varieties. Health-conscious consumers across all age groups are increasingly turning to low-alcohol and non-alcoholic alternatives, reflecting a shift in consumption habits.
Competitive Landscape in Australia Alcoholic Drinks Market
The Australia alcoholic drinks market is relatively competitive, with a mix of established global brands and growing local producers. Major players such as Carlton & United Breweries, Lion, Accolade Wines, and Treasury Wine Estates dominate the market. However, the increasing presence of smaller craft breweries, boutique distilleries, and emerging wine producers has diversified the market, offering consumers a broader selection of products and niche experiences.
Company Name | Establishment Year | Headquarters |
|---|---|---|
Carlton & United Breweries | 1907 | Melbourne, Victoria |
Lion | 1840 | Sydney, New South Wales |
Treasury Wine Estates | 2011 (roots in 1843) | Melbourne, Victoria |
Asahi Beverages | 1889 | Tokyo, Japan |
Diageo | 1997 | London, United Kingdom |
Pernod Ricard | 1975 | Paris, France |
Brown Brothers | 1889 | Milawa, Victoria |
Coopers Brewery | 1862 | Adelaide, South Australia |
Casella Family Brands | 1965 | Yenda, New South Wales |
Accolade Wines | 1853 | Southbank, Victoria |
Some of the recent competitor trends and key information about competitors include:
Carlton & United Breweries: As a major player in Australia’s beer market, CUB remains a dominant force. In 2023, CUB expanded its craft beer portfolio through strategic acquisitions of local breweries, catering to growing consumer demand for unique, artisanal brews.
Lion: Known for its wide range of beer and cider products, Lion saw a 10% growth in craft beer sales in 2023, fueled by its Little Creatures and James Squire brands. The company has also invested heavily in sustainability, aiming to achieve carbon neutrality by 2030.
Accolade Wines: A leader in the wine segment, Accolade Wines experienced a 15% rise in premium wine sales in 2023, driven by the success of its Hardys and St Hallett brands. The company continues to expand its organic and sustainable wine offerings to meet growing consumer demand for eco-friendly products.
Treasury Wine Estates: Treasury Wine Estates, one of the world’s largest wine companies, reported a 12% increase in international wine exports in 2023, particularly to markets in the Asia-Pacific region. The company’s premium brands, such as Penfolds, continue to be a key driver of revenue.
Coopers Brewery: As Australia’s largest family-owned brewery, Coopers saw a 20% increase in sales of its signature pale ale in 2023. The company also introduced a new line of non-alcoholic beers, catering to the rising trend of health-conscious consumers.
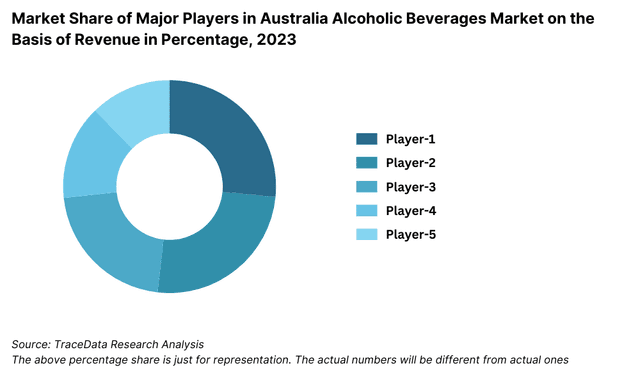
Market Share of Major Players in Australia Alcoholic Beverages Market on the Basis of Revenue in Percentage, 2023
What Lies Ahead for Australia Alcoholic Drinks Market?
The Australia alcoholic drinks market is projected to witness steady growth through 2029, driven by shifts in consumer preferences, increasing demand for premium beverages, and advancements in distribution channels. The market is expected to register a healthy CAGR during the forecast period, supported by various emerging trends and external factors.
Rise in Low and Non-Alcoholic Beverage Demand: As health-consciousness grows among Australian consumers, the demand for low- and non-alcoholic beverages is set to increase. This segment, which already represented around 12% of the market in 2023, is projected to expand further as manufacturers innovate with new flavors and healthier formulations. Government and public health initiatives promoting responsible drinking will also bolster this trend.
Premiumization of Alcoholic Beverages: The trend towards premiumization will continue to drive growth, with consumers willing to pay more for high-quality craft beers, artisanal spirits, and fine wines. This shift is likely to be particularly strong in metropolitan areas, where social drinking trends are evolving, and consumers are opting for more personalized and exclusive experiences.
Growth of E-Commerce and Digital Platforms: The rise of online alcohol sales is expected to persist as consumers increasingly embrace the convenience of home delivery services. By 2029, it is anticipated that e-commerce will account for over 20% of total alcohol sales, aided by investments in digital marketing and the expansion of online liquor retailers. The integration of AI for personalized recommendations and seamless payment processes will further enhance the consumer experience.
Focus on Sustainability and Ethical Consumption: Sustainability will be a key driver in shaping consumer choices. Australian alcohol manufacturers are likely to focus on reducing their environmental impact by adopting sustainable packaging, reducing carbon footprints, and supporting local communities. This focus on eco-friendly practices will appeal to the growing segment of environmentally conscious consumers.
Future Outlook and Projections for Australia Alcoholic Beverages Market on the Basis of Revenues in USD Billion, 2024-2029


Australia Alcoholic Drinks Market Segmentation
- By Alcohol Type:
- Beer
- Spirits (Whiskey, Vodka, Rum)
- Wine (Red, White, Sparkling)
- Cider
- Ready-to-Drink (RTD) Cocktails
- By Beer
- Lager
- Dark Beer and others
- By Beer
- Craft
- Standard Beer
- By RTDs
- Malt based RTDs
- Spirit Based RTDs
- Wine Based RTDs
- Non-Alcoholic RTDs and others
- By Spirits
- Brandy
- Dark Rum
- White Rum
- Whiskies
- Gin
- Vodka and others
- By Vodka
- Flavoured
- Non-Flavoured Vodka
- By Wine
- Fortified Wine
- Champagne
- Other Sparkling Wine
- Red Wine
- White Wine and others
- By Distribution Channel:
- On-Trade (Bars, Restaurants, Hotels)
- Off-Trade (Supermarkets, Hypermarkets, Convenience Stores)
- By Price Segment:
- Economy
- Mid-Range
- Premium
- Super Premium
- By Consumer Age:
- 18-24
- 25-34
- 35-54
55+
By Region:
New South Wales
Victoria
Queensland
Western Australia
South Australia
Tasmania
Northern Territory
Players Mentioned in the Report:
Bacardi & Company Limited
Diageo Plc
Constellation Brands, Inc.
Heineken Holding N.V.
Anheuser-Busch InBev SA/NV
Brown-Forman Corporation
Molson Coors Beverage Company
Pernod Ricard S.A.
Grupo Corona
Vok Beverages Pty Ltd
Key Target Audience:
Alcoholic Beverage Manufacturers
Alcohol Distributors and Retailers
Online Liquor Platforms
Hospitality Industry
Regulatory Bodies (e.g., Australian Government Department of Health)
Research and Development Institutions
Time Period:
Historical Period: 2018-2023
Base Year: 2024
Forecast Period: 2024-2029
Explore Flexible Purchase Options or Have Limited Budget?
Pay only for relevant chapters • Customizable report sections
Table of Contents
Choose individual sections to purchase. Mix and match as you like.
4.1. Value Chain Process-Role of Entities, Stakeholders, Gross Margins, and Challenges they Face
4.2. Business Model Canvas for Australia Alcoholic Drinks Market
4.3. Consumer Buying Decision Process
5.1. Market Overview and Genesis
5.2. Number of Breweries and Microbreweries, as on Date
8.1. Revenues, 2018-2024
8.2. Sales Volume, 2018-2024
9.1. By Type (Beer, Cider, RTDs, Spirits and Wine), 2018-2023
9.1.1. By Beer (Lager, Dark Beer and others), 2018-2023
9.1.1.1. By Lager (Domestic Premium and Imported Premium), 2018-2023
9.1.1.2. By Craft and Standard Beer, 2018-2023
9.1.1.3. By Price (Super Premium, Premium, Standard and Economy), 2018-2023
9.1.2. By RTDs (Malt based RTDs, Spirit Based RTDs, Wine Based RTDs, Non-Alcoholic RTDs and others), 2018-2023
9.1.2.1. By Price (Super Premium, Premium, Standard and Economy), 2018-2023
9.1.3. By Spirits (Brandy, Dark Rum, White Rum, Whiskies, Gin, Vodka and others), 2018-2023
9.1.3.1. By Price (Super Premium, Premium, Standard and Economy), 2018-2023
9.1.3.2. By Flavoured and Non-Flavoured Vodka, 2018-2023
9.1.4. By Wine (Fortified Wine, Champagne, Other Sparkling Wine, Red Wine, White Wine and others), 2018-2023
9.1.4.1. By Price (Super Premium, Premium, Standard and Economy), 2018-2023
9.2. By Off Trade and On Trade for Each Type of Alcoholic Beverages, 2023
9.2.1. By Distribution Channel for Off Trade, 2023
9.3. By Region, 2023-2024P
10.1. Customer Landscape and Segment Analysis
10.2. Customer Journey and Decision-Making Process
10.3. Consumer Needs, Preferences, and Pain Points
10.4. Gap Analysis Framework
11.1. Trends and Developments in Australia Alcoholic Drinks Market
11.2. Growth Drivers for Australia Alcoholic Drinks Market
11.3. SWOT Analysis for Australia Alcoholic Drinks Market
11.4. Issues and Challenges for Australia Alcoholic Drinks Market
11.5. Government Regulations for Australia Alcoholic Drinks Market
14.1. Market Share of Key Players in Alcoholic Beverages Market, 2023
14.2. Market Share of Key Players in Beer Market, 2023
14.3. Market Share of Key Players in Wine Market, 2023
14.4. Market Share of Key Players in Spirits Market, 2023
14.5. Market Share of Key Players in RTDs Market, 2023
14.6. Benchmark of Key Competitors in Australia Alcoholic Drinks Market Basis 15-20 Operational and Financial Parameters
14.7. Strength and Weakness of Key Competitors
14.8. Operating Model Analysis Framework
14.9. Gartner Magic Quadrant for Market Positioning
14.10. Bowmans Strategic Clock for Competitive Advantage
15.1. Revenues, 2025-2029
15.2. Sales Volume, 2025-2029
16.1. By Type (Beer, Cider, RTDs, Spirits and Wine), 2025-2029
16.1.1. By Beer (Lager, Dark Beer and others), 2025-2029
16.1.1.1. By Lager (Domestic Premium and Imported Premium), 2025-2029
16.1.1.2. By Craft and Standard Beer, 2025-2029
16.1.1.3. By Price (Super Premium, Premium, Standard and Economy), 2025-2029
16.1.2. By RTDs (Malt based RTDs, Spirit Based RTDs, Wine Based RTDs, Non-Alcoholic RTDs and others), 2025-2029
16.1.2.1. By Price (Super Premium, Premium, Standard and Economy), 2025-2029
16.1.3. By Spirits (Brandy, Dark Rum, White Rum, Whiskies, Gin, Vodka and others), 2025-2029
16.1.3.1. By Price (Super Premium, Premium, Standard and Economy), 2025-2029
16.1.3.2. By Flavoured and Non-Flavoured Vodka, 2025-2029
16.1.4. By Wine (Fortified Wine, Champagne, Other Sparkling Wine, Red Wine, White Wine and others), 2025-2029
16.1.4.1. By Price (Super Premium, Premium, Standard and Economy), 2025-2029
16.2. By Off Trade and On Trade for Each Type of Alcoholic Beverages, 2025-2029
16.2.1. By Distribution Channel for Off Trade, 2025-2029
16.3. By Region, 2025-2029
17.1. Strategic Recommendations
17.2. Opportunity Identification
Discuss a Customized Research Scope
Custom research scope • Tailored insights • Industry expertise
Research Methodology
Step 1: Ecosystem Creation
Map the Ecosystem: Identify all key demand-side and supply-side stakeholders within the Australia Alcoholic Drinks Market. This includes manufacturers, distributors, retailers, consumers, and regulatory bodies. Based on this ecosystem, we will shortlist the leading 5-6 companies in the market based on financial data, market share, and production capacity.
Sourcing Information: Information is gathered through a variety of industry articles, government reports, secondary research, and proprietary databases. This process is critical to compiling relevant industry-level insights and gaining a comprehensive understanding of the overall market landscape.
Step 2: Desk Research
Data Collection: Extensive desk research is carried out by referencing diverse secondary sources such as market reports, company press releases, financial statements, annual reports, and proprietary databases. This process helps us gather market size, player-specific information, sales volumes, pricing trends, and demand fluctuations.
Company-Level Analysis: Detailed analysis is conducted on major players within the industry by reviewing company-specific data from financial statements, recent developments, and market strategies. This provides a thorough understanding of each company's position within the market and its competitive advantage.
Step 3: Primary Research
Stakeholder Interviews: A series of in-depth interviews are conducted with C-level executives and stakeholders from various Australian alcoholic drinks companies and retail outlets. These interviews serve to validate market hypotheses, authenticate data obtained through secondary research, and gather valuable operational insights. Both bottom-up and top-down approaches are applied to assess volume sales for each player and derive the overall market size.
Validation Through Disguised Interviews: In some cases, we conduct disguised interviews, approaching companies as potential consumers to validate operational and financial insights. This cross-verification ensures the accuracy and reliability of the data collected and enhances the overall understanding of pricing structures, revenue streams, and value chain dynamics.
Step 4: Sanity Check
- Market Size Validation: A thorough bottom-up and top-down market size modeling approach is conducted to verify the integrity of the data collected. The results are cross-checked through various methods, including company comparisons and market trends analysis, ensuring that the final data aligns with realistic market conditions and projections.
See What's Inside the Report
Get a preview of key findings, methodology and report coverage
Frequently Asked Questions
The Australia alcoholic drinks market is expected to grow steadily through 2029, with a valuation of AUD 20 billion in 2023. This growth is driven by factors such as increased consumer preference for premium products, a growing interest in low- and non-alcoholic beverages, and advancements in e-commerce sales. The rising demand for innovative craft beers, spirits, and boutique wines also fuels the market's potential.
Key players in the Australia alcoholic drinks market include Carlton & United Breweries, Lion, Accolade Wines, Treasury Wine Estates, and Coopers Brewery. These companies dominate due to their strong brand presence, extensive distribution networks, and diverse product portfolios. Emerging players, particularly in the craft beer and boutique spirits segments, are also gaining traction as they cater to niche markets.
The primary growth drivers include increasing consumer demand for premium alcoholic beverages, the rising trend of health-conscious drinking with low- and non-alcoholic options, and the expansion of online retail platforms. Additionally, innovations in product offerings, particularly in craft beer and flavored spirits, continue to attract a broader consumer base.
The market faces several challenges, including regulatory hurdles, such as high excise taxes on alcoholic beverages and restrictions on advertising. Supply chain disruptions and the increasing pressure to adopt sustainable practices can also pose operational difficulties for manufacturers. Furthermore, changing consumer preferences towards healthier lifestyle choices may limit the consumption of traditional alcoholic beverages.
License Options
PDF + Excel
Complete report package
$4,000
Excel Only
Data and analytics
$2,500
Custom Sections
Starts from $100
$0