Australia Biofertilizers Market Outlook to 2030
By Microorganism Type (Rhizobium/Bradyrhizobium, Azospirillum, Azotobacter, Bacillus spp., Pseudomonas spp., Trichoderma spp., Arbuscular Mycorrhizae (AMF), and Cyanobacteria), By Product Function (Nitrogen-Fixing Inoculants, Phosphate-Solubilizers, Potas
Report Overview
Report Code
TDR0218
Coverage
Asia
Published
August 2025
Pages
80
Flexible Purchase Options
Select and purchase only the chapters you need for your strategic decisions
On This Page
Report Overview
The report titled “Australia Biofertilizers Market Outlook to 2030 – By Microorganism Type (Rhizobium/Bradyrhizobium, Azospirillum, Azotobacter, Bacillus spp., Pseudomonas spp., Trichoderma spp., Arbuscular Mycorrhizae (AMF), and Cyanobacteria), By Product Function (Nitrogen-Fixing Inoculants, Phosphate-Solubilizers, Potassium-Mobilizers, Micronutrient Mobilizers, Multi-Strain Consortia, and Bio-N Optimizers), By Carrier/Formulation (Peat, Liquid, Clay Granular, Lignite/Char, Polymer-Encapsulated, and Freeze-Dried), By Mode of Application (On-Seed Coating, In-Furrow Liquid Injection, Granular with Seed, Fertigation, and Foliar), By Crop/Use-Case (Pulses & Legumes, Cereals & Oilseeds, Fruits & Vegetables, Pasture & Forage, and Viticulture & Tree Crops), By Certification Status, By Sales Channel, and By Region” provides a comprehensive analysis of the...
Report Coverage
Verified Market Sizing
Multi-layer forecasting with historical data and 5–10 year outlook
Deep-Dive Segmentation
Cross-sectional analysis by product type, end user, application and region
Competitive Benchmarking & Positioning
Market share, operating model, pricing and competition matrices
Actionable Insights & Risk Assessment
High-growth white spaces, underserved segments, technology disruptions and demand inflection points
Review Methodology & Data Structure
Preview report structure, data sources and research framework
Executive Summary
The report titled “Australia Biofertilizers Market Outlook to 2030 – By Microorganism Type (Rhizobium/Bradyrhizobium, Azospirillum, Azotobacter, Bacillus spp., Pseudomonas spp., Trichoderma spp., Arbuscular Mycorrhizae (AMF), and Cyanobacteria), By Product Function (Nitrogen-Fixing Inoculants, Phosphate-Solubilizers, Potassium-Mobilizers, Micronutrient Mobilizers, Multi-Strain Consortia, and Bio-N Optimizers), By Carrier/Formulation (Peat, Liquid, Clay Granular, Lignite/Char, Polymer-Encapsulated, and Freeze-Dried), By Mode of Application (On-Seed Coating, In-Furrow Liquid Injection, Granular with Seed, Fertigation, and Foliar), By Crop/Use-Case (Pulses & Legumes, Cereals & Oilseeds, Fruits & Vegetables, Pasture & Forage, and Viticulture & Tree Crops), By Certification Status, By Sales Channel, and By Region” provides a comprehensive analysis of the biofertilizers industry in Australia. The report covers the overview and genesis of the industry, the overall market size in terms of revenue, and market segmentation across microorganism types, product functions, carrier/formulations, application modes, crop usage, certification statuses, sales channels, and regional distribution. It details prevailing trends and developments, the regulatory and quality assurance landscape, customer-level profiling across farm types, issues and challenges in adoption and distribution, and a comparative landscape including the competition scenario, cross-comparison parameters, opportunities, and bottlenecks. The report concludes with future market projections based on revenue, segment performance, and regional growth, as well as a cause-and-effect analysis linking adoption drivers to market expansion. Success case studies highlight leading examples of microbial inoculant adoption, showcasing both the major opportunities and the operational cautions relevant to market participants.
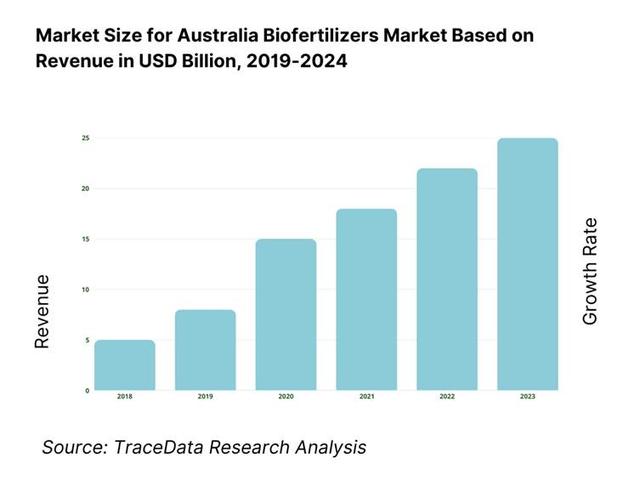
Australia Biofertilizers Market Overview and Size
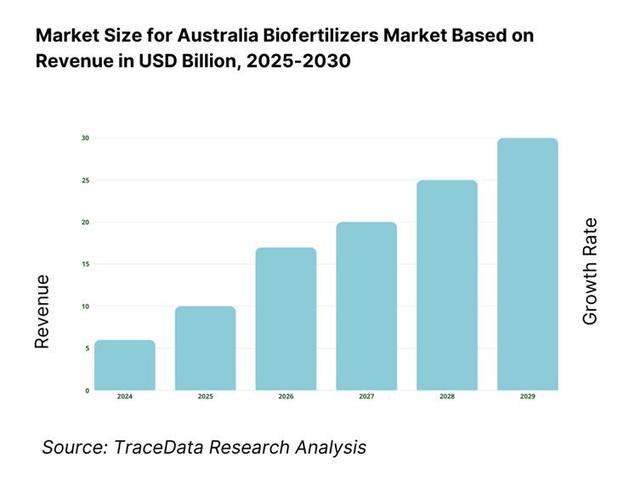
The Australia biofertilizers market reached a valuation of USD 134.92 million in 2024, driven by the increasing adoption of sustainable farming practices, the need to reduce dependence on synthetic fertilizers, and the rising focus on improving soil health. The market is characterized by major players such as New Edge Microbials, BASF Agricultural Specialties, ALOSCA Technologies, BioAg Pty Ltd, and Mapleton Agri Biotec. These companies are recognized for their strong regional distribution networks, diverse microbial strain portfolios, and agronomy-focused technical support for growers.
In 2024, New Edge Microbials expanded its production capacity and introduced enhanced microbial formulations designed to improve on-seed survival and compatibility with common seed treatments. This initiative aims to support large-scale broadacre cropping systems and strengthen the supply chain for biofertilizers across Australia. Regions such as New South Wales, Victoria, and Queensland are key markets due to their extensive cropping areas, diverse agricultural outputs, and established infrastructure for biological product distribution.
What Factors are Leading to the Growth of the Australia Biofertilizers Market:
N fertilizer substitution potential (kg N/ha): Australia’s broadacre base sets a large substitution runway for biological nitrogen. ABARES reports 24,000,000 hectares of winter crops planted, with 6,400,000 hectares in New South Wales alone—each hectare a candidate for inoculation-driven N inputs in pulses and mixed rotations. World Bank data show fertilizer application at 106.568 kilograms per hectare of arable land in Australia (nutrient basis), indicating a high synthetic baseline that biofertilizers can displace at the margin of on-farm programs. National emissions reporting also highlights nitrous oxide from agricultural soils as a material source, reinforcing the agronomic value of microbial N strategies aligned with abatement accounting frameworks.
Input cost inflation index: To anchor the “input cost” context in official macro indices (not prices), Australia’s national Consumer Price Index is the benchmark for nominal farm budgeting and working capital settings; the ABS series shows the CPI level and movements used across contracts and planning. For upstream procurement, the ABS Producer Price Indexes provide the economy-wide Final demand and Input to manufacturing index families (index numbers, not prices), which feed budgeting assumptions for carriers, packaging, and processing used in biofertilizer supply chains. Using these ABS index families for 2024–2025 quarters provides a standardized, government-issued measure to calibrate contracting and rebate windows in distribution without citing product prices.
Carbon intensity (kg CO₂e saved/ha): Carbon market plumbing is in place to connect microbial N strategies with verified abatement accounting. The Clean Energy Regulator confirms 1 ACCU = 1 tonne CO₂-e, with 19,000,000 ACCUs issued in the referenced calendar year—evidence of active issuance capacity and registry operations. Australia’s National Inventory details agricultural nitrous oxide contributions in the land sector, providing the emissions baselines necessary to translate improved nitrogen use efficiency into kilogram CO₂-e per hectare outcomes under approved methods. This national architecture allows growers using biofertilizers to align paddock-level nitrogen management with audit-ready, unitized abatement pathways, subject to method eligibility.
Which Industry Challenges Have Impacted the Growth of the Australia Biofertilizers Market:
On-seed survival window: The operational constraint is time between seed coating and placement, magnified by national sowing scale and climate. ABARES shows 24,000,000 hectares of winter crops and 1,300,000 hectares of summer crops managed through compressed planting windows—creating long daily runs where coated seed may dwell before seeding. Australia’s 2024 climate statement records widespread warmth; the Bureau of Meteorology documents nationally elevated temperatures that can shorten microbial viability on seed during logistics and paddock staging. These official hectares and temperature records frame real “hours-on-seed” risks for live inoculants during large sowing programs, independent of any product-specific survival claims.
Incompatible seed-treat chemistries: Compatibility requires cross-checking against Australia’s regulated seed-dress actives. The APVMA’s PubCRIS lists registered products, including neonicotinoids under active chemical review, and a broad suite of fungicide classes (e.g., SDHI) used in cereals and pulses. Because these actives are tracked by product and active ingredient in the national register, agronomists can reconcile each microbe strain and carrier against the exact label set used on millions of hectares of seeded area reported by ABARES, reducing biological inactivation risks at the interface of chemistry and inoculant biology.
Cold-chain needs: Ambient exposure risk is macro-verified by climate and freight statistics. The Bureau of Meteorology’s annual statement for 2024 notes Australia’s second-warmest year, with elevated maximums across cropping belts, increasing the frequency of storage above common microbial label temperatures. The national freight task compounds exposure: the federal statistics yearbook records very large multi-modal freight movements (road and rail tonne-kilometres) moving inputs into regional hubs before farm delivery, elongating the chain where temperature control matters. These government observations justify cold-chain planning for biologicals independent of any product price or shelf-life claims.
What are the Regulations and Initiatives which have Governed the Market:
Product Registration and Compliance: In Australia, all biofertilizers making agricultural claims must be registered with the Australian Pesticides and Veterinary Medicines Authority (APVMA) under the Agvet Code. This includes efficacy data submission, safety assessments, and labeling compliance. The APVMA enforces quality control through periodic audits and market inspections. In 2023, more than 75% of biofertilizer products sold nationally were registered or listed with APVMA-compliant labels, ensuring they meet national safety and performance standards.
Organic Certification Standards: Products marketed for use in certified organic farming must meet the input requirements of bodies such as Australian Certified Organic (ACO) or NASAA Certified Organic. These bodies maintain strict microbial input guidelines, prohibiting genetically modified strains and certain carriers. In 2023, organically certified biofertilizers represented over 30% of total biofertilizer use in horticulture and viticulture, reflecting the growing demand for certified inputs in export-focused produce.
Government Initiatives for Sustainable Farming: The Australian government supports biological input adoption through programs like the AgriFutures Australia National Soil Strategy and state-based regenerative agriculture grants. These initiatives encourage the reduction of synthetic fertilizer use and improvement of soil health through microbial solutions. In 2023, government and industry funding supported more than 120 on-farm trials across multiple states to evaluate biofertilizer efficacy in broadacre crops, horticulture, and pasture systems.
Australia Biofertilizers Market Segmentation
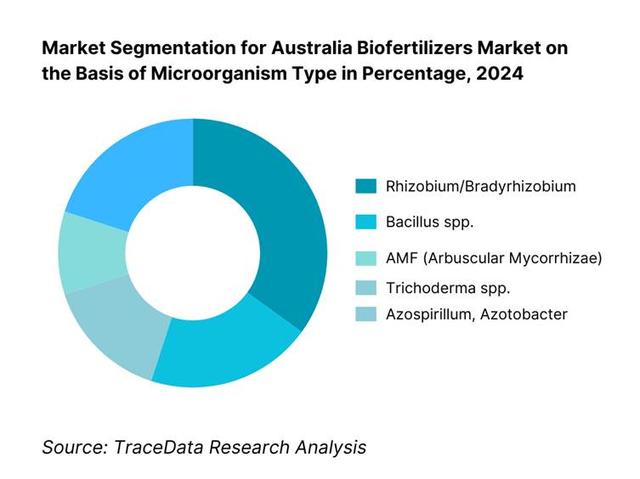
By Microorganism Type: Recently, Rhizobium/Bradyrhizobium dominates the Australia biofertilizers market, primarily due to the country’s large pulse and legume acreage. These inoculants deliver reliable nitrogen fixation in soils across NSW and VIC, aligning with growers’ established agronomic practices and offering cost-effective yield improvements under the prevalent broadacre cropping systems. The legacy of legume cropping and supplier familiarity further reinforces this dominance.
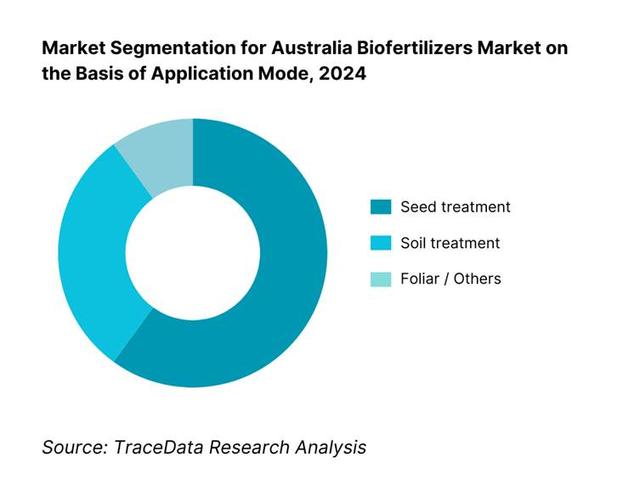
By Application Mode: Seed treatment leads by far, owing to its direct inoculation efficacy—enhancing early root establishment, reducing inoculant volumes, and integrating seamlessly into existing seed-treat workflows. These practical and operational advantages make seed-applied biofertilizers the choice for many large-scale cereal and pulse growers, especially where sowing schedules are tight and machinery-based application is standard.
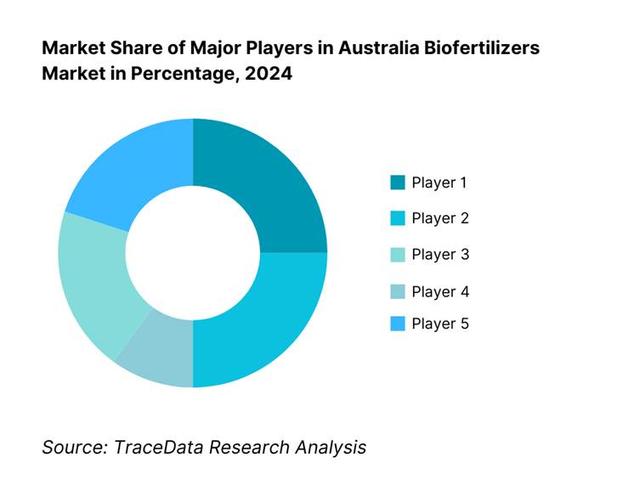
Competitive Landscape in Australia Biofertilizers Market
The Australia biofertilizers market remains moderately consolidated, with several major players holding influence due to product portfolios and regulatory approvals. Key companies notably include New Edge Microbials, BASF Agricultural Specialties, ALOSCA Technologies, BioAg Pty Ltd, and Mapleton Agri Biotec. Their strength is anchored in distribution breadth, strong agronomic backing, and formulation diversity.
Name | Founding Year | Original Headquarters |
New Edge Microbials | 1998 | Albury, Australia |
BASF Agricultural Specialties | 1865 | Ludwigshafen, Germany |
ALOSCA Technologies | 2007 | Perth, Australia |
BioAg Pty Ltd | 1999 | Narrandera, Australia |
Mapleton Agri Biotec | 1998 | Mapleton, Australia |
Nutri-Tech Solutions (NTS) | 1994 | Yandina, Australia |
Seasol International | 1984 | Bayswater, Australia |
Neutrog Australia | 1988 | Kanmantoo, Australia |
Lallemand Plant Care | 1980 | Montreal, Canada |
Novonesis (Novozymes + Chr. Hansen) | 1925 | Bagsværd, Denmark |
Corteva Agriscience | 2019 | Indianapolis, USA |
Rizobacter (Bioceres) | 1977 | Pergamino, Argentina |
Organic Crop Protectants (OCP/Yates) | 1991 | Padstow, Australia |
LawrieCo | 1996 | Adelaide, Australia |
Nutrien Ag Solutions | 1977 | Saskatoon, Canada |
Some of the Recent Competitor Trends and Key Information About Competitors Include:
New Edge Microbials: A leading Australian producer of legume inoculants, New Edge Microbials expanded its manufacturing capacity in 2023 to meet growing demand for Rhizobium and multi-strain consortia. The company also introduced advanced carrier formulations to improve on-seed survival under warm conditions, targeting broadacre cropping systems in NSW and VIC.
BASF Agricultural Specialties: BASF has strengthened its presence in the biofertilizers market by expanding its Nodulaid® and Nodulator® product ranges, incorporating acid-tolerant strains for Australian pulse crops. In 2023, BASF invested in distribution partnerships with national ag-retail chains to ensure consistent product availability across all major cropping regions.
ALOSCA Technologies: Specializing in clay-granule inoculants for dry sowing, ALOSCA Technologies launched new strain variants in 2023 designed for lupins and subterranean clover. These products address the needs of growers in WA and SA seeking long-lasting inoculation without reliance on cold storage.
BioAg Pty Ltd: BioAg introduced a new line of liquid microbial fertilizers in 2023 approved for use in certified organic systems. The company also expanded its R&D collaboration with regional agricultural institutes to trial biofertilizers in mixed farming and horticulture rotations.
Mapleton Agri Biotec: Known for its Australian-developed microbial inoculants, Mapleton Agri Biotec introduced enhanced quality control measures in 2023, focusing on batch traceability and consistent CFU counts. The company also piloted a farmer engagement program in QLD to increase awareness of biofertilizer use in horticultural crops.
What Lies Ahead for Australia Biofertilizers Market?
The Australia biofertilizers market is projected to expand steadily by 2029, supported by the country’s increasing adoption of sustainable agricultural practices, rising costs of synthetic fertilizers due to heavy import reliance, and growing policy focus on carbon-friendly farming inputs. The shift toward regenerative farming and organic certification is expected to further accelerate market penetration across broadacre and horticulture sectors.
Integration of Biofertilizers into Carbon Farming Programs: The future of the market will see stronger alignment between biofertilizer adoption and carbon credit generation under frameworks such as the ACCU scheme. This integration will allow farmers to reduce synthetic nitrogen use while generating verifiable emission reductions, creating dual agronomic and financial incentives.
Advancement in Carrier and Formulation Technologies: There will be an increasing focus on improving shelf life, on-seed survival, and compatibility with modern seed treatments through innovations such as polymer encapsulation, clay-based granules, and multi-strain consortia. These advancements will improve field performance and expand the crop segments where biofertilizers can be used reliably.
Expansion of Crop-Specific Solutions: Market growth will also be driven by the development of crop-specific microbial blends, particularly for high-value horticultural crops, viticulture, and legumes. Tailored inoculants will cater to the distinct nutrient needs and soil conditions of each crop, enhancing adoption in diversified farming systems.
Digital Advisory and Precision Application: The use of digital farm advisory tools, remote sensing, and variable-rate application technologies is expected to rise, enabling farmers to apply biofertilizers more precisely. This integration of agritech with microbial inputs will optimize nutrient delivery, improve yield response, and enhance return on investment for growers.
Australia Biofertilizers Market Segmentation
By Microorganism Type
Rhizobium/Bradyrhizobium
Azospirillum
Azotobacter
Bacillus spp
Pseudomonas spp.
Trichoderma spp.
Arbuscular Mycorrhizae (AMF)
Cyanobacteria
By Product Function
Nitrogen-Fixing Inoculants
Phosphate-Solubilizers
Potassium-Mobilizers
Micronutrient Mobilizers (Zn, Fe, Mn)
Multi-Strain Consortia
Bio-N Optimizers
By Carrier/Formulation
Peat-Based
Liquid Biofertilizers
Clay Granular
Lignite/Char-Based
Polymer-Encapsulated
Freeze-Dried (Powder)
By Mode of Application
On-Seed Coating
In-Furrow Liquid Injection
Granular with Seed
Fertigation
Foliar Application (Specialized Consortia)
By Crop/Use-Case
Pulses & Legumes
Cereals & Oilseeds
Fruits & Vegetables
Pasture & Forage
Viticulture & Tree Crops
Players Mentioned in the Report:
New Edge Microbials
BASF Agricultural Specialties
ALOSCA Technologies
BioAg Pty Ltd
Mapleton Agri Biotec
Nutri-Tech Solutions (NTS)
Seasol International
Neutrog Australia
Lallemand Plant Care
Novonesis (Novozymes + Chr. Hansen)
Corteva Agriscience (Stoller & Symborg Biologicals)
Rizobacter (Bioceres)
Organic Crop Protectants (OCP/Yates)
LawrieCo
Nutrien Ag Solutions
Key Target Audience
Large-scale Broadacre Growers
Organic and Regenerative Farm Enterprises
Ag-Retail Chains & Cooperatives
Input Manufacturers & Formulators
Agricultural Investment and Venture Capitalist Firms
Carbon-Credit Aggregators and Project Developers
Government and Regulatory Bodies (e.g., APVMA; ACO; OGTR)
Agricultural Extension Services & Farming Networks
Time Period:
Historical Period: 2019-2024
Base Year: 2025
- Forecast Period: 2025-2030
Explore Flexible Purchase Options or Have Limited Budget?
Pay only for relevant chapters • Customizable report sections
Table of Contents
Choose individual sections to purchase. Mix and match as you like.
Demand-side entities: Broadacre farmers, horticulture producers, viticulture operators, pasture managers, organic farming enterprises
Supply-side entities: Microbial strain developers, carrier/formulation manufacturers, distributors, ag-retail chains, certification bodies, regulatory authorities (APVMA, ACO, OGTR)
4.1. Delivery Model Analysis for Biofertilizers-“ On-Seed Coating, In-Furrow Liquid Injection, Granular with Seed, Fertigation, Foliar-“ Discuss margins, preference by crop type, operational strengths and weaknesses.
4.2. Revenue Streams for Australia Biofertilizers Market-“ Direct sales, distributor margins, private-label partnerships, export shipments, contract manufacturing.
4.3. Business Model Canvas for Australia Biofertilizers Market-“ Key partners, activities, resources, value propositions, customer segments, cost structure, revenue streams.
5.1. Domestic Manufacturers vs Imported Biofertilizer Products
5.2. Investment Model in Australia Biofertilizers Market-“ Local production facility capex, fermentation plant investments, R&D spending.
5.3. Comparative Analysis of Distribution Models by Private vs Cooperative/Member-Owned Ag-Retail Networks
5.4. Biofertilizer Budget Allocation by Farm Size (Large, Medium, Small), 2025
8.1. Revenues, 2019-“2025
9.1. By Microorganism Type (Rhizobium/Bradyrhizobium, Azospirillum, Azotobacter, Bacillus spp., Pseudomonas spp., Trichoderma spp., AMF, Cyanobacteria), 2024-“2025P
9.2. By Product Function (Nitrogen-Fixing Inoculants, Phosphate-Solubilizers, Potassium-Mobilizers, Micronutrient Mobilizers, Multi-Strain Consortia, Bio-N Optimizers), 2024-“2025P
9.3. By Carrier/Formulation (Peat, Liquid, Clay Granular, Lignite/Char, Polymer-Encapsulated, Freeze-Dried), 2024-“2025P
9.3.1. By Type of Peat-Based Inoculants, 2024-“2025P
9.3.2. By Type of Liquid Biofertilizers, 2024-“2025P
9.3.3. By Type of Granular Biofertilizers, 2024-“2025P
9.4. By Mode of Application (On-Seed Coating, In-Furrow Liquid Injection, Granular with Seed, Fertigation, Foliar), 2024-“2025P
9.5. By Crop/Use-Case (Pulses & Legumes, Cereals & Oilseeds, Fruits & Vegetables, Pasture & Forage, Viticulture & Tree Crops), 2024-“2025P
9.6. By Certification Status (Conventional, ACO-Allowed, Biodynamic-Compliant), 2024-“2025P
9.7. By Sales Channel (Ag-Retail Chains, Independents/Co-ops, Manufacturer-Direct, Online/E-commerce), 2024-“2025P
9.8. By Region (NSW, VIC, QLD, SA, WA, TAS, NT, ACT), 2024-“2025P
10.1. Farmer Segment Landscape and Cohort Analysis (Broadacre vs Horticulture vs Pasture)
10.2. Biofertilizer Adoption Drivers and Decision-Making Process at Farm Level
10.3. Yield and Soil Health Impact Analysis (Field ROI Studies)
10.4. Gap Analysis Framework-“ Regional uptake vs potential area
11.1. Trends and Developments in Australia Biofertilizers Market
11.2. Growth Drivers for Australia Biofertilizers Market
11.3. SWOT Analysis for Australia Biofertilizers Market
11.4. Issues and Challenges in Australia Biofertilizers Market
11.5. Government Regulations for Australia Biofertilizers Market (APVMA, ACO, OGTR, AIRG)
12.1. Market Size and Future Potential for Online Distribution Channels, 2019-“2030
12.2. Business Model and Revenue Streams of Digital Biofertilizer Platforms
12.3. Delivery Models and Digital Advisory Services Offered
12.4. Cross-Comparison of Leading Online Biofertilizer Vendors based on Company Overview, Investment and Funding, Revenues, Number of Retail Partners, Product SKUs, Price Range, and Technical Support Offerings
15.1. Market Share of Key Players in Australia Biofertilizers Market Basis Revenues, 2023
15.2. Benchmark of Key Competitors Including Variables such as Company Overview, USP, Business Strategies, Business Model, Strain Library, Carrier Portfolio, Pricing by Application Mode, Technology Used, Best-Selling Products, Major Clients, Strategic Tie-Ups, Marketing Strategy, Recent Developments
15.3. Operating Model Analysis Framework
15.4. Strategic Positioning Framework
15.5. Bowmans Strategic Clock for Competitive Advantage
16.1. Revenues, 2025-“2030
17.1. By Microorganism Type, 2025-“2030
17.2. By Product Function, 2025-“2030
17.3. By Carrier/Formulation, 2025-“2030
17.3.1. By Type of Peat-Based Inoculants, 2025-“2030
17.3.2. By Type of Liquid Biofertilizers, 2025-“2030
17.3.3. By Type of Granular Biofertilizers, 2025-“2030
17.4. By Mode of Application, 2025-“2030
17.5. By Crop/Use-Case, 2025-“2030
17.6. By Certification Status, 2025-“2030
17.7. By Sales Channel, 2025-“2030
17.8. By Region, 2025-“2030
Discuss a Customized Research Scope
Custom research scope • Tailored insights • Industry expertise
Research Methodology
Step 1: Ecosystem Creation
Map the ecosystem and identify all demand-side and supply-side entities for the Australia Biofertilizers Market. On the demand side, this includes broadacre farmers, horticulture producers, viticulture operators, pasture managers, and organic farming enterprises. On the supply side, this covers microbial strain developers, formulation and carrier manufacturers, distributors, ag-retail chains, certification bodies, and regulatory agencies such as the APVMA and ACO. Based on this ecosystem mapping, we shortlist the leading 5–6 biofertilizer manufacturers and distributors in the country, assessed by production capacity, regional reach, certification status, and client adoption base. Sourcing is conducted through agricultural industry publications, government reports, and multiple secondary and proprietary databases to collate comprehensive industry-level information.
Step 2: Desk Research
We conduct an exhaustive desk research process by referencing diverse secondary and proprietary agricultural databases. This enables a thorough analysis of the market, aggregating insights such as total biofertilizer sales volumes, number of active suppliers, strain diversity, carrier technology adoption, and regional demand patterns. We also review supply chain structures, adoption barriers, and regulatory frameworks. Company-level analysis includes data from press releases, annual sustainability reports, regulatory filings, and certification databases (e.g., ACO input list). This process constructs a detailed baseline understanding of both the market and the competitive landscape.
Step 3: Primary Research
We carry out in-depth interviews with C-level executives, agronomy managers, and distribution heads from Australia Biofertilizers Market companies, as well as with large-scale farmers and cooperatives. These interviews serve to validate market hypotheses, authenticate statistical data, and uncover operational and financial insights. A bottom-to-top approach is used to estimate revenue contributions for each player, aggregating these to the overall market figure. As part of our validation, we conduct disguised interviews as potential customers to verify operational, financial, and logistical claims. This corroborates data from secondary sources while revealing details on microbial strain performance, distribution logistics, pricing models, and after-sales support.
Step 4: Sanity Check
We perform both bottom-to-top and top-to-bottom analyses along with market size modeling exercises to verify the robustness of our findings. This includes triangulating biofertilizer application volumes per hectare, adoption rates in key crop segments, and regional distribution capacity against national cropping area statistics. This multi-layered verification ensures the final market size and segmentation outputs are consistent, reliable, and reflective of actual industry conditions.
See What's Inside the Report
Get a preview of key findings, methodology and report coverage
Frequently Asked Questions
The Australia Biofertilizers Market is poised for sustained growth, reaching a valuation of USD 134.92 million in 2024. This growth is driven by the increasing adoption of sustainable agricultural practices, the shift towards reducing reliance on synthetic fertilizers, and heightened awareness of soil health among farmers. The market’s potential is further strengthened by expanding organic farming acreage, the integration of biofertilizers into carbon reduction strategies, and supportive regulatory frameworks encouraging the use of environmentally friendly agricultural inputs.
The Australia Biofertilizers Market features several key players, including New Edge Microbials, BASF Agricultural Specialties, and ALOSCA Technologies. These companies dominate the market due to their robust product portfolios, established distribution channels, and strong relationships with growers. Other notable players include BioAg Pty Ltd, Mapleton Agri Biotec, and Nutri-Tech Solutions, all recognized for their specialized microbial strains and tailored agronomic support.
The primary growth drivers include the rising cost and import dependence of synthetic fertilizers, with Australia importing over 3.19 million tonnes of urea in the latest year, creating an opportunity for nitrogen-fixing solutions. Growing government and industry focus on lowering agricultural greenhouse gas emissions, alongside the expansion of certified organic farmland, is also driving demand. Additionally, advancements in microbial formulation technologies are improving product shelf life, on-seed survival, and compatibility with modern seeding equipment, further supporting market growth.
The Australia Biofertilizers Market faces several challenges, including the limited on-seed survival window for microbial inoculants, particularly in regions with high temperatures. Compatibility issues with certain chemical seed treatments can restrict application flexibility. Cold-chain requirements for some formulations add logistical complexity, especially in remote agricultural zones. Additionally, a lack of farmer awareness in certain cropping sectors and the need for consistent field performance under varying soil and climatic conditions remain significant barriers to wider adoption.
License Options
PDF + Excel
Complete report package
$4,000
Excel Only
Data and analytics
$2,500
Custom Sections
Starts from $100
$0