Australia Car Rental & Leasing Market Outlook to 2030
By Service Type (Short-Term Airport Rentals, City/Off-Airport Rentals, Corporate Operating Leasing, Novated Leasing, Subscriptions), By Vehicle Class (Economy & Compact, Mid-Size, SUVs & Crossovers, Vans & Utes, Premium & Luxury), By Powertrain
- Product Code: TDR0219
- Region: Asia
- Published on: August 2025
- Total Pages: 80
Report Summary
The report titled “Australia Car Rental & Leasing Market Outlook to 2030 – By Service Type (Short-Term Airport Rentals, City/Off-Airport Rentals, Corporate Operating Leasing, Novated Leasing, Subscriptions), By Vehicle Class (Economy & Compact, Mid-Size, SUVs & Crossovers, Vans & Utes, Premium & Luxury), By Powertrain (Petrol, Diesel, Hybrid, Battery Electric, Plug-in Hybrid), By Tenure (Daily, Weekly, Monthly/Mid-Term, Long-Term Operating Lease, Finance/Balloon & Novated), By End User (Leisure Individuals, Corporate SME, Corporate Enterprise, Government & Public Sector, Insurance Replacement, Rideshare Programs), and By Region (NSW, VIC, QLD, WA, SA, TAS, ACT, NT).” The report provides a comprehensive analysis of the Australia Car Rental & Leasing Market, tracing the overview and genesis of the industry—including the evolution from traditional counter-based rentals to app-first journeys, the growth of novated leasing, and the emergence of subscription and mid-term models. It quantifies the overall market size in terms of revenue, and unpacks detailed market segmentation across service type, vehicle class, powertrain, tenure, end user, and region. The report concludes with future market projections to 2029 by revenue and by each segmentation lens (service type, vehicle class, powertrain, tenure, end user, region), a cause-and-effect analysis linking macro drivers to segment outcomes, and success case studies highlighting winning playbooks in airport tenders, EV fleet pilots, insurance-replacement partnerships, and subscription launches—distilling major opportunities and cautions for investors, operators, OEM partners, airports, and insurers.
Australia Car Rental and Leasing Market Overview and Size
The Australia car rental and leasing market is valued at AUD 3.4 billion (total rental + leasing) for the most recent full-year estimate. This figure is grounded in industry‑level data rather than extrapolation. The market expansion has been propelled by surging inbound tourism and recovering domestic travel following easing of mobility restrictions, alongside rising popularity of novated leases and flexible rental formats. Together, these have driven both short‑term hires and medium‑/long‑term lease options, underpinning substantial revenue resilience across segments.
Major urban centres such as Sydney, Melbourne, and Brisbane dominate market activity due to dense corporate and business travel demand, high tourist footfall, and well-developed airport infrastructures that favour large-scale rental fleets and leasing operations. In addition, vast regional and rural zones, particularly over in Queensland and Western Australia, bolster vehicle demand for remote travel, holidays, and mining‑sector mobility. These hubs benefit from both concentrated economic activity and essential connectivity, creating unmatched market traction.
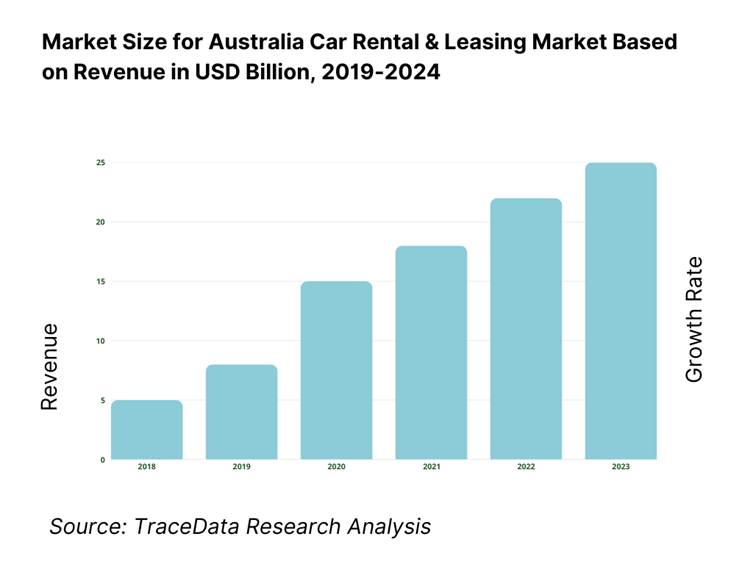
What Factors are Leading to the Growth of the Australia Car Rental and Leasing Market:
Tourism arrivals: Australia’s inbound and domestic air flows underpin short-cycle rental demand. Short-term visitor arrivals reached 603,770 in one recent month, within total overseas arrivals of 2,122,070 movements, while permanent and long-term arrivals added 70,320 movements, signalling sustained pressure on airport rental fleets. Across Brisbane, Melbourne, Perth and Sydney airports, passenger throughput totalled 114,600,000 movements in a recent twelve-month period, concentrated at the four gateways that host the bulk of on-airport rental facilities. These volumes align with state visitor recoveries tracked by Tourism Research Australia. Sources: ABS OAD monthly overview
Business travel intensity: Corporate mobility needs are anchored by the scale of Australia’s enterprise base and workforce. Actively trading businesses numbered 2,589,873, dominated by small and medium employers that rely on short-term vehicle access for sales, service and project travel. National employment stood near 14,355,600 people in one recent month, with monthly hours worked around 1,951,000,000, sustaining weekday airport rotations and CBD rental pick-ups. With four monitored airports handling 114,600,000 passengers across a recent financial year, weekday peaks reflect corporate itineraries rather than leisure.
Fleet renewal cycles: Replacement rhythms are shaped by Australia’s large, ageing parc and rising low-emissions penetration. Passenger vehicles in service numbered 15,707,888, within an estimated 21,752,500 total light-duty fleet, with an average vehicle age of 11.40 years. New energy technologies are scaling: battery-electric vehicles on the register reached 167,850, hybrids 481,400, and plug-in hybrids 40,250. These structural numbers create frequent refresh points for rental and leasing operators that de-fleet earlier than private owners to manage uptime, warranty coverage and utilisation.
Which Industry Challenges Have Impacted the Growth of the Australia Car Rental and Leasing Market:
Vehicle supply constraints: Rental fleet growth depends on import availability and logistics throughput. Australia imported $35,758,000,000 worth of passenger motor vehicles in 2024, confirming high external dependence on supply pipelines and currency conditions. The circulating parc remains older, with the average vehicle age at 11.40 years, and passenger vehicles at 15,707,888, intensifying replacement needs when delivery slots open. Exchange rates add volatility to ordering cycles; the RBA publishes daily and monthly AUD rates, with the official series used by agencies for contract and tax conversion.
Residual value risk: De-fleeting outcomes are sensitive to macro finance and technology transitions. The RBA Board held the cash rate target at 4.35 per cent at several decisions through 2024, before moving in 2025, affecting discount rates applied to fleet residuals and lease pricing. EV stock acceleration—167,850 BEVs and 481,400 hybrids on the register—can re-set used-vehicle demand mixes and holding periods for combustion assets. Currency movements also impact landed replacement costs and remarketing dynamics; the ATO publishes official monthly averages for foreign exchange for the 2024 financial year that leasing finance teams use for reconciliations.
High insurance excess: Insurance settings for rental damage waivers reflect the broader underwriting environment and catastrophe-linked claims. APRA’s quarterly industry publications detail insurer results under the AASB 17 framework for 2024, evidencing elevated insurance service expenses that flow into risk appetite. The ACCC’s insurance monitoring cites Cyclone Jasper claims of about $83,000,000 and Ex-Tropical Cyclone Kirrily around $94,000,000, which lift short-tail loss costs and push stricter excess structures in high-risk geographies. The general insurance market is regulated by APRA, with an official register of authorised insurers maintained for compliance.
What are the Regulations and Initiatives which have Governed the Market:
ACCC Australian Consumer Law focus areas: Car rental contracts and practices are squarely within ACL oversight. The ACCC’s industry guide specifies obligations on contract terms, deposits and refunds, and clarifies post-publication ACL changes, including the increase in the monetary threshold for the definition of a “consumer” to $100,000 for supplies from 1 July 2021. These thresholds and guidance points underpin requirements around unfair contract terms, disclosure of vehicle condition reporting, and handling damage claims—critical for franchisees and licensees operating at airports and downtown sites.
ATO FBT on leased cars & novated structures: For employer-provided cars—including novated leases—FBT applies to private use. The ATO’s framework confirms a statutory formula rate of 20 (per cent) used to calculate taxable value for car fringe benefits, and formal guidance explains how FBT applies to leased cars and bona fide leases. These mechanics govern cost allocation in corporate long-term rentals and novated programs attached to salary packaging, with documentation and logbook obligations defining operating-cost method usage when elected.
EV FBT exemption rules: The Electric Car Discount exempts eligible EVs from FBT when first “held and used” on or after 1 July 2022, subject to the LCT fuel-efficient threshold test; associated car expenses including registration, insurance, repairs, and electricity are also exempt when linked to the eligible car. For plug-in hybrids, the exemption ceases from 1 April 2025, except where a binding commitment and prior use existed before that date. These dated, numeric tests are central to novated EV programs run by fleet lessors for employer clients.
Australia Car Rental and Leasing Market Segmentation
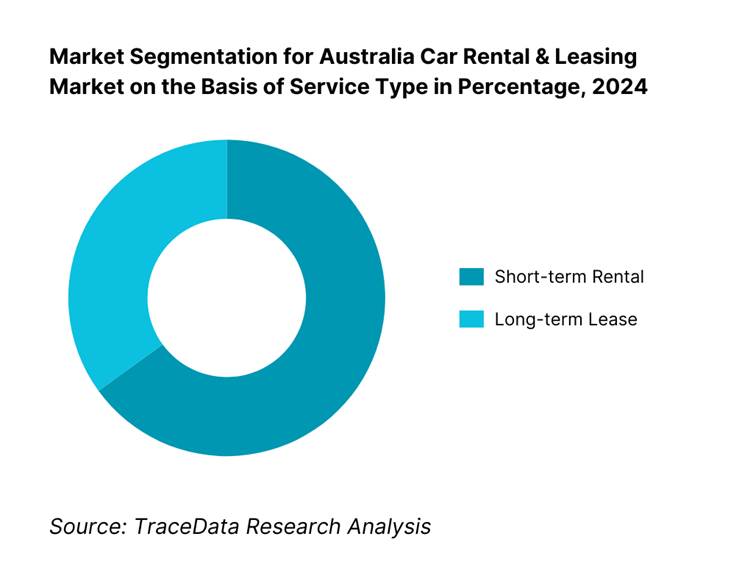
By Service Type: The Australia car rental & leasing market is segmented into short-term rentals and long-term leasing, including novated leases. Short-term rental holds a dominant share at around 65 %, owing to strong demand from tourists and business visitors who require flexibility and convenience for short durations. The prevalence of airport-based rental outlets, digital booking platforms, and competitive pricing further reinforce the preference for short-term rentals. Long-term leasing, although smaller at around 35 %, is gaining traction with novated lease schemes common among corporate and government employees seeking tax-efficient vehicle access. These arrangements appeal to individuals prioritizing cost predictability and access to newer models through structured lease contracts.
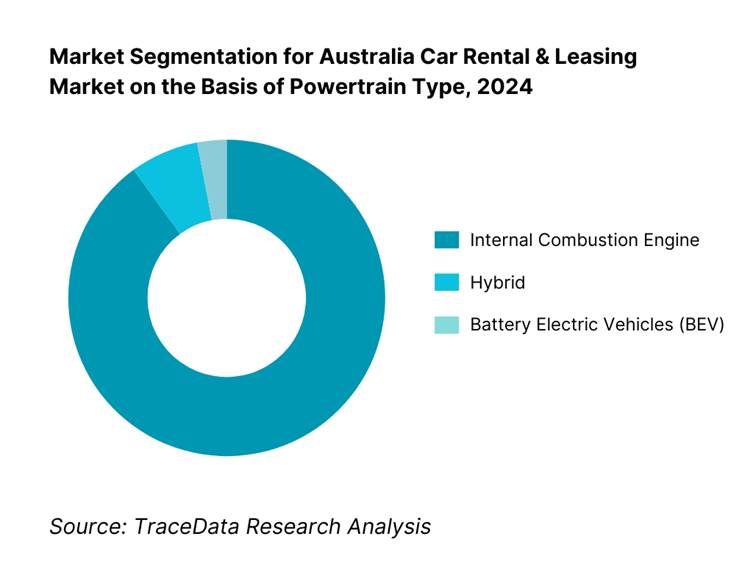
By Powertrain Type: The Australia car rental & leasing market is segmented by powertrain into ICE vehicles, hybrids, and battery-electric vehicles (BEVs). ICEs dominate with approximately 90 % share, given the existing fleet infrastructure, wide availability of petrol/diesel vehicles, and limited charging infrastructure in many areas. Hybrids, accounting for about 7 %, are gradually increasing adoption as operators add fuel-efficient models to reduce operating costs and meet sustainability goals. BEVs hold a smaller share around 3 %, constrained by charging network limitations and higher purchase costs. However, government incentives and growing eco-tourism are nudging fleets to pilot EVs, particularly in major cities and tourist corridors, signaling future growth potential for sustainable powertrains.
Competitive Landscape in Australia Car Rental and Leasing Market
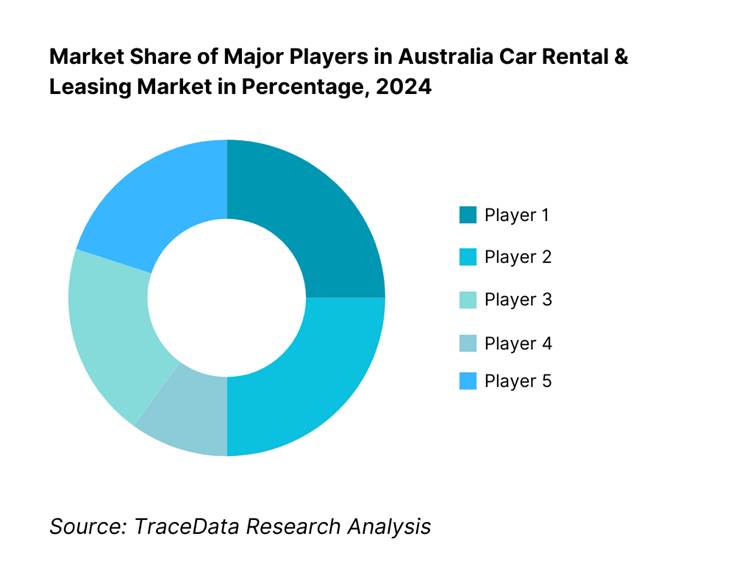
The Australia car rental & leasing market is concentrated among a few major players with significant operational scale and network reach.The Australia car rental and leasing landscape is shaped by key incumbents such as Avis, Hertz, Enterprise (incl. Redspot), Budget, and Europcar, which collectively anchor fleet capacity, customer loyalty, and airport presence. Consolidation among national and international operators has strengthened their market positioning, enabling scale efficiencies, broad booking platform integration, and premium service lines. This concentration reinforces competitive barriers and sets a high standard for flair, fleet quality, and regional coverage.
Name | Founding Year | Original Headquarters |
Hertz (Australia operations) | 1918 | Chicago, USA |
Avis (Australia operations) | 1946 | Detroit, USA |
Budget (Australia operations) | 1958 | Los Angeles, USA |
Europcar (Australia operations) | 1949 | Paris, France |
Enterprise Rent-A-Car | 1957 | St. Louis, USA |
SIXT Australia (NRMA partnership) | 1912 | Munich, Germany |
East Coast Car Rentals | 1979 | Gold Coast, Australia |
Apex Car Rentals (Australia operations) | 1992 | Christchurch, New Zealand |
Bayswater Car Rental (“No Birds”) | 1958 | Perth, Australia |
JUCY (Australia operations) | 2001 | Auckland, New Zealand |
SG Fleet (incl. LeasePlan ANZ) | 1986 | Sydney, Australia |
McMillan Shakespeare Group (Maxxia) | 1988 | Melbourne, Australia |
FleetPartners Group | 1987 | North Sydney, Australia |
ORIX Australia (ORIX Corporation) | 1964 | Osaka, Japan |
Smartgroup Corporation (Smartleasing) | 1999 | Sydney, Australia |
Some of the Recent Competitor Trends and Key Information About Competitors Include:
Hertz Australia: Expanded app-first, contactless pickup and keyless trials across high-throughput airport stations; deepening OEM supply programs to stabilise delivery slots and refresh SUV/ute mix for leisure and insurance-replacement demand.
Avis & Budget (Avis Budget Group): Strengthening dynamic pricing and telematics coverage to lift utilisation; continuing insurance-replacement partnerships with panel repair networks; selective EV and hybrid additions into metro fleets aligned to airport–CBD corridors.
Europcar Australia: Pushing premium and SUV categories at gateway airports; scaling corporate mid-term offers for project and relocation use cases; enhancing loyalty integrations and OTA connectivity to raise international capture.
Enterprise Rent-A-Car (incl. Redspot): Leveraging global corporate accounts into Australia; widening presence at off-airport business parks for weekday demand; building rideshare-ready weekly packages in major cities.
SIXT Australia (NRMA): Accelerating EV adoption supported by access to NRMA charging infrastructure; promoting road-trip and leisure bundles; broadening SME agreements using salary-packaged and subscription-style offers.
What Lies Ahead for Australia Car Rental and Leasing Market?
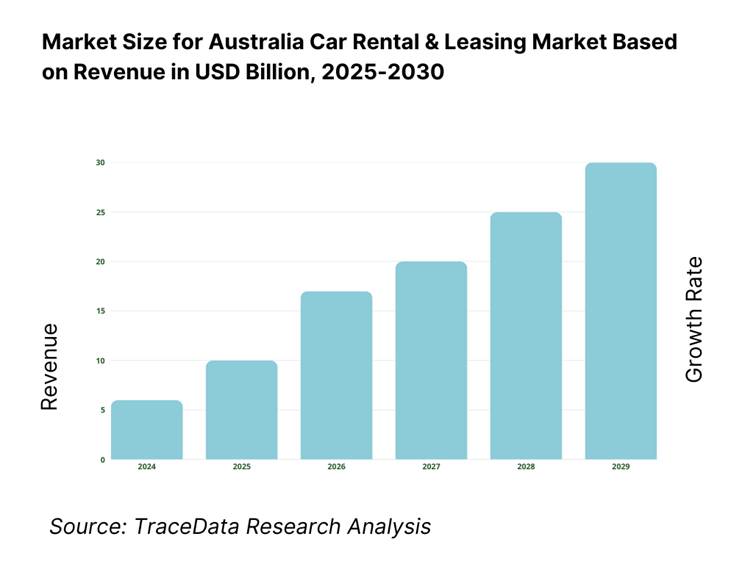
Steady Expansion Through 2030: Australia’s car rental & leasing market is set to expand through the medium term, supported by resilient domestic and international air travel, a deep base of actively trading businesses, and policy tailwinds for electrification and salary-packaged mobility (novated leasing). Operators that blend airport strength with city/off-airport coverage, tighten utilization via telematics, and deepen corporate programs will be best positioned. Expect more mid-term products (1–12 months), tighter ancillary packaging, and closer OEM–operator collaboration for fleet supply and residual risk sharing.
Rise of Hybrid Access Models: The operating model will continue shifting toward “hybrid access”—app-first booking, digital ID verification, and keyless/QR pickup—backed by staffed service at high-complexity stations (major airports, CBD hubs). Kiosks and remote unlocks shorten dwell time, improve turnarounds, and reduce queue friction at peak flights. For corporate and government accounts, pre-authorized profiles and pooled vehicles will support after-hours access, while automated damage capture and telematics-based return checks compress disputes and speed billing.
Focus on Outcome-Based Mobility: Large enterprise, government, and insurance partners are demanding measurable outcomes from mobility spend. Procurement will weight KPIs such as on-time vehicle availability, turnaround time, EV uptime, damage ratio, and customer recovery time after disruptions. Contracts will increasingly embed service credits/bonuses, API-level data sharing, and auditable compliance (consumer law disclosures, privacy, add-on products). This pushes operators to standardize processes, elevate fleet health monitoring, and align pricing with verified performance.
Expansion of Sector-Specific Programs: Specialized solutions will scale across distinct demand pools: (i) Corporate & government—novated and operating leases with bundled maintenance and charging; (ii) Insurance replacement—short-cycle rentals integrated with repairer networks and claim systems; (iii) Rideshare driver packages—weekly EV/HEV bundles with mileage and downtime protections; (iv) Projects & regional—4×4/ute fleets for resources, construction, and events. Expect tailored SLAs, fit-for-purpose vehicles, and location-specific logistics (regional airports, fly-in/fly-out corridors).
Leveraging AI & Analytics: AI-driven pricing, demand sensing, and fleet rebalancing will become standard. Models ingest aviation schedules, event calendars, weather, and road conditions to set rates, forecast length-of-rental, and position vehicles ahead of peaks. Telematics and computer vision enhance preventative maintenance, EV energy planning, and damage adjudication. For corporate mobility, analytics will quantify utilization, idle time, and emissions, enabling evidence-based renewal decisions and outcome-linked contracts that improve total cost of mobility and user experience.
Australia Car Rental and Leasing Market Segmentation
By Service Type
Airport rentals (on-terminal & shuttle)
City/off-airport rentals
Corporate operating leasing
Novated leasing (salary packaging)
Subscriptions / mid-term (1–12 months)
Insurance replacement rentals
Rideshare driver rentals (weekly packages)
Peer-to-peer car sharing
By Vehicle Class
Economy & compact
Mid-size & large sedans
SUVs & crossovers (small/medium/large)
Vans & utes (cargo/passenger)
Premium & luxury
Specialty / 4×4 / off-road
By Powertrain
Petrol (ICE)
Diesel (ICE)
Hybrid (HEV)
Plug-in hybrid (PHEV)
Battery electric (BEV)
By Tenure / Length of Use
Short-term daily (0–3 days)
Short-term weekly (4–13 days)
Monthly / mid-term (14–180 days)
Long-term operating lease (12–48 months)
Finance lease / balloon structures
Novated lease (employer-linked)
By End User
Leisure individual
Corporate SME
Corporate enterprise
Government & public sector
Insurance & accident management users
Rideshare drivers / gig mobility
Players Mentioned in the Report:
Hertz Australia
Avis Australia
Budget Australia
Europcar Australia
Enterprise Rent-A-Car Australia (inc. Redspot)
Sixt Australia
East Coast Car Rentals
Apex Car Rentals
Bargain Car Rentals
Bayswater Car Rental (No Birds)
JUCY Group (Rentals & Campervans)
SG Fleet (incl. LeasePlan ANZ)
McMillan Shakespeare Group (Maxxia)
Eclipx Group (FleetPartners)
ORIX Australia (Fleet & Leasing)
Key Target Audience
Senior Executives at rental and leasing operators
Corporate Travel Managers (large enterprises)
Vehicle OEMs and Dealer Group Strategy Heads
Airport Retail & Concession Planners
Insurance & Mobility Portfolio Directors
Investment and Venture Capitalist Firms
Government and Regulatory Bodies (e.g., ACCC, ATO, state transport departments)
Tourism and State Tourism Board Strategic Planners
Time Period:
Historical Period: 2019-2024
Base Year: 2025
- Forecast Period: 2025-2030
Report Coverage
Choose individual sections to purchase. Mix and match as you like.
1.1 Key Insights & Headlines
1.2 Demand Snapshot (Airport & City Flows)
1.3 Operator Landscape & White Spaces
1.4 Near-Term Outlook & Risks
2.1 Approach & Assumptions [Data sources; Normalization rules; Definitions]
2.2 Sizing Techniques [Top-down anchors; Bottom-up build; Triangulation]
2.3 Validation & Quality Control [Expert interviews; Scenario stress tests]
2.4 Limitations [Disclosure gaps; Seasonality; One-off shocks]
[Airport authorities; Rental operators; Leasing/novated providers; OEMs/dealers; Insurers & AMCs; OTAs/TMCs; Charging networks & energy retailers; Telematics/ID-verification vendors; Government & regulators (ACCC, ATO, State Transport)]
4.1 Delivery Model Analysis for Car Rental & Leasing-Online/App-First, Blended (Kiosk+Counter), In-Person Counter, Self-Service
4.2 Revenue Streams for Australia Car Rental & Leasing Market
4.3 Business Model Canvas for Australia Car Rental & Leasing Market
5.1 Franchise/Licensee vs Company-Operated Locations [Contract terms; Capex/working capital; Control & standards; Airport concession interfaces]
5.2 Investment Model in Australia Car Rental & Leasing Market [Fleet financing lines; Residual value strategies; EV capex & charging]
5.3 Comparative Analysis of the Funnelling Process by Private vs Government Buyers [RFP cadence; Panel appointments; SLA/compliance gates; Payment terms]
5.4 Corporate Mobility Budget Allocation by Company Size, 2024 [Large enterprise; Mid-market; SME cohorts; Policy constraints]
8.1 Revenues, 2019-2024
9.1 By Service Type, 2024-2025P [Airport rentals; City/off-airport rentals; Corporate operating lease; Novated lease; Subscriptions/mid-term; Peer-to-peer]
9.2 By Vehicle Class, 2024-2025P [Economy & compact; Mid-size; SUVs & crossovers; Vans & utes; Premium & luxury; Specialty/4Ã-4]
9.3 By End-User Verticals, 2024-2025P [Leisure/tourism; Corporate; Government/public sector; Insurance replacement; Rideshare driver programs]
9.3.1 By Type of Corporate Mobility Program, 2024-2025P [Operating lease; Novated lease; Pool fleet mgmt; Project-based]
9.3.2 By Type of Leisure/Tourism Rental, 2024-2025P [Airport origin; Destination/city origin; One-way; Multicity/road-trip]
9.3.3 By Type of Insurance Replacement, 2024-2025P [Accident repair; Theft replacement; Total-loss bridging; Courtesy car]
9.3.4 By Type of Rideshare Rental, 2024-2025P [Weekly; Flexible day-to-day; EV rideshare packages; Hybrid packages]
9.4 By Company Size, 2024-2025P [Large enterprise; Medium-sized enterprise; SMEs]
9.5 By Employee Designation, 2024-2025P [Executive/CXO; Middle management; Field staff/frontline; Contractors]
9.6 By Mode of Booking, 2024-2025P [Direct web & app; Counter & call centre; OTA/aggregators; TMCs/mobility super-apps]
9.7 By Program Type (Open vs Customized/Negotiated), 2024-2025P
9.8 By Region (NSW, VIC, QLD, WA, SA, TAS, ACT, NT), 2024-2025P
10.1 Corporate Client Landscape & Cohort Analysis [Sector mix; Travel intensity; Policy constraints]
10.2 Rental/Leasing Decision-Making Process [Trigger events; Approval flows; Vendor selection; KPIs]
10.3 Program Effectiveness & ROI Analysis [Utilization; LOR; Downtime; Ancillary attachment; TCO levers]
10.4 Gap Analysis Framework [Need-solution mapping; CX gaps; Compliance gaps]
11.1 Trends & Developments [Contactless; Dynamic pricing; Telematics; OTA mix shift; EV pilots]
11.2 Growth Drivers [Tourism flows; Business density; Policy incentives; Digital penetration]
11.3 SWOT Analysis [Fleet access; Brand equity; Capital intensity; Regulatory exposure]
11.4 Issues & Challenges [Vehicle supply; Residual risk; Airport fees; Insurance practices; Charging dispersion]
11.5 Government & Regulatory Framework [ACCC ACL focus; ATO FBT/novated; Airport concession rules; State registration]
12.1 Market Size & Future Potential for Online/App Channel in Australia, 2019-2030
12.2 Business Model & Revenue Streams [Direct; OTA; Airline partnerships; Subscriptions]
12.3 Delivery Models & Product Types Offered [Keyless; Kiosk; Counter; EV bundles]
12.4 Cross-Comparison of Leading Online-First Players [Company overview; App installs; Revenues; Station count; Airport footprint; EV share; Fees; Loyalty; Partnerships]
15.1 Market Share of Key Players by Revenues, 2024
15.2 Benchmark of Key Competitors [Company overview; USP; Strategy; Business model; Fleet size & mix; Airport footprint; EV/HEV share; Utilization; ADR/RevPAC; Pricing fences; Tech stack; Best-selling categories; Major clients; Strategic tie-ups; Marketing strategy; Recent developments]
15.3 Operating Model Analysis Framework [Company-operated vs franchise; In-terminal vs shuttle; Contactless readiness]
15.4 Gartner-Style Quadrant View (Conceptual)
15.5 Bowmans Strategic Clock for Competitive Advantage
15.6 Company Profiles (15 Operators/Leasers)
-¢ Hertz Australia-¢ Avis Australia-¢ Budget Australia-¢ Europcar Australia-¢ Enterprise Rent-A-Car (incl. Redspot)-¢ SIXT Australia (NRMA)-¢ East Coast Car Rentals-¢ Apex Car Rentals-¢ Bargain Car Rentals-¢ Bayswater (No Birds)-¢ JUCY Group-¢ SG Fleet (incl. LeasePlan ANZ)-¢ McMillan Shakespeare Group (Maxxia)-¢ FleetPartners (Eclipx Group)-¢ ORIX Australia
16.1 Revenues, 2025-2030
17.1 By Service Type, 2025-2030
17.2 By Vehicle Class, 2025-2030
17.3 By End-User Verticals, 2025-2030
17.3.1 By Type of Corporate Mobility Program, 2025-2030
17.3.2 By Type of Leisure/Tourism Rental, 2025-2030
17.3.3 By Type of Insurance Replacement, 2025-2030
17.3.4 By Type of Rideshare Rental, 2025-2030
17.4 By Company Size, 2025-2030
17.5 By Employee Designation, 2025-2030
17.6 By Mode of Booking, 2025-2030
17.7 By Program Type (Open vs Customized/Negotiated), 2025-2030
17.8 By Region (NSW, VIC, QLD, WA, SA, TAS, ACT, NT), 2025-2030
Research Methodology
Step 1: Ecosystem Creation
Map the ecosystem and identify all the demand-side and supply-side entities for the Australia Car Rental & Leasing Market. Based on this ecosystem, we will shortlist leading 5–6 rental and leasing operators in the country based on their financial information, market reach, and client base. Sourcing is conducted through industry articles, multiple secondary, and proprietary databases to perform desk research around the market to collate industry-level information.
Step 2: Desk Research
Subsequently, we engage in an exhaustive desk research process by referencing diverse secondary and proprietary databases. This approach enables us to conduct a thorough analysis of the market, aggregating industry-level insights. We delve into aspects like the market revenues, number of rental and leasing operators, pricing structures, demand, and other variables. We supplement this with detailed examinations of company-level data, relying on sources like press releases, annual reports, financial statements, and similar documents. This process aims to construct a foundational understanding of both the market and the entities operating within it.
Step 3: Primary Research
We initiate a series of in-depth interviews with C-level executives and other stakeholders representing various Australia Car Rental & Leasing Market companies and end-users. This interview process serves a multi-faceted purpose: to validate market hypotheses, authenticate statistical data, and extract valuable operational and financial insights from these industry representatives. A bottom-to-top approach is undertaken to evaluate revenue contributions for each player, thereby aggregating to the overall market. As part of our validation strategy, our team executes disguised interviews wherein we approach each company under the guise of potential clients. This approach enables us to validate the operational and financial information shared by company executives, corroborating this data against what is available in secondary databases. These interactions also provide us with a comprehensive understanding of revenue streams, value chains, processes, pricing, and other factors.
Step 4: Sanity Check
A bottom-to-top and top-to-bottom analysis along with market size modeling exercises is undertaken to assess the sanity of the process.
FAQs
01. What is the potential for the Australia Car Rental & Leasing Market?
The market’s potential is reinforced by strong travel and corporate activity feeding airport and city fleets. Over the latest full year, Sydney handled 25,140,000 domestic passengers and 16,300,000 international passengers, while Melbourne handled 24,150,000 domestic and Brisbane 17,120,000 domestic, sustaining high on-airport rental throughput. Corporate demand is deep, with 2,662,998 actively trading businesses nationwide, including 999,161 employing businesses, supporting operating leases and novated programs. Policy tailwinds matter: the electric-car FBT exemption remains in place for eligible EVs, and the national fast-charging network reached about 900 sites by March, easing EV deployment in rental/leasing fleets.
02. Who are the key players in the Australia Car Rental & Leasing Market?
Airport and city rentals are led by Hertz, Avis/Budget, Europcar, SIXT (NRMA), and Enterprise (incl. Redspot), each with national networks and airport concessions. In fleet leasing and novated solutions, leaders include SG Fleet (which completed the acquisition of LeasePlan ANZ) and FleetPartners Group (the rebranded Eclipx Group), alongside ORIX. NRMA’s partnership brought SIXT into Australia at scale; Enterprise entered through Redspot, strengthening multi-brand coverage across major gateways. These firms dominate through airport footprints, OEM supply agreements, and corporate novated portfolios integrated with tax-efficient salary packaging.
03. What are the growth drivers for the Australia Car Rental & Leasing Market?
Passenger volumes underpin near-term demand: domestic commercial aviation carried 5.20 million passengers in May (latest month), while annual city totals at Sydney (25.14 million domestic) and Melbourne (24.15 million domestic) anchor fleet turns and length-of-rental dynamics. International traffic momentum adds to bookings, with 3.650 million international passengers in April. Corporate mobility is broad-based with 2.66 million active businesses, supporting operating leases, novated leases, and replacement rentals. Electrification is enabled by the electric-car FBT exemption and about 900 fast/ultrafast charging sites nationally, allowing EVs to slot into airport-to-CBD use cases and medium-term leases without range anxiety.
04. What are the challenges in the Australia Car Rental & Leasing Market?
Operators must navigate supply and operating constraints. Fleet planning is shaped by aviation seasonality despite strong demand; regional airports processed 25,030,000 domestic passengers in the latest year, concentrating peaks around events and holidays. Financing conditions remain tight with policy settings elevated (affecting lease cost structures), and staffing remains competitive across transport roles (labour metrics tracked by ABS/Jobs & Skills). Electrification faces infrastructure dispersion: the federal update notes about 900 fast/ultrafast sites nationally, but availability varies by state, complicating one-way rentals. Policy clarity is mixed—plug-in hybrids lose FBT-exempt status from 1 April 2025, requiring careful product-mix and residual-value planning for novated and corporate fleets.