Australia Digital Construction Market Outlook to 2030
By Solution Type, By Deployment Model, By Project Lifecycle Stage, By End-User, By Project Type, By Organisation Size, and By Region
- Product Code: TDR0221
- Region: Asia
- Published on: August 2025
- Total Pages: 80
Report Summary
The report titled: “Australia Digital Construction Market Outlook to 2030 – By Solution Type, By Deployment Model, By Project Lifecycle Stage, By End-User, By Project Type, By Organisation Size, and By Region” provides a comprehensive analysis of the Australia digital construction market. The report covers an overview and genesis of the industry, overall market size in terms of revenue, market segmentation; trends and developments, regulatory landscape, customer level profiling, issues and challenges, and competitive landscape including competition scenario, cross-comparison, opportunities and bottlenecks, and company profiling of major players in the digital construction market. The report concludes with future market projections based on solution types, deployment models, project lifecycle stages, end-user categories, project types, organisation sizes, regions, cause-and-effect relationships, and success case studies highlighting the major opportunities and cautions.
Australia Digital Construction Market Overview and Size
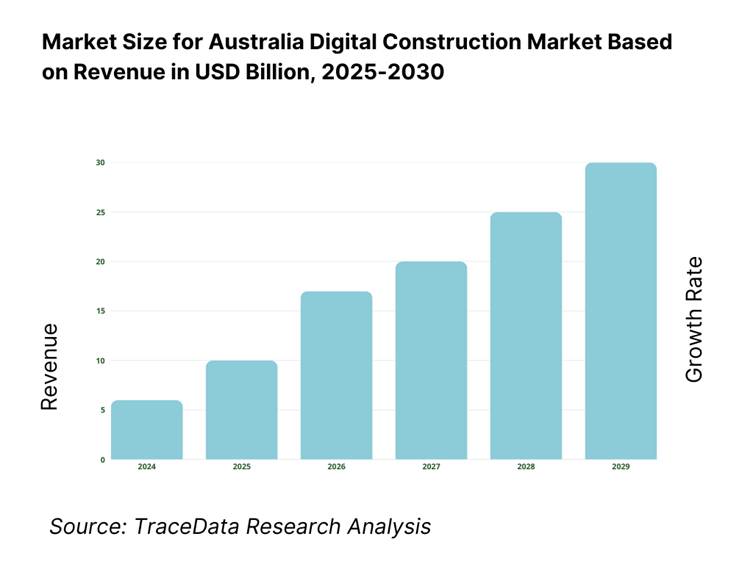
The Australia Digital Construction Market is valued at USD 3.10 billion in the latest analysis in 2025. This figure reflects actual recorded expenditure in the design and construction of data centre facilities. The market is propelled by rapidly expanding demand for cloud services, hyperscale data infrastructure, and AI‑driven capacity needs, which are pushing enterprises and hyperscalers to build or upgrade large-scale, high-reliability facilities.
Australia’s digital construction market is heavily concentrated in Sydney and Melbourne, primarily due to their established connectivity infrastructure, availability of skilled engineering and construction talent, and proximity to financial and corporate centres. Additionally, governments and investors favor these metros for critical digital infrastructure because of their access to renewable energy sources, robust telecommunications networks, and regulatory ecosystems that support data sovereignty—making them natural hubs for digital infrastructure investments.
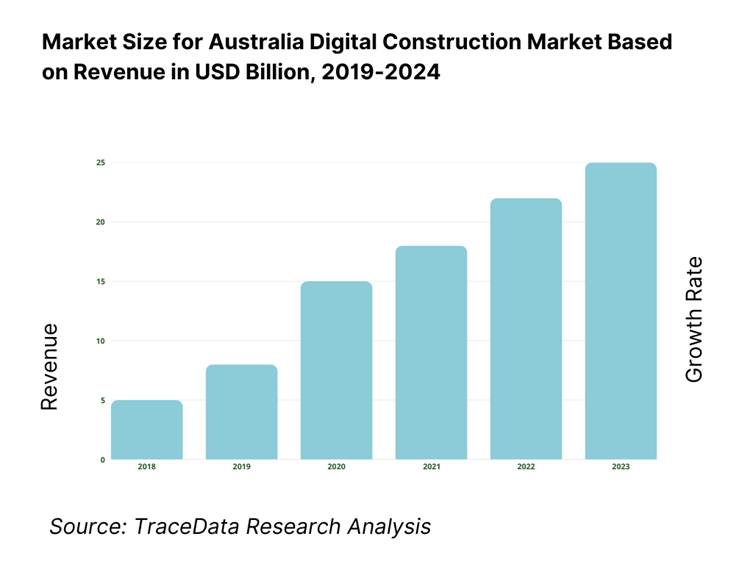
What Factors are Leading to the Growth of the Australia Digital Construction Market:
Public Infrastructure Pipeline: Australia’s public works pipeline is a foundational demand engine for digital construction, with A$16.5 bn committed to new and existing Commonwealth projects in the current budget cycle and a rolling 10-year pipeline “over A$120 bn” identified for land transport. At state level, New South Wales alone has outlined A$119.4 bn in capital expenditure over four years for transport, energy transition, housing and social assets, while the ACT has programmed A$8.2 bn over five years. These macro allocations flow straight into BIM-first delivery mandates, CDE usage, model-based assurance and digital twin readiness across hundreds of projects. Private fixed investment adds further pull: World Bank data show Australia’s gross fixed capital formation of US$425,205.96 m in the latest year, reinforcing the scale of assets requiring model-centric planning, construction and operational handover. Together, this breadth of activity and capex commitment compels contractors, consultants and owners to standardise on ISO 19650-aligned workflows, interoperable data schemas and federated model governance across multi-jurisdiction programs.
Productivity Gap: Australia’s construction sector operates with persistent productivity frictions that digital delivery directly targets. Jobs and Skills Australia reports 1,342,500 people employed in construction (latest release), anchoring a vast, distributed workforce that must coordinate through data-centric processes to lift output per hour. ABS productivity accounts show market-sector labour productivity increased, with construction contributing 0.4 percentage points to overall labour-productivity growth in 2023–24, yet the broader economy’s productivity uptick relied on only a 0.1 rise in hours-worked MFP—underscoring the need for process automation, clash-avoidance and model-based QA at scale. Macro labour demand remains elevated: the ABS counted 339,400 job vacancies in the May quarter (all industries), highlighting structural tightness that pushes firms toward digitised sequencing, 4D/5D controls and remote field capture to do more with the same workforce. At the macro-investment backdrop, the World Bank recorded US$425,205.96 m of fixed capital formation, pointing to sustained asset creation that amplifies the importance of turning information into productivity—through standardised EIR/BEPs, digital coordination gates and interoperable authoring-to-CDE-to-twin data flows.
ESG / Carbon Targets: Australia’s decarbonisation settings are reshaping project requirements, data collection and handover schemas across the asset lifecycle. The National Greenhouse Gas Inventory estimates 446.4 Mt CO₂-e for the year to December (latest update), while the Safeguard Mechanism places legislated baselines on ~215 large facilities—requiring robust metering, emissions data capture and audit trails that tie directly to design intent and as-built models. Clean Energy Regulator reports 961 corporations lodging NGER returns that together disclosed 303 Mt scope 1, 74 Mt scope 2, and 3,595 PJ net energy consumed—datasets increasingly referenced in BIM-to-AIM information exchanges and digital-twin performance analytics. On the demand side, rooftop PV momentum is quantifiable: CER flagged 81,000 systems (0.80 GW) installed in Q3 2024, with average system size at 9.9 kW, and more than 4 million small-scale renewable installations nationwide—inputs that drive grid-connection works, substation upgrades and DER-ready designs to be model-verified and geo-referenced. These macro carbon and energy vectors require carbon-aware take-offs, product EPD mapping and embodied-emissions fields embedded into asset information requirements to evidence compliance at commissioning and beyond.
Which Industry Challenges Have Impacted the Growth of the Australia Digital Construction Market:
Change Management: Shifting thousands of delivery teams from drawings-led coordination to data-centric delivery is the central adoption hurdle. Construction employs 1,342,500 people (latest JSA reading), dispersed across thousands of firms and trades with heterogeneous digital maturity. ABS shows monthly hours worked at 1,871 million at the start of the year (all industries), reflecting sustained utilisation that leaves limited slack for retraining without disrupting programs. The macro pipeline compounds this: Commonwealth budget adds A$16.5 bn to near-term works, while NSW programs A$119.4 bn over four years—compressing timelines and elevating risk if change management lags. Vacancies remain high in aggregate at 339,400 (all industries, May quarter), constraining backfill for reskilling. To operationalise ISO 19650 roles, teams must institutionalise EIR→BEP cascades, structured naming, transmittals and issue-tracking under CDE governance—supported by owner-mandated deliverables and measurable acceptance criteria—to convert macro spend into repeatable productivity gains.
Interoperability: Multi-agency programs and federated delivery structures make data flow the bottleneck. Austroads represents national and state road and transport agencies across Australia and New Zealand, and fields 24 representatives on World Road Association committees—illustrating the breadth of jurisdictions and technical forums to harmonise. Infrastructure Australia’s market-capacity analysis captures a A$213 bn five-year major public infrastructure pipeline embedded within A$1.08 trn of total construction activity—demand that spans transport, utilities and buildings, each carrying distinct schema and classification preferences unless aligned to openBIM conventions. Without consistent IFC/BCF views, agencies risk proliferating bespoke formats, duplicate model views and fragmented asset registers at handover. The practical remedy is codifying exchange requirements in EIRs, enforcing CDE package rules and using MVDs aligned to ISO 16739-1 to guarantee machine-readable exchanges between authoring tools, review tools and asset systems—so model provenance, spatial coordination and object properties persist from design to operations.
Data Sovereignty: Data stewardship requirements directly shape platform choice, hosting location and integration architecture. The OAIC recorded 1,113 notifiable data breaches across the calendar year 2024, with 595 notifications in the second half—an elevated risk posture that makes Australian-hosted, IRAP-assessed environments and auditable CDEs a procurement default for public works. In parallel, the Safeguard/NGER regimes require granular emissions data capture: the CER reports 961 corporations filing 2023–24 NGER returns, providing a nationwide dataset that is now routinely referenced in project ESG reporting and digital-twin performance baselines. As more asset owners stipulate sovereign hosting, encryption at rest and retention policies, platform providers must evidence compliance with the Australian Government Information Security Manual while maintaining seamless interoperability with BIM authoring tools and GIS. Robust, locally governed data pipelines become a non-negotiable to de-risk contractual exposure and protect evidence logs over asset lifecycles measured in decades.
What are the Regulations and Initiatives which have Governed the Market:
AS ISO 19650 (Information Management): The AS ISO 19650 suite—adopted nationally—anchors information management for buildings and civil assets, with five parts covering concepts, delivery stages, operations, security-minded information management and guidance. Standards Australia convenes 5,000+ experts across committees, providing the consensus machinery that keeps the series current and aligned with Australian procurement realities. In practice, the series operationalises appointing-party information requirements, BEP structures, acceptance criteria and CDE workflow definitions that enable traceable model exchanges across multi-year programs. Current agency frameworks (e.g., transport) map their gate reviews and transmittals to ISO 19650 artefacts, ensuring naming conventions, file states and issue histories are consistent and machine-readable for downstream cost, schedule and FM systems—so asset information models remain verifiable decades after practical completion.
NATSPEC BIM Guide (Templates & Execution): NATSPEC maintains a national library of BIM resources that operationalises ISO-aligned delivery with editable templates. The resource hub enumerates AIR, PIR, EIR and BEP templates and related appendices, while the 2024 release refreshed the Pre-Appointment and Delivery-Team BEP templates—giving owners and delivery teams structured inputs for responsibility matrices, model uses, object property sets and approval gates. These artefacts convert high-level policy into field-ready checklists and file-naming schemas that reduce RFI loops and “model ambiguity.” Because the templates are nationally consistent and openly published, they support cross-jurisdiction comparability and auditability on programs that involve multiple agencies and contractors, helping teams maintain a single source of truth across authoring tools, CDEs and review platforms during coordination, construction and as-built handover.
ABAB AIR (Asset Information Requirements): The Australasian BIM Advisory Board curates publications to standardise how owners define the data they need at handover. Its library highlights the Asset Information Requirements (AIR) Guide as the starting point for appointing parties to specify asset data fields, formats and acceptance tests before design starts, and complements this with the Australasian BIM Benefits Reporting (ABBR) Guide to structure benefits capture. These materials are widely referenced by public clients to bridge capital-delivery and operations, ensuring that asset registers, equipment hierarchies and maintenance attributes are requested up-front and then checked into the CDE consistently at gates. Formalising AIR upfront avoids costly retro-fits of data late in delivery and improves the fidelity of NGER-relevant energy and emissions fields at commissioning—so digital twins inherit clean, validated AIMs that can be trusted in operations.
Australia Digital Construction Market Segmentation
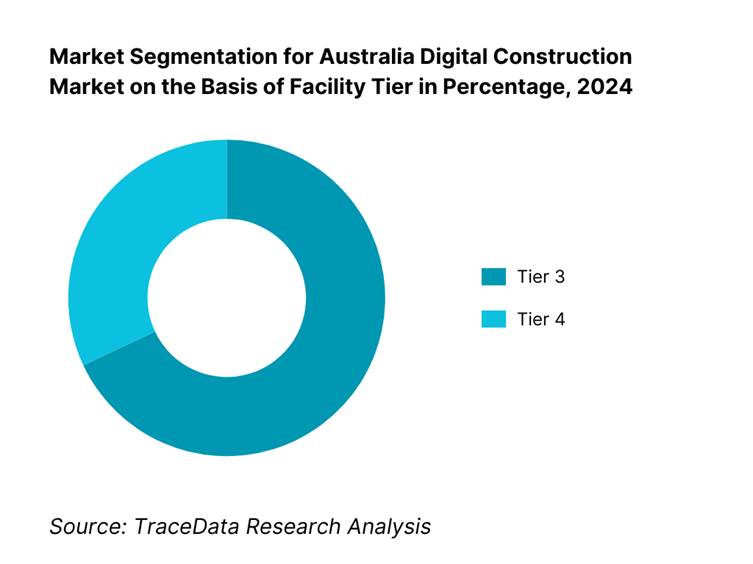
By Facility Tier: In Australia, digital construction is segmented into Tier 3 and Tier 4 facilities. Tier 3 clearly holds the lion’s share—around 68 %—due to its compelling combination of high availability, manageable costs, and conformity with enterprise reliability expectations. It strikes the ideal balance for most cloud providers and institutional users who require robust uptime without the elevated costs of Tier 4 configurations. Tier 4, while technically superior, remains a smaller yet swiftly expanding segment, driven by specialized use cases, such as AI computing clusters and sovereign cloud mandates, that prioritize zero downtime and full redundancy.
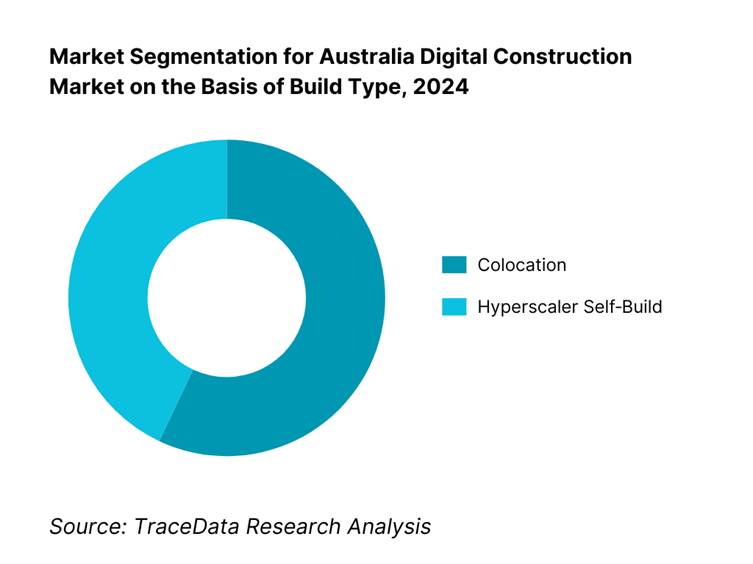
By Build Type: The Australia digital construction market is also segmented into colocation facilities and hyperscaler self-builds. Colocation leads with roughly 57 % share, driven by demand for turnkey infrastructure solutions that offer flexibility, lower entry costs, and ease of expansion without owning the full asset base. It's particularly favored by enterprises and service providers seeking rapid deployment. In contrast, hyperscaler self-builds account for ~43 % and are growing rapidly, driven by large-scale cloud operators like AWS, Microsoft, and Google, who require bespoke power, AI-capable architectures, and sovereign control over their physical infrastructure.
Competitive Landscape in Australia Digital Construction Market
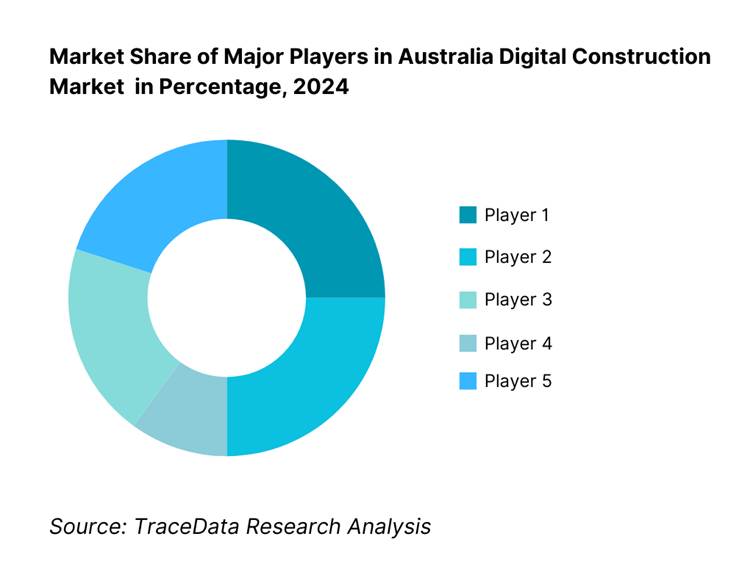
The Australia digital construction market is dominated by a mix of global hyperscale players, local construction giants, and specialized infrastructure developers. This consolidation highlights the strategic influence of key organisations in shaping infrastructure delivery and digital capacity.
Name | Founding Year | Headquarters |
Oracle Aconex | 2000 | Melbourne, Australia |
Procore Technologies | 2002 | Carpinteria, USA |
Autodesk Construction Cloud (incl. Revit) | 1982 | San Rafael, USA |
Bentley Systems | 1984 | Exton, USA |
Trimble (Tekla, Viewpoint, Connect) | 1978 | Sunnyvale, USA |
Hexagon / Leica Geosystems | 1992 | Stockholm, Sweden |
Nemetschek Group (Bluebeam, Solibri) | 1963 | Munich, Germany |
InEight | 2013 | Scottsdale, USA |
HammerTech | 2015 | Melbourne, Australia |
Assignar | 2014 | Sydney, Australia |
Some of the recent competitor trends and key information about competitors include:
Oracle Aconex: Oracle Cloud for Australian Government & Defence achieved Hosting Certification Framework “Certified Strategic” status, strengthening data-sovereignty credentials that many Aconex public-sector deployments rely on for sensitive project information and CDE hosting.
Procore Technologies: Procore launched Procore AI with new agents to boost construction-management efficiency, and it operates an APAC HQ in Sydney following sustained local growth—underscoring deep regional investment and product localization (e.g., Action Plans, Correspondence).
Autodesk Construction Cloud: Autodesk outlined major AI and data-connection advancements for BIM (ACC Build/Takeoff/BIM Collaborate) that tighten model-to-field workflows and analytics—highly relevant to ISO 19650 delivery and model-based assurance on Australian programs.
Bentley Systems: Bentley announced generative AI for civil site design (OpenSite+) and shipped SYNCHRO 4D Pro 2024 updates enhancing interoperability (e.g., SketchUp/DWG 2024 SDKs, iTwin.js 4.10, ProjectWise Explorer 23.06 support), signaling faster 4D rollout on linear and social-infra projects.
Bluebeam: Recent releases added AI Auto Align, markups on capture and web access to Studio Projects, improving review/markup speed and auditability across dispersed project teams in Australia’s multi-state delivery environment.
What Lies Ahead for Australia Digital Construction Market?
Steady Expansion Through the Forecast Horizon: The Australia digital construction market is set to grow steadily as multiyear public infrastructure programs, agency-level digital engineering mandates, and asset-owner demands for ISO 19650-aligned delivery deepen. Continued investment in transport, energy transition, social infrastructure, and resources will keep BIM, CDEs, 4D/5D planning, and digital twins at the core of project controls and assurance. The outlook is reinforced by tightening data-sovereignty expectations and carbon reporting requirements that make model-based information management a non-negotiable across design, build, and operations.
Rise of Hybrid Delivery Models: Delivery will tilt further toward hybrid approaches that blend off-site manufacturing and on-site assembly with fully digital workflows. Expect wider use of reality capture, design-for-manufacture-and-assembly (DfMA), and model-based procurement, all synchronized through CDEs. This pairing of physical prefabrication with 4D sequencing and automated QA will compress schedules, reduce rework, and standardize handover packages, accelerating adoption among Tier-1s, Tier-2s, and public owners seeking predictable outcomes.
Focus on Outcome-Based Delivery: Owners will increasingly tie payments and risk transfer to verifiable outcomes—safety, schedule certainty, defect close-out time, and operational readiness—measured directly from federated models and digital twins. Clear EIR→BEP cascades, rules-based model checking, and traceable transmittals will move from “good practice” to contractual baselines. As-built to AIM continuity will be emphasized, enabling facilities teams to inherit structured data for maintenance, compliance, and whole-of-life performance from day one.
Expansion of Sector-Specific Playbooks: Sector-tailored digital engineering playbooks will proliferate across transport, energy and utilities, social infrastructure, and resources. Transport agencies will deepen linear-asset modeling and 4D corridor staging; utilities will prioritize geospatial/BIM integration and IoT-ready asset schemas; hospitals and education will push standardized object libraries and commissioning data; resources will lean on remote site digitization and autonomous survey. These verticalized requirements will shape vendor roadmaps and partner ecosystems.
Leveraging AI and Analytics: AI will scale from pilots to everyday practice: automated clash clustering, schedule-risk prediction, quantity extraction, defect detection from 360° imagery, and carbon/EPD mapping into take-offs. Combined with sensor-linked twins, teams will benchmark plan vs. actual in near-real time, driving proactive decisions in the field. Open APIs and data pipelines will become table stakes so insights can flow across authoring tools, CDEs, ERP/PMIS, and FM systems—turning project data into actionable intelligence and measurable ROI.
Australia Digital Construction Market Segmentation
By Solution Type
BIM Authoring Tools (Revit, Archicad, Tekla)
Common Data Environments (CDEs) (Aconex, ProjectWise, Trimble Connect)
4D/5D/7D Planning & Cost Control
Reality Capture & Scan-to-BIM (LiDAR, photogrammetry, 360° imaging)
Digital Twin Platforms / AIM
Field & Site Management Software (HSEQ, QA/QC, safety, inspections)
Procurement & Supply Chain Management Platforms
Handover & Facilities Management Integration Tools
By Deployment Model
Cloud-Based (AU Data Residency)
On-Premise
Hybrid
By Project Lifecycle Stage
Design & Engineering
Pre-Construction Planning
Construction Execution
Commissioning & Handover
Operations & Maintenance
By End-User Type
Public Infrastructure Agencies (e.g., Transport for NSW, VicRoads, QLD TMR)
Private Developers & Asset Owners
EPC Contractors / Tier-1 & Tier-2 Builders
Trade Subcontractors
Design & Consulting Firms
Facilities Management & Asset Operators
By Project Type
Transport Infrastructure (roads, rail, airports, ports)
Utilities & Energy (power, water, renewable energy infrastructure)
Buildings (commercial, residential, social infrastructure)
Industrial & Resources (mining, oil & gas, manufacturing)
Mixed-Use / Large Precinct Developments
By Organisation Size
Tier-1 Enterprises (large-scale national/multinational contractors and owners)
Tier-2 Enterprises
Small & Medium Enterprises (SMEs)
By Region
New South Wales (NSW)
Victoria (VIC)
Queensland (QLD)
Western Australia (WA)
South Australia (SA)
Tasmania (TAS)
Australian Capital Territory (ACT)
Northern Territory (NT)
Players Mentioned in the Report:
Oracle Aconex
Procore Technologies
Autodesk Construction Cloud
Bentley Systems
Trimble (Tekla, Viewpoint)
Hexagon / Leica Geosystems
Nemetschek Group (Bluebeam, Solibri)
Graphisoft (Archicad)
Bluebeam (Revu)
RIB Software (iTWO)
InEight
HammerTech
Assignar
Buildxact
Nearmap
Key Target Audience
Chief Digital Engineering Officers (Owners, Tier‑1 Infrastructure Agencies)
CIOs / Heads of Infrastructure Delivery (Government agencies: Infrastructure Australia, Transport for NSW, Department of Transport & Main Roads QLD)
Infrastructure Investment and Venture Capitalist Firms
Energy & Power Utility Executives (for green‑powered digital infrastructure)
Data Centre Developers & Real Estate Investors
Procurement Heads (Hyperscale and Colo clients)
Digital Infrastructure Policymakers / Regulators (e.g., Department of Industry, Science and Resources)
Asset Managers / FM Heads (Infrastructure Owners transitioning to digital twins)
Time Period:
Historical Period: 2019-2024
Base Year: 2025
- Forecast Period: 2025-2030
Report Coverage
Choose individual sections to purchase. Mix and match as you like.
4.1 Delivery Model Analysis for Digital Construction-Cloud, On-Premise, Hybrid, and SaaS Modules (Margins, Adoption Preferences, Strengths & Weaknesses)
4.2 Revenue Streams for Australia Digital Construction Market (Licensing, Implementation, Training, Data Hosting, Integration Services)
4.3 Business Model Canvas for Australia Digital Construction Market (Customer Segments, Value Propositions, Channels, Revenue & Cost Structure)
5.1 Specialist Digital Engineering Consultants vs. In-House BIM Teams
5.2 Investment Model in Australia Digital Construction Market (Government Funding, Private Equity, Vendor R&D, Venture Capital)
5.3 Comparative Analysis of Digital Delivery Frameworks-Government vs. Private Sector Projects
5.4 Digital Construction Budget Allocation by Project Size & Type
8.1 Revenues, 2019-2024
9.1 By Market Structure (In-House vs. Outsourced Digital Engineering), 2023-2024P
9.2 By Solution Type (BIM Authoring, CDE, 4D/5D, Reality Capture, Digital Twin, HSEQ), 2023-2024P
9.3 By Industry Verticals (Transport Infrastructure, Buildings, Utilities, Industrial, Mining & Resources), 2023-2024P
9.3.1 By Type of Transport Digital Engineering (Road, Rail, Ports, Airports), 2023-2024P
9.3.2 By Type of Building Digital Engineering (Commercial, Residential, Social Infrastructure), 2023-2024P
9.3.3 By Type of Utilities Digital Engineering (Energy, Water, Wastewater), 2023-2024P
9.3.4 By Type of Industrial Digital Engineering (Oil & Gas, Manufacturing, Logistics), 2023-2024P
9.4 By Organisation Size (Tier-1, Tier-2, SMEs), 2023-2024P
9.5 By Stakeholder Role (Owners, Contractors, Consultants, FM Operators), 2023-2024P
9.6 By Deployment Model (Cloud, On-Premise, Hybrid), 2023-2024P
9.7 By Open vs. Proprietary BIM Workflows, 2023-2024P
9.8 By Region (NSW, VIC, QLD, WA, SA, TAS, ACT, NT), 2023-2024P
10.1 Client Landscape & Cohort Analysis (Government Agencies, Private Developers, Infrastructure Owners)
10.2 Digital Construction Needs & Procurement Decision-Making Process
10.3 Project Outcome & ROI Analysis (Rework Reduction, Schedule Certainty, Safety Improvements, Carbon Reporting)
10.4 Gap Analysis Framework (ISO 19650 Compliance, BIM Use Cases, Digital Twin Readiness)
11.1 Trends & Developments for Australia Digital Construction Market (ISO 19650, OpenBIM, Digital Twins, AI/ML Integration)
11.2 Growth Drivers (Government Mandates, Productivity Gains, Carbon Neutral Targets, Prefab/DFMA Adoption)
11.3 SWOT Analysis for Australia Digital Construction Market
11.4 Issues & Challenges (Skills Shortage, Interoperability, Legacy Systems, Change Management)
11.5 Government Regulations & Standards (NATSPEC BIM Guide, TfNSW DE Framework, QLD TMR BIM Guideline, Austroads Guide, GDA2020)
12.1 Market Size & Future Potential for Cloud-Based Solutions, 2019-2030
12.2 Business Model & Revenue Streams (Subscription, Pay-Per-Project, Enterprise Licensing)
12.3 Deployment Models & Key Features Offered
12.4 Cross-Comparison of Leading Platforms (Company Overview, Local Hosting Compliance, Revenue, Market Share, Pricing, Integration Capability, Best-Selling Modules, Major Clients)
15.1 Market Share of Key Players (By Revenue), 2024
15.2 Benchmark of Key Competitors (Company Overview, USP, Business Strategies, Business Model, Number of Projects, Revenue, Pricing, Technology Stack, Top Use-Cases, Major Clients, Partnerships, Marketing Strategy, Recent Developments)
15.3 Operating Model Analysis Framework
15.4 Gartner Magic Quadrant Positioning for CDE/BIM Vendors
15.5 Bowmans Strategic Clock for Competitive Advantage
15.6Major Competitors: Oracle Aconex, Procore Technologies, Autodesk Construction Cloud, Bentley Systems, Trimble, Hexagon/Leica Geosystems, Nemetschek Group, Graphisoft, Bluebeam, RIB Software, InEight, HammerTech, Assignar, Buildxact, Nearmap
16.1 Revenues, 2025-2030
17.1 By Market Structure (In-House vs. Outsourced), 2025-2030
17.2 By Solution Type, 2025-2030
17.3 By Industry Verticals, 2025-2030
17.3.1 By Type of Transport Digital Engineering, 2025-2030
17.3.2 By Type of Building Digital Engineering, 2025-2030
17.3.3 By Type of Utilities Digital Engineering, 2025-2030
17.3.4 By Type of Industrial Digital Engineering, 2025-2030
17.4 By Organisation Size, 2025-2030
17.5 By Stakeholder Role, 2025-2030
17.6 By Deployment Model, 2025-2030
17.7 By Open vs. Proprietary BIM Workflows, 2025-2030
17.8 By Region, 2025-2030
Research Methodology
Step 1: Ecosystem Creation
Map the ecosystem and identify all demand-side and supply-side entities for the Australia Digital Construction Market. On the demand side, this includes public asset owners (e.g., Transport for NSW, VicRoads, QLD TMR), private developers, EPC contractors, tier-1 and tier-2 builders, and facilities management operators. On the supply side, it encompasses BIM/CDE software providers, engineering consultancies, digital twin specialists, reality capture firms, and integration service partners. Based on this mapping, we shortlist 5–6 leading digital construction solution providers in the country, evaluating them on financial strength, market penetration, project pipeline, and alignment with ISO 19650-compliant delivery. Sourcing is conducted through government tender portals, industry publications, and multiple secondary and proprietary databases to consolidate industry-level intelligence.
Step 2: Desk Research
An exhaustive desk research phase follows, drawing from diverse secondary and proprietary databases. This involves compiling insights on market revenues, project delivery volumes, number of BIM-enabled projects, technology adoption rates, and key regulatory frameworks shaping adoption. We also analyse company-level details from press releases, annual reports, tender submissions, and audited financials. The analysis captures solution pricing models (seat-based, project-based, enterprise), implementation timelines, integration strategies, and vendor hosting capabilities (including IRAP and local data sovereignty compliance). This process establishes a comprehensive baseline for both the market landscape and the operational dynamics of its major participants.
Step 3: Primary Research
We conduct in-depth interviews with C-level executives, digital engineering managers, BIM coordinators, and asset information managers from companies and end-users in the Australia Digital Construction Market. These interactions validate hypotheses from desk research, confirm macro trends like ESG compliance-driven adoption, and authenticate technical and operational data. A bottom-up approach is used to assess project-level contributions to vendor revenues, aggregating toward total market size. As part of our validation, we employ disguised interviews as potential clients to test claims around implementation timelines, interoperability, and client references. These interviews reveal revenue streams, integration workflows, data governance practices, and value chain relationships between software vendors, contractors, and government agencies.
Step 4: Sanity Check
We run both bottom-up and top-down analyses, integrating market size modelling with public infrastructure pipeline data, tender award patterns, and software licensing penetration. This dual modelling ensures the consistency of derived figures with real-world capacity, project counts, and end-user adoption rates. Any anomalies are reconciled against primary data, ensuring that the final market size and segmentation accurately reflect the operational reality of Australia’s Digital Construction ecosystem.
FAQs
01 What is the potential for the Australia Digital Construction Market?
The Australia Digital Construction Market shows strong potential as public infrastructure programs, agency-level digital engineering mandates, and owner requirements for ISO 19650–aligned delivery become standard practice. Model-based coordination (BIM), common data environments, 4D/5D planning, reality capture, and digital twins are moving from pilot to baseline on transport, utilities, social infrastructure, and resources projects. As asset owners push for data-rich handover and ongoing performance insights, vendors and delivery partners with open standards, local hosting, and deep integration capabilities are best positioned to capture multi-year, program-scale opportunities.
02 Who are the Key Players in the Australia Digital Construction Market?
Key players include Oracle Aconex, Procore, Autodesk Construction Cloud, Bentley Systems (ProjectWise/SYNCHRO), Trimble (Tekla/Viewpoint), Hexagon/Leica Geosystems, Nemetschek Group (Bluebeam/Solibri), Graphisoft, RIB Software (iTWO/iTWOcx), InEight, HammerTech, Assignar, Buildxact, and Nearmap. These companies stand out for mature CDE/BIM toolchains, strong partner ecosystems, localization (GDA2020, Australian classifications), data sovereignty options, and integrations with ERP/scheduling/FM systems—enabling end-to-end information flow from design through construction to operations.
03 What are the Growth Drivers for the Australia Digital Construction Market?
Growth is propelled by the multi-year public works pipeline; ISO 19650–aligned requirements from transport, health, and education agencies; and owners’ need to de-risk delivery with verifiable, model-based assurance. Productivity pressures, skilled-labour constraints, and remote/complex project footprints push adoption of clash detection, automated quantity take-off, 4D sequencing, and digital QA/QC. ESG and carbon reporting requirements further elevate demand for structured data, asset information models, and sensor-linked twins that can evidence performance from commissioning into operations.
04 What are the Challenges in the Australia Digital Construction Market?
The market faces tough change-management across fragmented supply chains, uneven digital maturity among contractors and trades, and persistent interoperability issues between authoring tools, review platforms, and asset systems. Data sovereignty and cybersecurity requirements necessitate local hosting, IRAP/ISM alignment, and robust governance within CDEs. Contractual clarity on “model as contract,” IP/ownership, and acceptance criteria is still evolving, while talent shortages in BIM coordination, information management, and integration engineering can slow consistent, program-wide adoption.