Australia Gaming & Esports Market Outlook to 2030
By Platform (Mobile, Console, PC, Cloud, XR), By Revenue Stream (Premium Sales, In-App Purchases, Advertising, Subscriptions, Media Rights, Sponsorship, Tickets, Merchandise), By Genre (FPS/Tactical, Sports, Racing, RPG/Action-Adventure, Simulation/Manage
- Product Code: TDR0222
- Region: Asia
- Published on: August 2025
- Total Pages: 80
Report Summary
The report titled “Australia Gaming & Esports Market Outlook to 2030 – By Platform (Mobile, Console, PC, Cloud, XR), By Revenue Stream (Premium Sales, In-App Purchases, Advertising, Subscriptions, Media Rights, Sponsorship, Tickets, Merchandise), By Genre (FPS/Tactical, Sports, Racing, RPG/Action-Adventure, Simulation/Management, Casual/Party, Battle Royale), By Gamer Cohort (Casual, Mid-core, Core, Esports Enthusiasts, Creators), By Tournament Format (Open, Franchise, Hybrid), and By State/Territory (NSW, VIC, QLD, WA, SA, TAS, ACT, NT)” provides a comprehensive analysis of the gaming and esports industry in Australia. The report covers an overview and genesis of the industry, overall market size in terms of revenue, market segmentation; trends and developments, regulatory landscape, customer level profiling, issues and challenges, and competitive landscape including competition scenario, cross-comparison, opportunities and bottlenecks, and company profiling of major players in the gaming and esports market. The report concludes with future market projections based on gamer base growth, platform adoption, monetization streams, regional performance, cause-and-effect relationships, and success case studies highlighting the major opportunities and cautions.
Australia Gaming and Esports Market Overview and Size
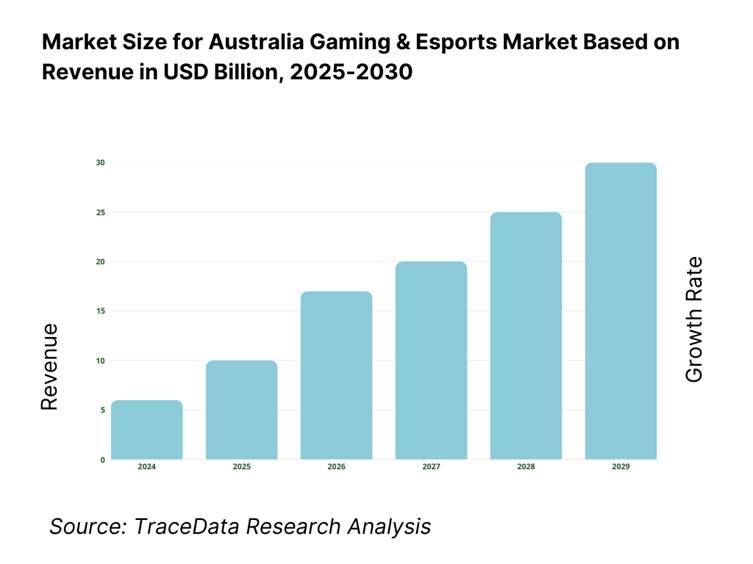
The Australia gaming industry is valued at approximately USD 2.35 bn in 2023, based on local game developer revenue of AUD 345 million (about USD 234.8 million) and total consumer spend of AUD 4.4 bn (about USD 3.0 bn) on video games in that year. This strong foundation reflects both robust consumer demand across digital and retail sales and vibrant industry activity among developers, driven by rising broadband penetration, mobile gaming uptake, and producer incentives like the Digital Games Tax Offset.
Victoria, New South Wales, and Queensland dominate the development landscape, accounting for 71 % of Australia’s game studios. Their dominance stems from generous state-level incentives—tax rebates and grants—coupled with mature creative ecosystems and proximity to capital and talent, making these states the industry’s epicentres.
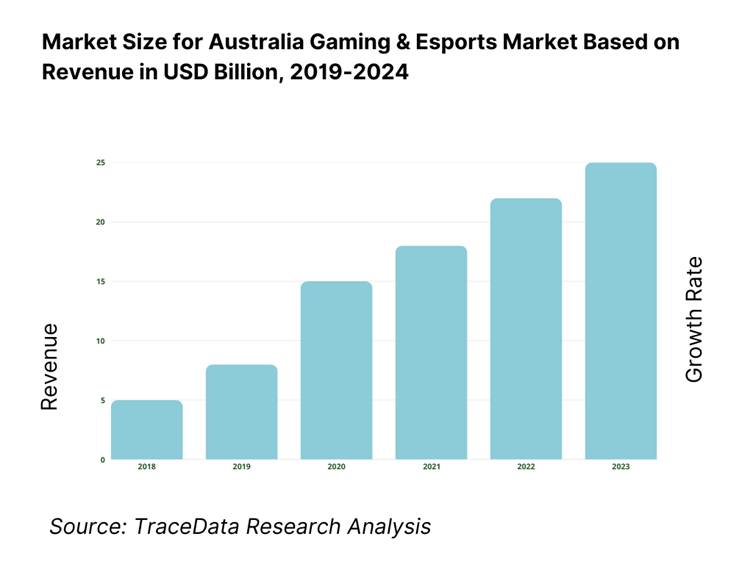
What Factors are Leading to the Growth of the Australia Gaming and Esports Market:
Broadband penetration: Australia’s gaming and esports usage sits on a deep fixed-line foundation. National Broadband Network (NBN) wholesale fixed-line and fixed-wireless services reached 8,715,000 in operation, while major retailers alone reported 7,412,000 retail NBN services—an addressable baseline for online play, digital downloads, cloud gaming and esports streaming. Consumption intensity is rising: each NBN service averaged 497 gigabytes downloaded per month, and Australians downloaded 11,600,000 terabytes across retail broadband and mobile in a single quarter—evidence of bandwidth-heavy entertainment habits that favor multiplayer titles, patches and 4K streams. These hard counts underpin reliable reach for publisher launches, live-ops events and tournament broadcasts.
5G rollout: Low-latency mobile is expanding the play window beyond the living room—vital for mobile esports, second-screen engagement and cross-platform ecosystems. As of the latest national infrastructure audit, operators had activated 5,082 (Telstra), 4,038 (Optus) and 3,050 (TPG Telecom) 5G sites. On the demand side, Australians maintained 30,000,000+ mobile phone services in operation against a population of 27,100,000, and average mobile data consumption per service reached 10.5 gigabytes per month. This density allows publishers to push larger mobile game assets, live events and AR features at scale while event organizers rely on 5G uplinks for onsite content production and fan activations.
Console install base: While precise console counts are proprietary, the official content pipeline and access infrastructure show a robust console-ready audience. The Classification Board processed 223 commercial computer games in the latest reporting year—steady supply for platform libraries and esports titles. On-net access is ubiquitous via 7,412,000 retail NBN services, enabling always-connected experiences, large downloads and live service patches. Payments infrastructure processes enormous digital volumes that align with console storefront micro-transactions: Australians executed 1,332.9 million card purchases in a single month, with transaction value of $88.7 billion and 65.4 million cards on issue—ample capacity for DLC, battle passes and in-game currency.
Which Industry Challenges Have Impacted the Growth of the Australia Gaming and Esports Market:
Talent scarcity: Studios and esports operators compete in a tight national tech labor pool. The Information Media & Telecommunications industry employed 185,600 people, within a workforce of 14,900,000 employed Australians—while Professional, Scientific & Technical Services accounted for 1,317,600 employed people, absorbing many software, data and creative technologists relevant to game production and event tech. Policy levers are active: the permanent Migration Program allocates 132,200 skilled places (total program 185,000), but these places are spread across the whole economy, not just interactive content. Recruiting game engineers, netcode specialists, broadcast ops and anti-cheat analysts therefore remains structurally competitive.
Ratings & safety compliance: Australia’s online safety regime shapes how communities, streams and UGC are moderated. In the latest year the regulator recorded 3,113 adult cyber-abuse complaints and issued 3 formal removal notices (two to a social media provider, one to a hosting provider), while operating with 170 APS staff. These figures translate into real operational requirements for game publishers, platforms and tournament organizers: robust reporting tools, takedown workflows, and moderation headcount for chat, voice and livestreams. Compliance exposure rises during high-traffic moments—new season drops, influencer events, LAN finals—when escalation volumes spike and response SLAs must hold to regulator expectations.
Payments friction: Friction in identity, age-gating and cross-border settlements can erode conversion even as payments volumes balloon. In a single month, Australians made 1,332.9 million card purchases worth $88.7 billion, and held 65.4 million cards—numbers that underscore the need for seamless fraud controls, chargeback management and compliant age verification for in-game purchases. Real-time account-to-account rails are also material: the RBA’s series now publishes counts for New Payments Platform (NPP) transactions, and the national plan prioritizes ISO 20022 and faster cross-border settlement—critical for esports prize pools and digital store payouts. Studios must design flows that absorb high transaction counts while meeting device-present and remote authentication standards.
What are the Regulations and Initiatives which have Governed the Market:
Online Safety Act: The Online Safety Act empowers the eSafety Commissioner with takedown and enforcement tools that directly affect game platforms, streaming hubs and community servers. In the latest reporting year, eSafety handled 3,113 adult cyber-abuse complaints and issued 3 removal notices under its schemes; the office operated with 170 APS staff. For gaming businesses, this means maintaining rapid escalation paths, documented moderation policies, and records for notice compliance—especially during esports broadcasts and creator-led activations. The statutory framework and annual metrics demonstrate active oversight; platforms with chat, UGC, or streaming features must incorporate these obligations into trust & safety roadmaps and vendor SLAs.
eSafety Codes: Australia’s co-regulatory approach requires industry compliance with registered codes across 8 distinct service sections (from social media and messaging to app stores and hosting). Phase-one codes are registered and enforceable, creating defined expectations for content moderation, reporting tools, and transparency—touching multiplayer services, creator monetization and esports chat integrations. For publishers and tournament platforms, code coverage means auditing interfaces that allow user sharing, live comments and voice, and ensuring reporting queues can intake, triage and resolve harms in line with code-specified functions and timelines. The breadth—eight sections—ensures gaming touchpoints across platforms fall squarely within scope.
Australian Classification Board changes on loot boxes: Policy has tightened around monetization mechanics: new settings mandate a minimum M classification where loot boxes are present and R18+ where simulated gambling appears—directly impacting title positioning, parental controls, and marketing. The regime covers a vigorous pipeline: the Board classified 223 commercial computer games in the latest year, with 9 at R18+ and 2 refused classification—illustrating tangible gatekeeping on content. Design teams must account for Australian builds and disclosures, and esports organizers should align sponsorship and broadcast overlays to classification advice for featured titles. Clear rules on randomized rewards sharpen compliance needs across storefronts, events and influencer content.
Australia Gaming and Esports Market Segmentation
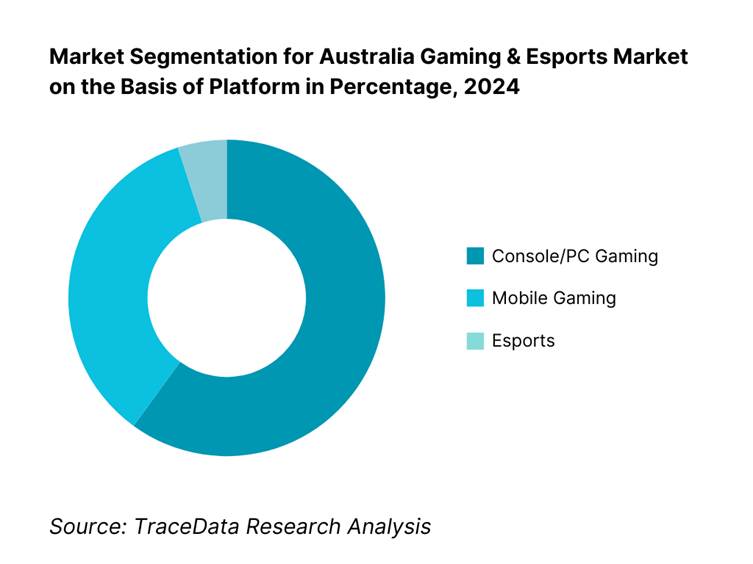
By Platform: The Australia gaming market is segmented by platform into Console/PC, Mobile, and Esports. Console/PC gaming holds a dominant share, rooted in its long-standing install base, deep content libraries, and high-value digital and retail formats. Mobile gaming accounts for a growing second segment, buoyed by widespread smartphone adoption and accessibility of free-to-play titles. Esports, while currently a smaller proportion, is gaining pace through rising sponsorship, media coverage, and organized leagues, pointing to future potential. The strength of Console/PC lies in established monetization, whereas mobile’s appeal stems from convenience and broad demographic reach. Esports, though nascent, is carving out revenue from live events and digital engagement, setting the stage for upward momentum in coming years.
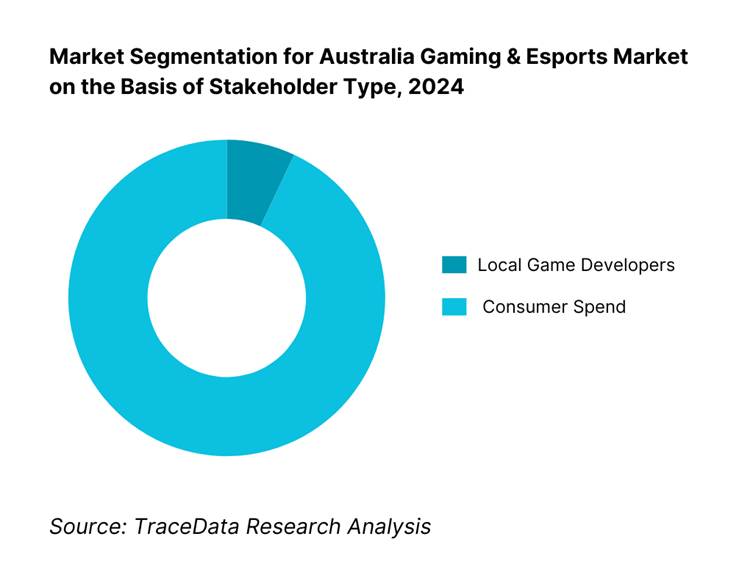
By Stakeholder Type: The market splits into Local Game Developers and Consumer Spending. Consumer Spending overwhelmingly dominates, as gamers across Australia generate the bulk of revenue through game purchases and digital content. Local developers—though representing just a modest share—are experiencing rapid growth, fueled by strong CAGR and government incentives like DGTO. Their creative output is rising, supported by expanding talent and investment, but remains constrained by scale. Thus, while developers form the innovation engine of the sector, consumer demand is the primary value driver of the market overall.
Competitive Landscape in Australia Gaming and Esports Market
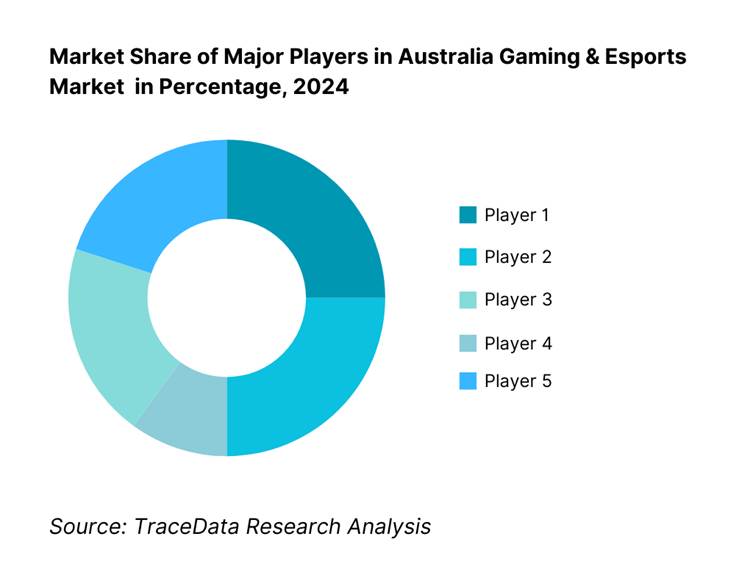
The Australia gaming & esports market is moderately consolidated, with a mix of major global publishers, platform holders, and prominent local studios shaping the competitive landscape. Industry leaders such as Sony Interactive Entertainment Australia, Microsoft Xbox ANZ, and Nintendo Australia dominate platform ecosystems, while domestic developers like PlaySide Studios, Big Ant Studios, and Halfbrick Studios contribute unique IP and localized content. The rise of esports operators such as ESL FACEIT Group (Australia) and LetsPlay.Live, along with the growth of cloud gaming providers like Pentanet/CloudGG, has diversified the market, offering players a wider range of game access models, competitive formats, and community-driven experiences.
Name | Founding Year | Headquarters |
PlaySide Studios | 2012 | Melbourne, Australia |
Halfbrick Studios | 2001 | Brisbane, Australia |
Mighty Kingdom | 2010 | Adelaide, Australia |
Big Ant Studios | 2001 | Melbourne, Australia |
Team Cherry | 2014 | Adelaide, Australia |
Blowfish Studios | 2008 | Sydney, Australia |
Pentanet / CloudGG | 2017 | Perth, Australia |
Riot Games (Riot Sydney) | 2006 | Los Angeles, USA |
ESL FACEIT Group (Australia) | 2000 | Cologne, Germany |
LetsPlay.Live | 2015 | Auckland, New Zealand |
Valve Corporation (Steam AU Ops) | 1996 | Bellevue, USA |
Sony Interactive Entertainment AU | 1993 | Tokyo, Japan |
Microsoft Xbox ANZ | 2001 | Redmond, USA |
Nintendo Australia | 1994 | Melbourne, Australia |
Gameloft Brisbane | 1999 | Paris, France |
Some of the Recent Competitor Trends and Key Information About Competitors Include:
PlaySide Studios: As one of Australia’s largest publicly listed game developers, PlaySide Studios reported record revenue growth in 2024, driven by the success of its self-published titles and long-term work-for-hire contracts with global publishers. The studio has expanded its live-ops capabilities, enabling ongoing monetisation of key franchises.
Halfbrick Studios: Known worldwide for mobile hits like Fruit Ninja and Jetpack Joyride, Halfbrick Studios launched remastered editions and cross-platform versions of its legacy titles in 2024. These moves boosted engagement across new player demographics while reactivating existing fan bases.
Big Ant Studios: Specialising in sports simulation games, Big Ant Studios released updated editions of popular cricket and tennis titles in 2024, leveraging official league licences. The studio has invested in enhanced motion capture and AI-based gameplay improvements to strengthen realism.
Pentanet / CloudGG: A leader in cloud gaming infrastructure, Pentanet expanded its GeForce NOW powered-by-CloudGG coverage to new Australian states in 2024. Strategic partnerships with ISPs have helped reduce latency and expand the service’s subscriber base.
ESL FACEIT Group: As a dominant esports tournament organiser, ESL Australia hosted the largest esports event in the country in 2024, featuring global-tier competitions and attracting significant sponsorship revenue. The group also introduced new amateur-to-pro pathways for local talent.
What Lies Ahead for Australia Gaming and Esports Market?
The Australia gaming & esports market is set for steady expansion through the latter half of the decade, supported by the federal Digital Games Tax Offset (DGTO), state-based rebates, nationwide NBN coverage, and the rapid densification of 5G. Continued growth in digital engagement, the creator economy, and live-service monetization will underpin revenues, while cloud delivery and cross-platform play expand access and session frequency. Esports will benefit from professionalized tournament ops, deeper brand sponsorships, and venue investments across major cities.
Rise of Hybrid Distribution & Play: The next phase is defined by “hybrid everything”, digital download + cloud streaming, console + PC + mobile cross-progression, and physical events woven into always-on digital communities. Publishers will pair premium launches with subscription access, cloud trials, and web store ownership, letting players sample instantly and convert to deeper spend. For esports, hybrid formats—studio broadcasts plus in-venue activations and creator watch-parties—will widen reach while sustaining ticketing and merch. Telco bundles and edge nodes lower the barrier to high-fidelity sessions, making hybrid the default for discovery, engagement, and retention.
Focus on Live-Ops & Player Outcomes: Outcome orientation in gaming translates to lifetime value drivers, day-1 to day-365 retention, healthier communities, and safety SLAs that keep sessions friction-free. Studios will optimise seasonal cadences, battle-pass design, and event calendars to stabilise engagement, while surfacing parental tools and age-assurance as standard. Esports operators will align formats and schedules to maximise average watch time and sponsor ROI, integrating interactive overlays, quests, and loyalty programs that convert viewers into players and purchasers without compromising trust & safety benchmarks.
Expansion of Local IP & Sports-Licensed Content: Australia’s edge is cultural resonance, sports-licensed titles (cricket, rugby, AFL) and locally authored indie IP travel well when production risk is de-risked by incentives and co-dev models. Expect a fuller pipeline of AU-rooted narratives, sports sims, and lifestyle/casual games designed for global distribution but seeded through domestic fandoms and events. Partnerships with codes, broadcasters, and retail will anchor activations around seasons and finals, creating predictable spikes for content drops, esports cups, and omni-channel merchandising.
Leveraging AI, Data, and Tooling: AI is moving from experiment to infrastructure, faster asset iteration, QA automation, matchmaking quality, and anti-cheat telemetry. On the business side, propensity models will sharpen UA bidding, churn saves, and pricing ladders across platforms. For esports, computer vision and NLP will streamline highlight clipping, personalization, and moderation at broadcast scale. Privacy-first data design—aligned to Australian regulation—will differentiate studios and TOs that can demonstrate transparent controls while still delivering tailored experiences, higher fill-rates, and tighter fraud prevention.
Australia Gaming & Esports Market Segmentation
By Platform
Console Gaming
PC Gaming
Mobile Gaming
Cloud Gaming
Extended Reality (XR)
By Revenue Stream
Premium Game Sales
In-App Purchases (IAP)
Advertising
Subscriptions
Esports Media Rights
Esports Sponsorship
Ticket Sales
Merchandise
By Genre
First-Person Shooters (FPS)
Sports
Racing
RPG / Action-Adventure
Simulation & Management
Battle Royale
Casual / Party Games
By Gamer Cohort
Casual Gamers
Mid-Core Gamers
Core Gamers
Esports Enthusiasts
Content Creators / Streamers
By Spending Tier
Non-Spenders
Light Spenders
Medium Spenders
Heavy Spenders / Whales
By Esports Tournament Type
Open Tournaments
Franchise-Based Leagues
Hybrid Formats
By Region
New South Wales
Victoria
Queensland
Western Australia –
South Australia
Tasmania
Australian Capital Territory
Northern Territory
Players Mentioned in the Report:
PlaySide Studios
Halfbrick Studios
Mighty Kingdom
Gameloft Brisbane
Pentanet / CloudGG
Big Ant Studios
Team Cherry
Blowfish Studios
Riot Games Sydney
ESL FACEIT Group (Australia)
Valve (Steam AU operations)
Sony Interactive Entertainment Australia
Microsoft Xbox ANZ
Nintendo Australia
LetsPlay.Live
Key Target Audience
Video game publishers and development studios
Platform operators and digital storefronts
Cloud gaming providers and telco partners
Esports tournament organizers and event operators
Investments and venture capitalist firms
Government and regulatory bodies (e.g., Screen Australia, state film & games bodies)
Gaming hardware and peripheral manufacturers
Advertising and sponsorship agencies focused on gaming/esports
Time Period:
Historical Period: 2019-2024
Base Year: 2025
- Forecast Period: 2025-2030
Report Coverage
Choose individual sections to purchase. Mix and match as you like.
(Publishers/platform holders, developers, esports tournament organisers, streaming platforms, retailers, telcos/ISPs, adtech & monetisation partners, payment gateways, hardware vendors, regulators, consumer communities)
4.1 Delivery Model Analysis for Gaming & Esports-Digital Download, Cloud Gaming, Physical Retail, Subscription, Free-to-Play (Discuss margins, user preference, strengths, weaknesses)
4.2 Revenue Streams for Australia Gaming & Esports Market (Premium sales, IAP, Advertising, Subscriptions, Sponsorship, Media Rights, Merchandise, Tickets)
4.3 Business Model Canvas for Australia Gaming & Esports Market (Key partners, activities, resources, value propositions, customer segments, channels, revenue streams, cost structure)
5.1 Independent Studios vs. AAA/Publisher-Owned Studios (Impacts on innovation, funding, risk)
5.2 Investment Model in Australia Gaming & Esports (Venture capital, private equity, government grants, state incentives)
5.3 Comparative Analysis of Monetisation Strategies by Local vs. International Publishers in Australia
5.4 Gaming & Esports Budget Allocation by Company Type (Indie studios, AAAs, Esports orgs, Publishers, Event Operators)
(Gap between player base growth vs. local game content output; demand for esports events vs. venue capacity; demand for cloud gaming vs. server coverage)
8.1 Revenues (Historical market size, YoY growth, market milestones)
9.1 By Market Structure (In-house development vs. outsourced/co-development)
9.2 By Platform (Mobile, Console, PC, Cloud, XR)
9.3 By Genre (FPS/Tactical, Sports, Racing, RPG/Action-Adventure, Simulation/Management, Battle Royale)
9.3.1 By Type of Sports Games (Licensed sports IP, Fantasy sports, Simulation)
9.3.2 By Type of Racing Games (Simulation, Arcade, Kart)
9.3.3 By Type of FPS (Tactical, Hero shooter, Arena)
9.3.4 By Type of RPG (Action, JRPG, MMORPG)
9.4 By Gamer Cohort (Casual, Mid-core, Core, Esports Enthusiasts, Creators)
9.5 By Spending Tier (Non-spenders, Light, Medium, Heavy/Whales)
9.6 By Mode of Play (Single-player, Multiplayer Online, Competitive Esports)
9.7 By Open & Franchise-based Esports Tournaments
9.8 By Region (NSW, VIC, QLD, WA, SA, TAS, ACT, NT)
10.1 Gamer Landscape and Cohort Analysis (Retention, LTV, churn patterns)
10.2 Gaming & Esports Purchase/Engagement Decision-Making Process
10.3 Game & Esports ROI Analysis (Lifetime player value vs. acquisition cost; event ROI)
10.4 Gap Analysis Framework (Content demand vs. availability; genre gaps; regional esports coverage gaps)
11.1 Trends and Developments (Live-ops, cross-platform, UGC ecosystems, AI tools in dev, esports monetisation evolution)
11.2 Growth Drivers (5G rollout, DGTO incentives, high engagement rates, global publisher investments)
11.3 SWOT Analysis for Australia Gaming & Esports Market
11.4 Issues and Challenges (Talent shortage, infrastructure constraints, regulation on loot boxes)
11.5 Government Regulations (Online Safety Act, Classification Board rules, state incentives)
12.1 Market Size and Future Potential for Online & Cloud Gaming Industry in Australia
12.2 Business Model and Revenue Streams (F2P, subscription, session-based pricing)
12.3 Delivery Models and Types of Games Offered (Instant play, hybrid download, streaming-only)
12.4 Cross Comparison of Leading Online & Cloud Gaming Companies (Company overview, funding, AU MAU/DAU, revenue streams, titles, latency performance, pricing, partnerships)
15.1 Market Share of Key Players (By revenue, playtime, esports audience share)
15.2 Benchmark of Key Competitors (Company overview, USP, business model, number of local staff, revenues, pricing models, technology, top games/events, major clients/partners, marketing strategy, recent developments)
15.3 Operating Model Analysis Framework (Studio structures, publishing, live-ops teams, tournament operations)
15.4 Gartner Magic Quadrant (Leader, Challenger, Niche, Visionary positioning for AU gaming/esports firms)
15.5 Bowmans Strategic Clock for Competitive Advantage (Price vs. differentiation strategies)
16.1 Revenues (Forecasts & scenario bands)
17.1 By Market Structure (In-house vs. outsourced/co-dev)
17.2 By Platform (Mobile, Console, PC, Cloud, XR)
17.3 By Genre (FPS/Tactical, Sports, Racing, RPG/Action-Adventure, Simulation/Management, Battle Royale)
17.3.1 By Type of Sports Games
17.3.2 By Type of Racing Games
17.3.3 By Type of FPS
17.3.4 By Type of RPG
17.4 By Gamer Cohort (Casual, Mid-core, Core, Enthusiasts, Creators)
17.5 By Spending Tier (Non-spenders, Light, Medium, Heavy)
17.6 By Mode of Play (Single-player, Multiplayer, Competitive Esports)
17.7 By Open & Franchise-based Esports Tournaments
17.8 By Region (NSW, VIC, QLD, WA, SA, TAS, ACT, NT)
Research Methodology
Step 1: Ecosystem Creation
We begin by mapping the Australia Gaming & Esports Market ecosystem to identify all demand-side and supply-side entities. On the supply side, this includes game developers, publishers, platform operators, esports tournament organisers, streaming platforms, cloud gaming providers, hardware/peripheral manufacturers, and payment infrastructure providers. On the demand side, we map gamer cohorts (casual, core, esports enthusiasts), content creators, advertisers, sponsors, and venue operators. Based on this ecosystem, we shortlist 5–6 leading market players—both domestic and international—operating in Australia, assessed on financial disclosures, player engagement reach, infrastructure footprint, and esports/tournament presence. Sourcing leverages industry articles, government reports, regulator data, and proprietary databases to perform desk research and compile comprehensive industry-level intelligence.
Step 2: Desk Research
An exhaustive desk research process is then undertaken, referencing secondary and proprietary databases to capture the full scope of the market. This includes data on player counts, network infrastructure metrics, tournament participation volumes, and hardware adoption. We assess financial reports, press releases, and annual statements from major developers, publishers, platform holders, and esports operators. Particular focus is given to the distribution of gamer cohorts, digital engagement patterns, pricing frameworks (microtransactions, subscriptions, premium sales), and revenue streams from esports events, sponsorship, and media rights. This creates a foundational dataset covering both the macro environment and company-level performance, enabling accurate segmentation and competitive benchmarking.
Step 3: Primary Research
We conduct in-depth interviews with C-level executives, esports organisers, studio leads, platform managers, and government agency representatives involved in Australia’s gaming and esports industry. These interviews validate hypotheses formed during desk research, confirm statistical inputs, and provide operational and strategic insights from industry insiders. A bottom-up approach is used to aggregate revenue contributions, player engagement metrics, and operational KPIs for each shortlisted company, building to the overall market view. As part of our validation process, we carry out disguised interviews posing as potential clients to validate operational data, esports event metrics, server/latency performance statistics, monetisation models, and pricing structures. Insights gathered inform value chain mapping, revenue breakdowns, and growth driver analysis.
Step 4: Sanity Check
We perform both bottom-up and top-down market size modelling exercises to ensure accuracy and consistency of findings. The bottom-up model aggregates individual player/company contributions and usage statistics, while the top-down approach reconciles these figures with macro-level indicators such as broadband penetration, mobile adoption, and transaction volumes from regulatory data. This dual approach ensures that our market estimates are both robust and fully aligned with real-world infrastructure capacity, gamer activity levels, and ecosystem monetisation flows.
FAQs
01 What is the potential for the Australia Gaming & Esports Market?
The Australia Gaming & Esports Market is positioned for robust expansion, with consumer spending on games reaching approximately AUD 4.4 billion in 2023 and local game developer revenue at AUD 345 million. Growth is driven by a rising gamer population, improved broadband and 5G coverage, and strong government incentives such as the Digital Games Tax Offset. The market’s potential is further reinforced by Australia’s thriving creative sector, esports event scene, and the increasing integration of gaming into mainstream entertainment and sports culture.
02 Who are the Key Players in the Australia Gaming & Esports Market?
The market features a blend of domestic studios and global publishers. Key local players include PlaySide Studios, Big Ant Studios, Halfbrick Studios, Mighty Kingdom, and Team Cherry—known for their internationally successful IPs and strong development pipelines. International stakeholders such as Riot Games Sydney, ESL FACEIT Group, Sony Interactive Entertainment Australia, Microsoft Xbox ANZ, and Nintendo Australia dominate platform, tournament, and publishing segments. Their combined strengths in IP ownership, distribution networks, and event infrastructure give them a competitive advantage in capturing both player engagement and monetisation.
03 What are the Growth Drivers for the Australia Gaming & Esports Market?
Key growth drivers include national infrastructure upgrades—8.7 million NBN services in operation and over 5,000 active 5G sites—as well as a highly engaged gaming population across console, PC, and mobile platforms. The Digital Games Tax Offset and state-level rebates incentivise both domestic and foreign studios to establish production in Australia. The esports sector benefits from growing brand sponsorship, live event attendance, and streaming viewership. Additionally, global cross-platform and cloud gaming trends are expanding the accessible market, boosting player acquisition and engagement.
04 What are the Challenges in the Australia Gaming & Esports Market?
Challenges include talent scarcity in specialised game development, live-ops management, and esports production roles, as Australia competes globally for experienced professionals. Regulatory compliance, particularly around the Online Safety Act, eSafety Codes, and Australian Classification Board rules on loot boxes and gambling simulation, adds operational complexity for publishers and event organisers. Payments friction, including cross-border settlement and age verification requirements, can impact transaction conversion. Finally, limited local venture capital activity in gaming means studios often rely on offshore funding, which can slow scaling compared to overseas peers.