Australia Medical Devices Market Outlook to 2030
By Device Category (Diagnostic Imaging Systems, Therapeutic & Surgical Devices, Implantable Devices, Consumables & Disposables, In-Vitro Diagnostics, Digital Health Devices & SaMD), By Therapeutic Area (Cardiology, Orthopedics & Spine, ENT & Audiology
- Product Code: TDR0224
- Region: Asia
- Published on: August 2025
- Total Pages: 80
Report Summary
The report titled “Australia Medical Devices Market Outlook to 2030 – By Device Category (Diagnostic Imaging Systems, Therapeutic & Surgical Devices, Implantable Devices, Consumables & Disposables, In-Vitro Diagnostics, Digital Health Devices & SaMD), By Therapeutic Area (Cardiology, Orthopedics & Spine, ENT & Audiology, Respiratory & Sleep Care, Neurology, General Surgery, Women’s Health, Urology, Ophthalmology, Wound Care), By End User (Public Hospitals, Private Hospitals, Day-Surgery Centers, Diagnostic Imaging Centers, Pathology & Clinical Laboratories, Primary Care/GP Clinics, Home-Care Settings), By Risk Class, By Distribution Channel, and By State/Region” provides a comprehensive analysis of the medical devices market in Australia. The report covers an overview and genesis of the industry, overall market size in terms of revenue, market segmentation; trends and developments, regulatory landscape, customer level profiling, issues and challenges, and competitive landscape including competition scenario, cross-comparison, opportunities and bottlenecks, and company profiling of major players in the medical devices market. The report concludes with future market projections based on device adoption volumes, product categories, therapeutic areas, regions, cause-and-effect relationships, and success case studies highlighting the major opportunities and cautions.
Australia Medical Devices Market Overview and Size
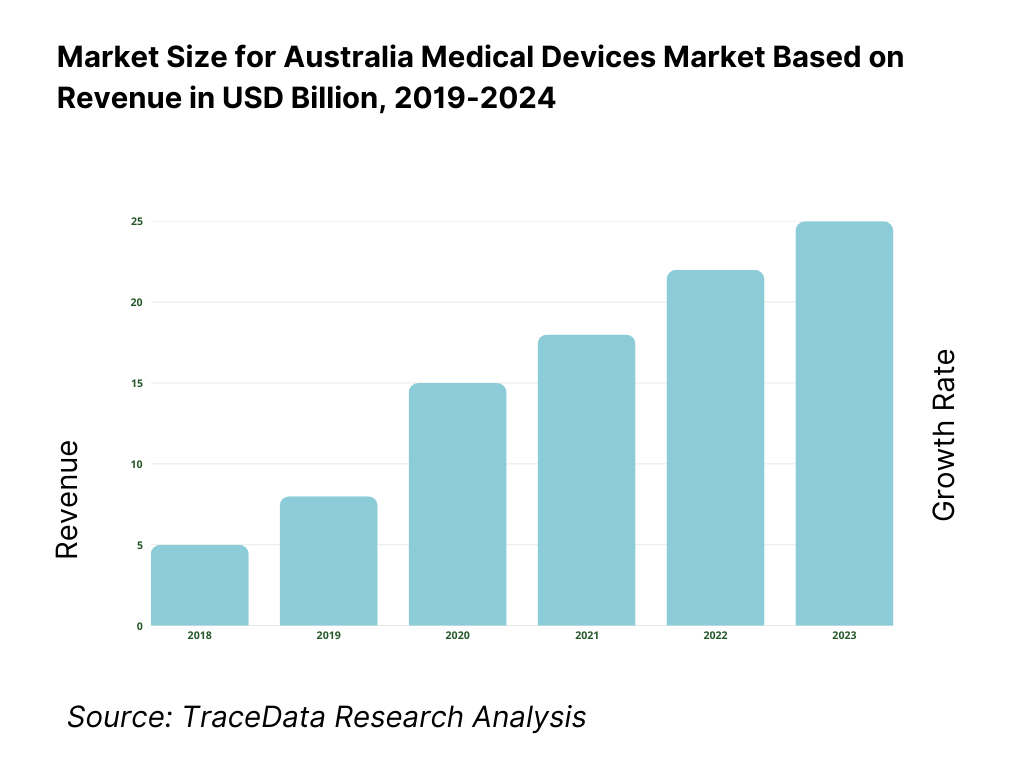
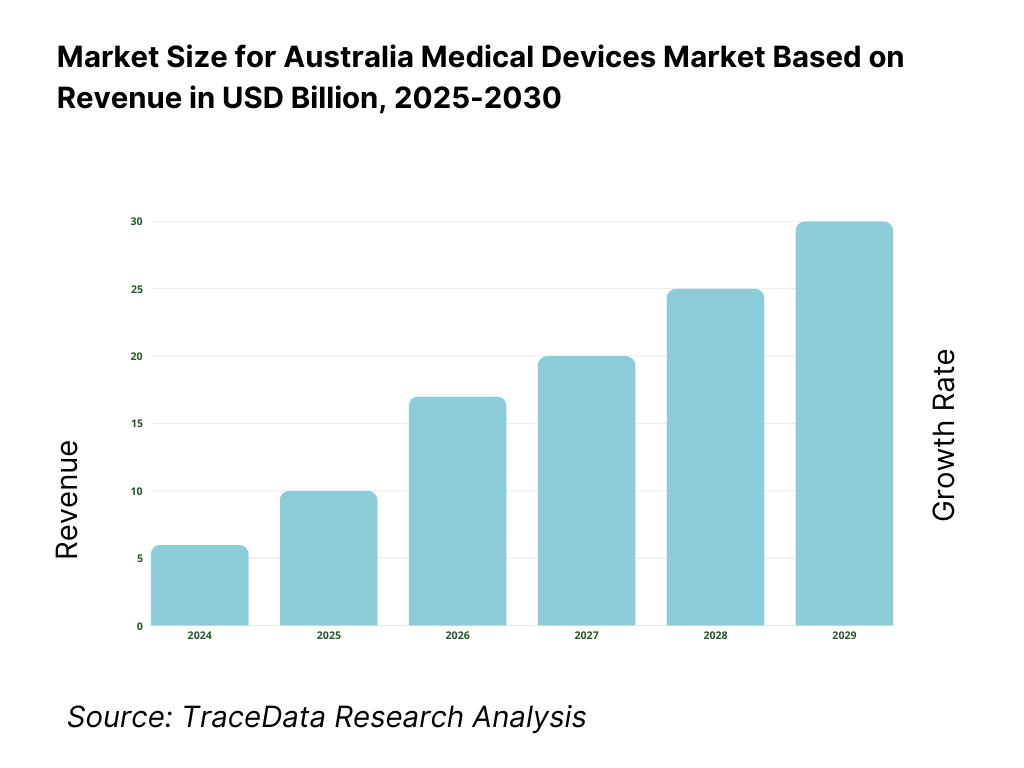
The Australia medical devices market is valued at USD 858.2 million for portable medical devices in 2024, underscoring a robust niche within the broader market. The market’s growth is fueled by rising demand for home-based monitoring solutions, adoption of smart wearable technologies, and an expanding focus on outpatient care—factors that are also reshaping the overall medical devices landscape. Meanwhile, the contract research organization (CRO) segment of the Australian medical device ecosystem generated USD 375.4 million in 2024, signaling significant activity in development and clinical validation services.
Major urban centres such as Sydney, Melbourne, Brisbane, and regional hubs like Perth dominate due to dense healthcare infrastructure, concentration of tertiary hospitals, and high adoption of innovative technologies. Additionally, Melbourne’s strong medtech manufacturing cluster and Sydney’s access to contract research and testing services make them epicentres of market activity. These cities offer favourable clinician networks, university–industry collaborations, and logistics efficiencies, reinforcing their leadership roles—especially supported by growing exports and advanced clinical trial ecosystems.
What Factors are Leading to the Growth of the Australia Medical Devices Market:
Surgical procedure volumes: Australia’s health system is performing a very large volume of hospital care that directly pulls through demand for surgical and interventional devices. There were 12,600,000 hospitalisations, with procedures and interventions rising from 26,800,000 to 27,700,000 over the most recent reporting window, indicating sustained throughput across operating theatres and day-procedure units. A larger population base underpins this activity: Australia’s estimated resident population is 27,400,013 and continues to expand via net overseas migration, keeping case volumes high in metropolitan hospitals and regional hubs alike. This combination of high inpatient activity and a growing population base sustains recurring demand for implants, surgical instruments, anaesthesia/OR equipment and consumables.
Oncology & cardiology incidence: Chronic disease epidemiology is a powerful utilisation driver across oncology and cardiology technologies. Australia recorded about 165,000 newly diagnosed cancer cases and around 169,500 expected in the following cycle, supporting steady demand for radiation therapy hardware, infusion systems, biopsy devices and digital pathology tools. Cardiovascular care remains procedure-intensive: hospitals performed 132,000 coronary angiography procedures, and state data show 160,902 cardiovascular hospitalisations in NSW alone, reaffirming high use of stents, catheters, valves, mapping/ablation systems and monitoring devices. Macro conditions amplify this need: Australia’s population stands at 27,400,013, with a rising share in older age brackets most likely to require oncologic and cardiac interventions.
Diagnostic imaging demand: Imaging is a front-end gatekeeper for device-enabled care pathways. In a single year, over 10,000,000 Australians received more than 27,000,000 Medicare-subsidised diagnostic imaging services, spanning ultrasound, CT, MRI and nuclear medicine. Recent AIHW tracking shows utilisation at ~99–110 services per 100 people across local areas, signalling broad penetration of imaging into preventive and acute care. Australia’s macro base of 27,204,809–27,400,013 people ensures high absolute scan counts, and imaging’s role in oncology staging and cardiology workups ties volumes directly to device demand in downstream therapy.
Which Industry Challenges Have Impacted the Growth of the Australia Medical Devices Market:
TGA conformity costs (workload & evidentiary burden): Regulatory workload—rather than price points—illustrates the compliance weight facing manufacturers and sponsors. In the last full year, the TGA handled 96 new conformity-assessment applications (with 204 completions including variations), maintained 100% on-time completion within legislated 255 working-day limits, and processed incident-report volumes rising to 9,917 device incident reports. Post-market oversight remained intensive with 1,300 post-market reviews completed and 4,310 reviews on hand. Sponsors also sought 116 Consents-to-Supply for non-compliant devices covering 696 ARTG entries. These counts translate into substantial documentation, clinical evidence and quality-system maintenance requirements for market access and continuity. Australia’s GDP scale—around USD 1.77 trillion—and population of ~27.2–27.4 million provide commercial incentives to carry this evidentiary burden, but the process load remains material.
Price-erosion in tenders (centralised procurement dynamics): Public procurement concentration can compress margins by aggregating volume across broad supplier panels. In Victoria, the Auditor-General reported 1,086 supplier agreements across 72 collective agreements in place as at June, spanning 5 categories including clinical products and medical equipment, evidencing strong panelisation and frequent multi-bid environments. In NSW, HealthShare NSW is the central point for goods and services tendering and contracting for the health system, and its supply chain manages 3,000,000 distinct medical and surgical consumables—scale that encourages standardisation and high competition among device suppliers. At the Commonwealth level, contract statistics show the majority of awards go to local addresses by volume, reinforcing deep pools of competing vendors. These structural realities heighten competitive tension in bids and price negotiations for many device categories.
Prostheses List reforms (private-sector utilisation shift): Reforms to the private-sector implants schedule—now the Prescribed List—are reshaping benefit rules and product categorisation. The Department’s guidance confirms the List’s ongoing role and regular publication, while a specific reform stream addressed 475 “general use items” (Part D), whose planned removal was paused—signalling active policy recalibration. Parallel utilisation remains strong: APRA recorded 4,960,312 private hospital treatment episodes to March, underscoring continuing reliance on prostheses in insured care. These structural and utilisation factors require sponsors to re-evaluate coding, listings and hospital contracts as List architecture evolves, while ensuring ARTG inclusion is satisfied before List applications. Australia’s 27.2–27.4 million population base underpins these high episode counts in private hospitals.
What are the Regulations and Initiatives which have Governed the Market:
TGA Essential Principles: The Essential Principles (set out in Schedule 1 of the Therapeutic Goods (Medical Devices) Regulations 2002) require objective scientific and clinical evidence that a device’s benefits outweigh risks, and that design, construction, long-term safety, labelling and IFU obligations are met across the lifecycle. The TGA provides an Essential Principles checklist to structure evidence collation and traceability, and emphasises three pillars—safety-by-design, state-of-the-art solutions, and positive benefit–risk—while making non-compliance an offence under the Therapeutic Goods Act. For sponsors scaling into a national population of ~27.2–27.4 million, rigorous alignment with these principles is foundational to maintaining supply and hospital adoption.
ARTG pathways: Market entry hinges on ARTG inclusion by risk class, with substantial application volumes evidencing throughput: in the latest year, the TGA processed 2,142 Class I completions, 1,223 Class IIa, 608 Class IIb, and 468 Class III, alongside IVD classes (for example 151 Class 3 IVD completions). Device Change Requests numbered 792 and ARTG variations for Class III devices 77. Application-audit metrics show median TGA days as low as 2 for unaudited Class I and 16 for non-Class I without audit, indicating predictable timelines once evidence is in order. For a country with GDP of roughly USD 1.77 trillion, these pathway statistics reflect a mature, high-volume market with disciplined regulatory cadence.
Conformity assessment (MDSAP/CE/FDA reliance): Australia operationalises reliance and harmonisation to streamline evidence acceptance. The TGA recognises certification from comparable overseas regulators and operates under an AUS–UK Mutual Recognition Agreement, while engaging internationally “alongside 11 other medical device regulators.” Domestically, quality-system scrutiny remained active with 32 QMS audits of Australian manufacturers and further 42 audits of overseas manufacturers (desktop and onsite/remote combined). MDSAP participation with major regulators (including the US FDA) provides a single audit framework accepted by participating authorities, reducing duplicative oversight for manufacturers supplying a national population now at ~27.4 million.
Australia Agricultural Equipment Market Segmentation
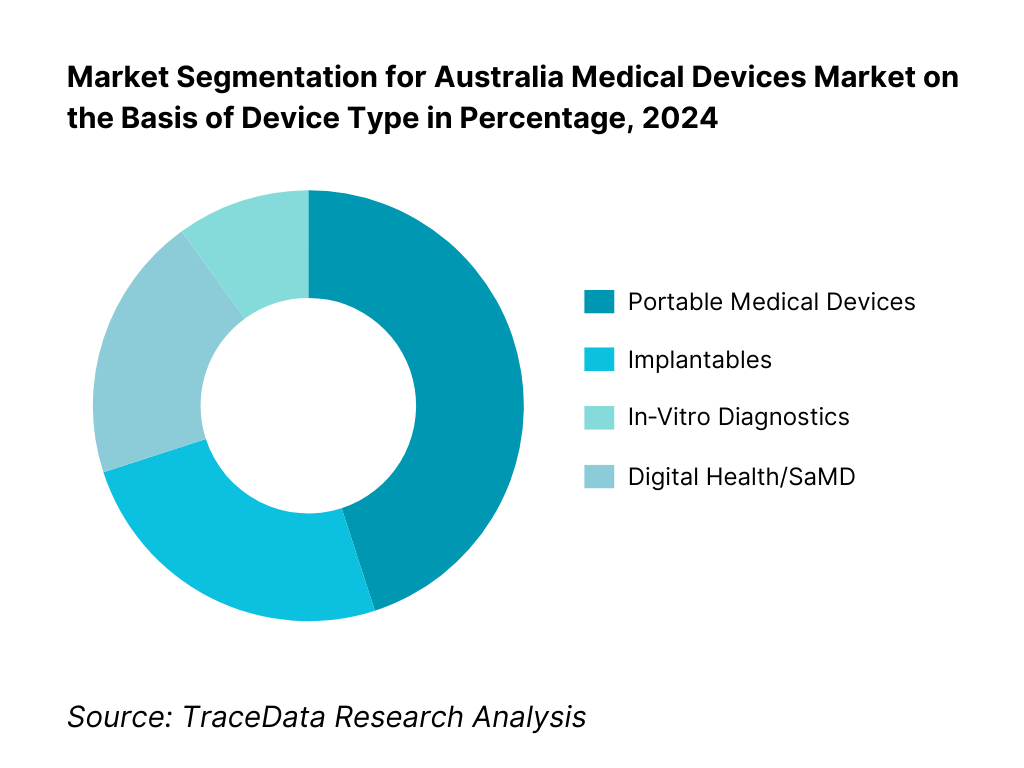
By Device Type: The portable medical devices dominate the market. This segment’s leadership is driven by increasing demand for point‑of‑care monitoring, especially for chronic conditions like respiratory, cardiac, and diabetes management; the convenience of at-home diagnostics; and supportive reimbursements for remote care. The COVID‑19 pandemic accelerated adoption of wearable and portable systems, sustaining momentum into 2023. Established players continuously innovate with compact, user‑friendly, and connected devices, further entrenching their market position. Infrastructure for telehealth and home‑based services is well‑developed in Australia, boosting both clinician and patient acceptance. Meanwhile, implantables and IVDs remain significant but less dominant due to higher cost, stringent regulatory pathways, and longer procurement cycles. Digital Health/SaMD is emerging fast but still maturing within the healthcare ecosystem.
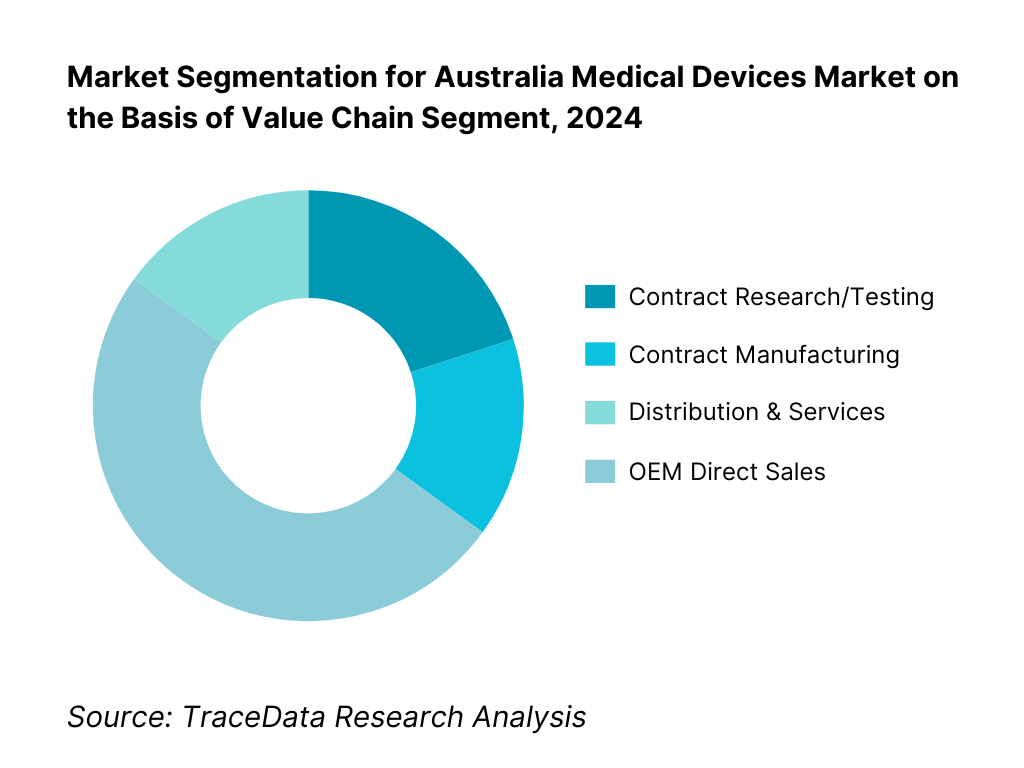
By Value Chain Segment: The distribution & services hold the largest share driven by the fragmented geography and heavy reliance on robust servicing networks for repair, calibration, and consumable support. Australia’s dispersed population requires reliable regional distributors who can ensure uptime and deliver tailored service agreements, driving this segment’s predominance. Contract research/testing is supported by Australia’s strong clinical trial infrastructure and experienced CRO sector. Contract manufacturing takes 15 %, reflecting a growing trend of outsourcing production to local specialists for class I–III devices, as evidenced by increasing contract manufacturing revenues. OEM direct sales also stand at 15 %, typical for high-worth capital equipment where manufacturers engage directly with tier-1 hospitals.
Competitive Landscape in Australia Medical Devices Market
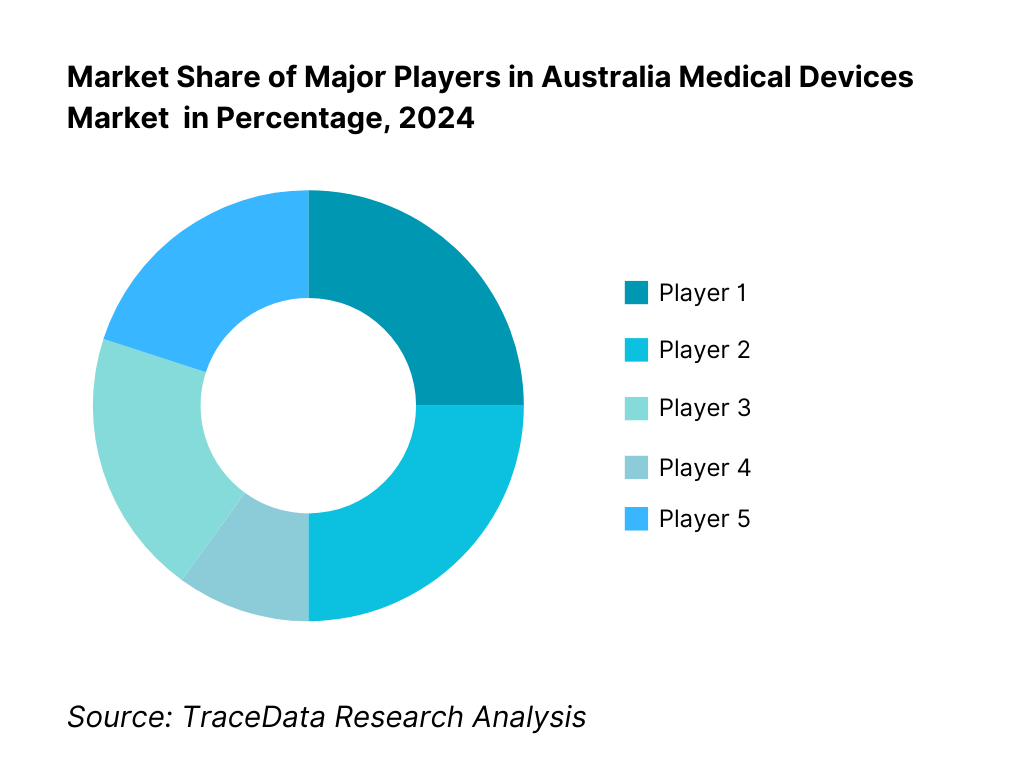
The Australia medical devices market is characterized by established global leaders such as Medtronic, Johnson & Johnson MedTech, Abbott, and Siemens Healthineers, alongside specialized domestic champions like Cochlear and Fisher & Paykel. This consolidation reflects strong capabilities in innovation, clinical evidence generation, and deep service networks that empower these firms to secure largescale implementations across both public and private sectors.
Name | Founding Year | Original Headquarters |
Medtronic Australasia | 1949 | Sydney, Australia |
Johnson & Johnson MedTech ANZ | 1886 | Melbourne, Australia |
Abbott Laboratories Australia | 1888 | Sydney, Australia |
Boston Scientific ANZ | 1979 | Marlborough, USA |
Stryker Australia | 1941 | Kalamazoo, USA |
Becton Dickinson (BD) Australia | 1897 | Franklin Lakes, USA |
Siemens Healthineers ANZ | 1847 | Erlangen, Germany |
GE HealthCare ANZ | 1892 | Chicago, USA |
Philips Healthcare ANZ | 1891 | Amsterdam, Netherlands |
ResMed | 1989 | San Diego, USA |
Cochlear | 1981 | Sydney, Australia |
Nanosonics | 2001 | Sydney, Australia |
Fisher & Paykel Healthcare | 1934 | Auckland, New Zealand |
Hologic Australia | 1985 | Marlborough, USA |
Olympus Australia | 1919 | Tokyo, Japan |
Some of the Recent Competitor Trends and Key Information About Competitors Include:
Medtronic Australasia: Expanded its cardiac rhythm management and neuromodulation portfolio in 2024 with TGA-approved next-generation implantable devices, while increasing investment in local clinical trials for minimally invasive heart valve technologies.
Cochlear: Launched its latest Nucleus implant sound processor in 2024 with enhanced connectivity features, targeting both adult and pediatric segments, and strengthened partnerships with Australian hearing health networks for faster patient access.
ResMed: Reported growth in its cloud-connected CPAP and ventilator devices in 2024, driven by rising sleep apnea diagnosis rates and telemonitoring adoption, alongside expansion of its digital health platform integrations.
Siemens Healthineers ANZ: Introduced AI-driven imaging and diagnostic platforms to major public hospitals in 2024, focusing on workflow efficiency and predictive diagnostics; also invested in service network expansion across regional Australia.
Nanosonics: Recorded increased adoption of its trophon®2 ultrasound probe disinfection system in 2024 due to stricter infection control standards, and announced R&D initiatives in broader infection prevention device categories.
What Lies Ahead for Australia Medical Devices Market
The Australia medical devices market is set for steady expansion through the forecast horizon, supported by an ageing population, rising chronic disease prevalence, and ongoing capital investment by public and private hospital networks. Continued adoption of home-based and ambulatory care, along with supportive reimbursement for clinically proven technologies, will sustain device utilization across imaging, implantables, surgical tools, diagnostics, and connected monitoring. Local manufacturing incentives and supply-chain resilience programs should further catalyze technology transfer and assembly activity, while registry-driven evidence and clinician networks accelerate diffusion of best-in-class devices.
Rise of Hybrid Care Models: Care delivery is shifting toward hybrid pathways that blend hospital, ambulatory, and at-home settings. Remote patient monitoring, telehealth-enabled peripherals, and portable diagnostics are becoming embedded in chronic care and peri-operative programs, reducing readmissions and enabling earlier discharge. For suppliers, this favors device designs that are compact, interoperable, and serviceable outside acute hospitals, as well as commercial models such as managed equipment services, pay-per-use, and subscription bundles that link hardware, software, and clinical support.
Focus on Outcome-Based Procurement: Hospitals and payers are tightening alignment between procurement and patient outcomes. Value-based contracts, device registries, and patient-reported outcome measures are increasingly integral to adoption decisions—shifting the emphasis from upfront price to total cost of care, complication avoidance, and throughput gains. Suppliers that pair robust clinical/economic evidence with training, pathway redesign, and analytics will be better positioned to win tenders and renewals, particularly in procedure-intensive specialties such as cardiology, orthopedics, oncology, and interventional pulmonology.
Expansion of Therapeutic-Area–Specific Solutions: Demand is concentrating around high-burden therapeutic areas where devices can meaningfully change outcomes and workflows: cardiovascular (structural heart, electrophysiology, PCI), musculoskeletal (joint, trauma, spine), oncology (biopsy, surgical navigation, radiotherapy planning), respiratory and sleep (ventilation, CPAP, airway management), and women’s health (minimally invasive gynecology, breast imaging/biopsy). Companies that deliver end-to-end ecosystems—implants, instruments, imaging/navigation, consumables, and post-acute support—will gain share by simplifying adoption and standardizing care pathways across multi-site hospital groups.
Leveraging AI and Analytics: AI/ML is moving from pilots to production use across imaging triage, segmentation, dose optimization, cath-lab mapping, and quality assurance in sterilization and reprocessing. Software as a Medical Device (SaMD) and analytics layers are increasingly bundled with hardware to unlock workflow gains, reduce variability, and document outcomes for HTA and tender renewal. Interoperability, cybersecurity, and UDI-enabled data integrity will be decisive differentiators, as providers prefer solutions that plug into existing EMR/PACS ecosystems and support continuous performance monitoring.
Australia Medical Devices Market Segmentation
By Device Category
Diagnostic Imaging Systems
Therapeutic & Surgical Devices
Implantable Devices
Consumables & Disposables
In-Vitro Diagnostics (IVD)
Digital Health Devices & SaMD
By Therapeutic Area
Cardiology
Orthopedics & Spine
ENT & Audiology
Respiratory & Sleep Care
Neurology
General Surgery
Women’s Health
Urology
Ophthalmology
Wound Care
By End User
Public Hospitals
Private Hospitals
Day-Surgery Centers
Diagnostic Imaging Centers
Pathology & Clinical Laboratories
Primary Care / GP Clinics
Home-Care Settings
By Distribution Channel
Direct Sales (OEM-led)
National Distributors
Specialty Distributors
E-commerce & Home Delivery Platforms
Group Purchasing Organisations (GPOs)
By State/Region
New South Wales (NSW)
Victoria (VIC)
Queensland (QLD)
Western Australia (WA)
South Australia (SA)
Tasmania (TAS)
Australian Capital Territory (ACT)
Northern Territory (NT)
Players Mentioned in the Report:
Medtronic Australasia
Johnson & Johnson MedTech ANZ
Abbott Laboratories Australia
Boston Scientific ANZ
Stryker Australia
Becton Dickinson (BD) Australia
Siemens Healthineers ANZ
GE HealthCare ANZ
Philips Healthcare ANZ
ResMed
Cochlear
Nanosonics
Fisher & Paykel Healthcare
Hologic Australia
Olympus Australia
Key Target Audience
Hospital procurement executives (public health networks)
Hospital procurement executives (private hospital chains)
State health departments (e.g., HealthShare NSW, Health Purchasing Victoria)
Federal regulatory and funding agencies (e.g., Department of Health, MRFF)
Medical device OEMs considering entry or expansion in Australia
Distribution and service organisations in medical technology
Investments and venture capitalist firms (medtech focus)
Government and regulatory bodies
Time Period:
Historical Period: 2019-2024
Base Year: 2025
- Forecast Period: 2025-2030
Report Coverage
Choose individual sections to purchase. Mix and match as you like.
[OEMs, distributors, TGA, MSAC, PHI funds, hospital procurement agencies, clinical societies, research institutes, MTPConnect]
4.1. Delivery Model Analysis for Medical Devices-Direct Sales, Distributor-Led, Managed Service/PPU, E-commerce, Consignment [margins, preference, strengths, weaknesses]
4.2. Revenue Streams for Australia Medical Devices Market [capital sales, consumables, service contracts, software subscriptions, leasing/rental, managed equipment services]
4.3. Business Model Canvas for Australia Medical Devices Market [key partners, activities, value propositions, customer segments, cost structure, revenue streams]
5.1. Local Manufacturers vs. Import-Dependent Supply [share, capabilities, resilience]
5.2. Investment Model in Australia Medical Devices Market [public capex, private equity, venture, state grants, MRFF funding]
5.3. Comparative Analysis of Public vs. Private Hospital Procurement Processes [tender cycles, evaluation criteria, clinical trials for adoption]
5.4. Device Budget Allocation by Hospital Size and Type [public tertiary, private groups, day surgery centers]
[Regulatory stability, reimbursement environment, competitive intensity, technology readiness, demand growth, capital availability]
[installed base age, unmet clinical needs, waiting list backlogs, regional disparities in access]
8.1. Revenues, Historical and Current (AUD Bn) [2019-2024]
9.1. By Market Structure (Domestic Manufacture vs. Imports), 2023-2024P
9.2. By Device Category (Diagnostic Imaging, Therapeutic & Surgical, Implantables, Consumables, IVD, Digital Health/SaMD), 2023-2024P
9.3. By Therapeutic Area (Cardiology, Orthopedics, ENT/Audiology, Respiratory & Sleep, Neurology, General Surgery, Wound Care), 2023-2024P
9.3.1. By Type of Cardiology Devices (Stents, Pacemakers, TAVR, Diagnostics), 2023-2024P
9.3.2. By Type of Orthopedic Devices (Joint Implants, Trauma, Spine, Sports Medicine), 2023-2024P
9.3.3. By Type of IVD (Clinical Chemistry, Immunoassays, Molecular Diagnostics, Point-of-Care), 2023-2024P
9.3.4. By Type of Digital Health Devices (Wearables, Remote Monitoring, Diagnostic AI, Telehealth Peripherals), 2023-2024P
9.4. By End User (Public Hospitals, Private Hospitals, Day Surgery Centers, Diagnostic Imaging Centers, Pathology Labs, Primary Care/GP Clinics, Home-Care), 2023-2024P
9.5. By Risk Class (Class I-III, AIMD, IVD classes), 2023-2024P
9.6. By Distribution Channel (Direct Sales, National Distributors, Specialty Distributors, E-commerce, Group Purchasing), 2023-2024P
9.7. By Care Setting (Acute Inpatient, Ambulatory, Community, Home-Based, Virtual Care), 2023-2024P
9.8. By Region (NSW, VIC, QLD, WA, SA, TAS, ACT, NT), 2023-2024P
10.1. Hospital and Clinic Landscape & Cohort Analysis [bed capacity, procedural volumes, technology adoption tiers]
10.2. Device Adoption Needs and Decision-Making Process [procurement committees, clinical evidence review, cost-benefit evaluation]
10.3. Clinical & Economic Effectiveness and ROI Analysis [patient outcomes, hospital throughput, cost offsets]
10.4. Gap Analysis Framework [technology penetration vs. clinical demand, region-specific needs]
11.1. Trends and Developments [miniaturization, robotics, AI in diagnostics, UDI rollout, ESG commitments]
11.2. Growth Drivers [ageing population, chronic disease burden, technological innovation, public-private partnerships]
11.3. SWOT Analysis [strengths in innovation, weaknesses in local manufacturing, opportunities in home-care, threats from regulatory changes]
11.4. Issues and Challenges [TGA compliance costs, procurement price pressures, workforce shortages]
11.5. Government Regulations [TGA Essential Principles, ARTG registration, Prostheses List reforms, MSAC HTA processes]
12.1. Market Size and Future Potential for Digital Medical Devices in Australia, 2019-2030
12.2. Business Model and Revenue Streams [device + SaaS bundles, subscription monitoring, pay-per-use]
12.3. Delivery Models and Key Application Areas [home monitoring, telehealth peripherals, AI-enabled diagnostics]
12.4. Cross Comparison of Leading Digital Device Companies [company overview, local incorporation, revenues, installed base, product portfolio, funding, pricing models, regulatory approvals]
15.1. Market Share of Key Players in Australia Medical Devices Market Basis Revenues, 2024
15.2. Benchmark of Key Competitors [company overview, USP, business strategies, product portfolio, ARTG listings, Prostheses List items, revenues, pricing by category, technology used, best-selling devices, major clients, strategic tie-ups, marketing strategy, recent developments]
15.3. Operating Model Analysis Framework [direct vs. distributor-led, consignment levels, service coverage]
15.4. Gartner Magic Quadrant Equivalent [technology leadership vs. execution capability]
15.5. Bowmans Strategic Clock for Competitive Advantage
16.1. Revenues, 2025-2030
17.1. By Market Structure (Domestic Manufacture vs. Imports), 2025-2030
17.2. By Device Category, 2025-2030
17.3. By Therapeutic Area, 2025-2030
17.3.1. By Type of Cardiology Devices, 2025-2030
17.3.2. By Type of Orthopedic Devices, 2025-2030
17.3.3. By Type of IVD, 2025-2030
17.3.4. By Type of Digital Health Devices, 2025-2030
17.4. By End User, 2025-2030
17.5. By Risk Class, 2025-2030
17.6. By Distribution Channel, 2025-2030
17.7. By Care Setting, 2025-2030
17.8. By Region, 2025-2030
Research Methodology
Step 1: Ecosystem Creation
Map the ecosystem and identify all the demand-side and supply-side entities for the Australia Medical Devices Market. On the demand side, this includes public hospitals, private hospital groups, day surgery centers, diagnostic imaging networks, pathology labs, home-care providers, and government procurement bodies (e.g., HealthShare NSW, Health Purchasing Victoria). On the supply side, this covers OEMs, local manufacturers, contract manufacturers, distributors, regulatory bodies (TGA, MSAC), and logistics partners. Based on this mapping, we shortlist 5–6 leading device suppliers in Australia using parameters such as ARTG listings, installed base, state procurement contracts, financial performance, and geographic service coverage. Sourcing leverages government procurement records, OEM/distributor disclosures, annual reports, and trusted medical industry publications to compile market-level intelligence.
Step 2: Desk Research
An exhaustive secondary research process is carried out using TGA databases, hospital procurement portals, industry associations (e.g., MTAA), and proprietary medtech market databases. This enables a detailed analysis of industry revenues, device category penetration, procurement cycles, reimbursement structures, and regulatory timelines. Company-level analysis is conducted through examination of press releases, annual reports, ARTG records, and device recall/alert notices. Special focus is given to metrics such as installed base per modality, service network size, product portfolio breadth, and local manufacturing footprint to establish a strong foundation for competitive and market structure insights.
Step 3: Primary Research
We conduct structured interviews with C-level executives, product managers, and regulatory affairs leads from OEMs, distributors, and service providers active in Australia. Hospital procurement managers, biomedical engineers, and clinicians are also interviewed to validate buying criteria, operational challenges, and device performance perceptions. This primary work validates secondary data, clarifies regulatory compliance impacts, and provides bottom-up revenue attribution by player and category. As part of validation, our team also engages in disguised client inquiries with device suppliers to confirm tender pricing structures, delivery SLAs, warranty/servicing agreements, and device configuration options—cross-checking all such findings with procurement records and ARTG documentation.
Step 4: Sanity Check
A dual bottom-up and top-down sizing exercise is conducted. Bottom-up estimates aggregate category-level revenues from player-level data, procedure volumes, and device utilisation rates. Top-down validation references public health expenditure, capital investment trends, and import/export values by HS codes from ABS trade statistics. Any gaps are reconciled through further interviews or targeted secondary searches, ensuring the final market model is both statistically robust and aligned with real-world operational and regulatory conditions in the Australia Medical Devices Market.
FAQs
01 What is the potential for the Australia Medical Devices Market?
The Australia Medical Devices Market shows strong upside driven by an ageing population, high procedure volumes in public and private hospitals, and rapid adoption of minimally invasive and digitally connected technologies. Robust reimbursement frameworks (MBS/Prostheses List), active health infrastructure investment, and a clinically engaged ecosystem of registries and key opinion leaders support steady device utilisation. Australia also hosts globally respected medtech innovators—particularly in hearing, respiratory, infection prevention, and imaging—which amplifies export potential across Asia–Pacific. Together, these factors position the market for durable, innovation-led growth across implantables, diagnostics, surgical technologies, and home-based care.
02 Who are the Key Players in the Australia Medical Devices Market?
The market features a blend of global leaders and home-grown champions with deep clinical and service footprints. Key participants include Medtronic, Johnson & Johnson MedTech (Ethicon/DePuy Synthes), Abbott, Boston Scientific, Stryker, Becton Dickinson (BD), Siemens Healthineers, GE HealthCare, and Philips. Australia-based innovators such as Cochlear, ResMed, and Nanosonics anchor world-class capabilities in hearing implants, sleep/respiratory care, and infection prevention. Other notable players include Fisher & Paykel Healthcare, Hologic, and Olympus, collectively shaping competitive dynamics across operating theatres, catheter labs, imaging suites, pathology, and out-of-hospital care.
03 What are the Growth Drivers for the Australia Medical Devices Market?
Growth is propelled by sustained surgical and interventional workloads, rising chronic disease burden (cardiovascular, oncology, respiratory), and an accelerated shift toward minimally invasive and ambulatory care. Hospitals are modernising imaging and theatre ecosystems, while home-based and virtual care pathways expand demand for portable monitoring, connected devices, and diagnostics. National procurement and reimbursement frameworks reward clinically proven innovations, and strong university–hospital–industry linkages foster clinical evidence generation. Local manufacturing incentives and supply-chain resilience programs add momentum, supporting both domestic adoption and export-oriented production across priority therapeutic areas.
04 What are the Challenges in the Australia Medical Devices Market?
Manufacturers and sponsors face rigorous regulatory and evidence requirements under TGA/ARTG pathways, alongside evolving HTA expectations for clinical and economic value. Centralised, high-volume tenders in public systems compress pricing and raise service-level commitments, while Prostheses List reforms require continual portfolio and coding optimisation for private hospital usage. Geographic dispersion increases logistics, service, and loan-kit complexity outside major metros. Workforce constraints in theatres, sterilisation services, and biomedical engineering can limit throughput and adoption speed, placing a premium on training, uptime guarantees, and integrated service models.