Australia Spectrophotometers Market Outlook to 2030
By Technology, By Application, By End-User, By Form Factor/Throughput, By Sales Channel, and By Region
- Product Code: TDR0227
- Region: Asia
- Published on: August 2025
- Total Pages: 80
Report Summary
The report titled “Australia Spectrophotometers Market Outlook to 2030 – By Technology, By Application, By End-User, By Form Factor/Throughput, By Sales Channel, and By Region” provides a comprehensive analysis of the spectrophotometers market in Australia. The report covers an overview and genesis of the industry, overall market size in terms of revenue, market segmentation; trends and developments, regulatory landscape, customer level profiling, issues and challenges, and competitive landscape including competition scenario, cross-comparison, opportunities and bottlenecks, and company profiling of major players in the spectrophotometers market. The report concludes with future market projections based on unit shipments, installed-base replacement cycles, technology mix, regions, cause-and-effect relationships, and success case studies highlighting the major opportunities and cautions.
Australia Spectrophotometers Market Overview and Size
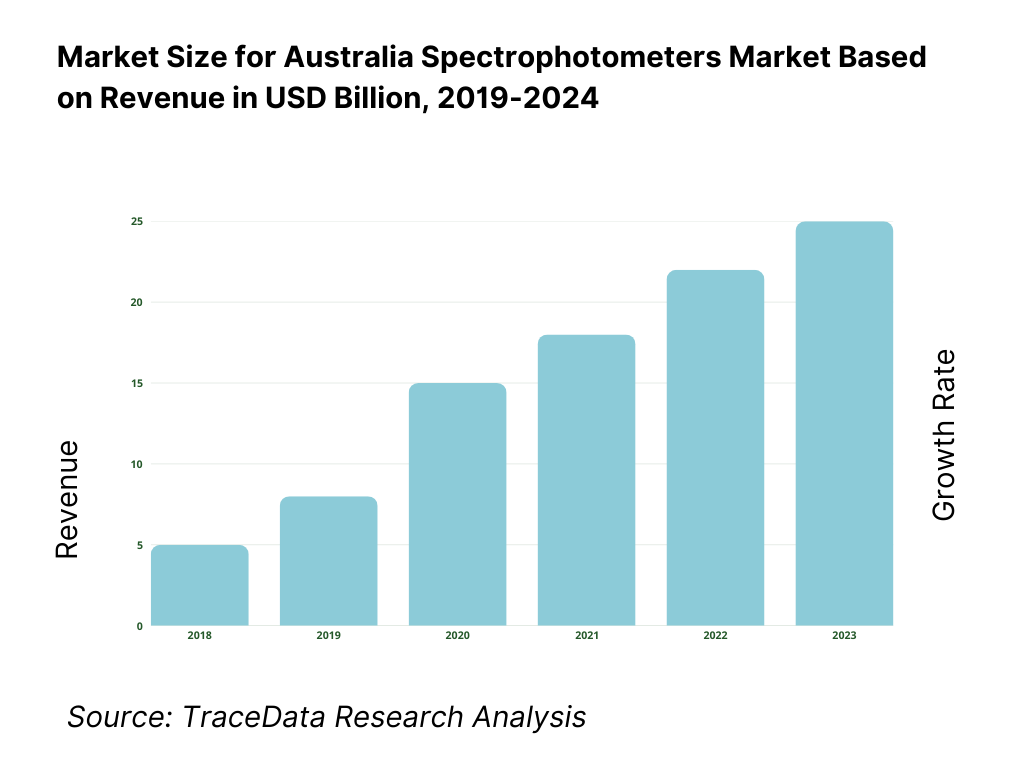
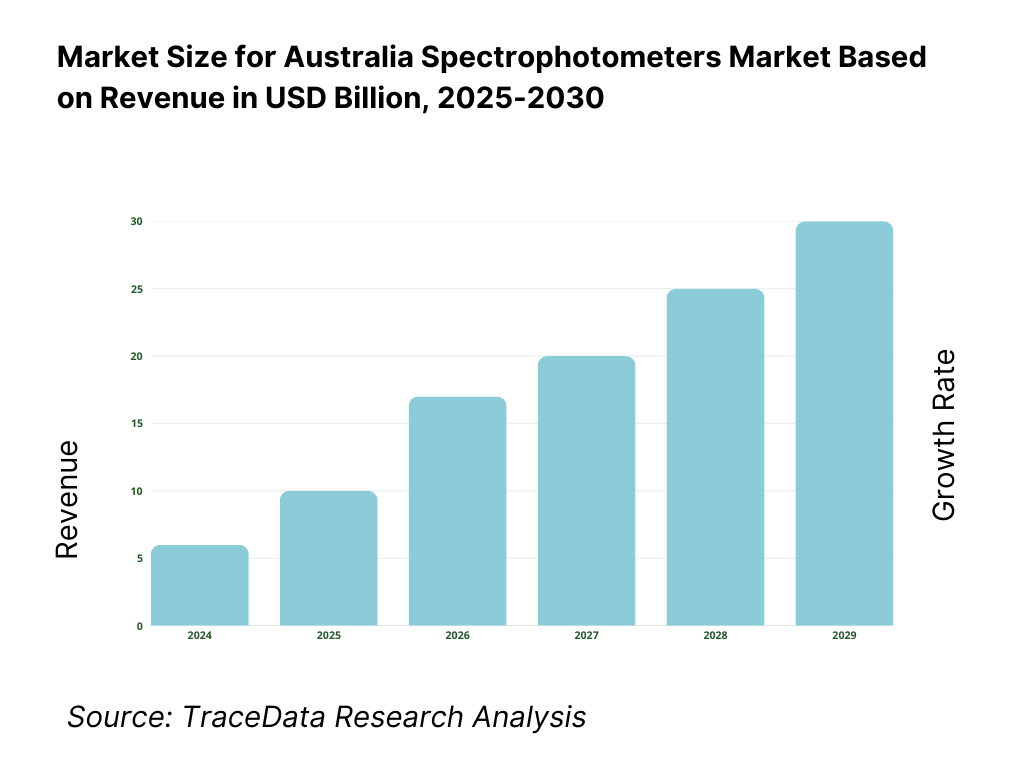
The Australia spectrophotometry market is valued at USD 583.6 million, as reported for 2023 based on process spectroscopy market analysis from RationalStat, with data grounded in actual sales and installations. This level of revenue reflects strong demand stemming from regulatory compliance across water utilities, pharmaceutical quality assurance, environmental monitoring, and increased R&D spending in mining and academia—each requiring precise optical measurements.
The major hubs fueling the market include Sydney–New South Wales (strong presence of universities and pharmaceutical R&D), Melbourne–Victoria (heavy concentration of food processing, clinical diagnostics, and biotech firms), and Perth–Western Australia (mining and minerals testing centers). These regions dominate due to their high density of end-users with rigorous analytical requirements, availability of local technical service infrastructure, and proximity to calibration labs and regulatory authorities.
What Factors are Leading to the Growth of the Australia Spectrophotometers Market:
ADWG compliance: Urban water utilities’ adherence to the Australian Drinking Water Guidelines (ADWG) keeps UV-Vis spectrophotometry embedded in routine compliance testing. The National Performance Report details 81 retail utilities and 5 bulk water authorities serving 25,000,000+ people, a scale that translates to millions of compliance samples for turbidity, nitrate/nitrite, color and organics. Network fragility also sustains monitoring demand: the national median recorded 13.3 water main breaks, bursts and leaks per 100 km of mains and a median unplanned water interruption duration of 112 minutes, both necessitating rapid lab verification. Macro demand is reinforced by urban concentration: Australia’s urban population reached 23,085,836 and 23,600,172 in the latest two datapoints, keeping treated water consumption clustered around cities where compliance labs operate.
Pharma QA/QC: Spectrophotometers are core to medicines QA/QC in Australia’s regulated manufacturing base. As at the latest TGA reporting point, 265 companies held domestic manufacturing licences covering 413 manufacturing sites; GMP Clearance applications for overseas manufacturers totaled 11,511 in the year, with 9,710 completed and 7,730 approved—volumes that directly translate to raw-material, in-process and finished-product assay workloads where UV-Vis, UV-DER and colorimetry remain staple. Post-market vigilance adds throughput pressure: the regulator processed 21,247 medical device incident reports and initiated 1,226 statutory reviews in the same year. The macroeconomic backdrop supports ongoing QA/QC investment: Australia’s GDP at current prices was US$1,752,193,310,000, signaling a large, high-income healthcare market that prioritizes compliance-ready QC.
Clinical chemistry workflows: High test volumes across hospitals and Medicare-subsidised care underpin continuous use of spectrophotometers in clinical chemistry panels (bilirubin, ALT/AST, total protein, creatinine). In 2022–23, Australia recorded 12,600,000 hospitalisations across public and private systems and operated 700 public hospitals, creating large installed bases of core labs and satellite facilities. In the same year, Medicare-subsidised pathology, imaging and other diagnostic services totaled 196,900,000, with diagnostic imaging alone exceeding 27,000,000 services, workloads that depend on biochemistry analyzers whose core photometric modules rely on UV-Vis optics and regular calibration. Such sustained, system-wide activity directly drives replacement cycles, reagents draw, and reference-standard usage in clinical labs.
Which Industry Challenges Have Impacted the Growth of the Australia Spectrophotometers Market:
Capital budgets: Procurement windows for spectrophotometers in public health and utilities must track fiscal space. Total health outlays were A$252,500,000,000, with the Australian Government portion at A$101,500,000,000 and state/territory spending at A$77,300,000,000. Budget normalisation after pandemic peaks means more scrutiny of instrument refresh cycles and replacement of single-beam/aging UV-Vis units. At the macro level, GDP stood at US$1,752,193,310,000, while the urban population numbered 23,600,172—large systems and populations to serve, but capital committees remain measured as spending aligns with broader government priorities. Vendors must therefore frame proposals around lifecycle service, uptime guarantees and compliance outcomes tied to these concrete budget envelopes.
Instrument downtime: Downtime carries systemic risk given Australia’s throughput. Medicare processed 459,600,000 services across programs in 2022–23 (with digital claiming above 98% a year later), and hospitals delivered 12,600,000 admissions—any analyzer outage cascades into reporting delays. On the water side, network stressors are quantified: national median water main breaks were 13.3 per 100 km, and unplanned water supply interruptions had a median duration of 112 minutes—operational events that immediately trigger confirmatory lab testing for parameters commonly measured by spectrophotometers. These volumes and response obligations require redundancy, service SLAs and rapid-swap loaner pools to prevent backlogs in ADWG, environmental, and hospital chemistry labs.
Calibration adherence: Australian laboratories operate under explicit calibration intervals that create mandatory service cycles for photometric systems. NATA’s specific guidance lists “Infrared, ultraviolet and visible” equipment with a 1-year calibration interval and on-use checks on lamp operation; colorimetric integrating spheres recommend annual recalibration and 3-month checks using a working standard lamp. These numerical intervals, read with ISO/IEC 17025 equipment-assurance criteria and NMI monographs, underpin spectrophotometer validation in clinical, environmental and manufacturing labs. With 700 public hospitals and 196,900,000 Medicare-subsidised diagnostic services driving constant use, adherence to these prescribed intervals is non-negotiable to maintain traceability and defensible results.
What are the Regulations and Initiatives which have Governed the Market:
TGA IVD classification: Spectrophotometric modules appear within IVDs assessed under Australia’s four-tier IVD framework (Classes 1 to 4, from non-sterile instruments and low-risk assays through to high-public-health-risk tests). Regulatory activity levels are high: the TGA reported 1,226 statutory reviews and 21,247 incident reports for medical devices in the year, alongside 11,511 GMP clearance applications processed for overseas manufacturers—context that keeps evidence requirements for analytical performance (linearity, LoD/LoQ, interfering substances) in sharp focus for photometric IVDs. These volumes set expectations for post-market documentation and quality systems that instrument suppliers must support with validated calibration and traceability packages.
NATA ISO/IEC 17025: Accreditation under ISO/IEC 17025 governs testing and calibration competence across Australia’s laboratories. NATA’s calibration-reference equipment tables specify numeric intervals—e.g., 1-year calibration for UV/visible equipment; 12-month checks for associated components like colorimetric integrating spheres (3-month working-lamp checks)—which cascade into instrument service plans, documentary evidence, and internal QC schedules. These requirements map directly to spectrophotometer performance claims, uncertainty budgets, and metrological traceability. In a service environment handling 196,900,000 Medicare-subsidised diagnostic services annually and 12,600,000 hospitalisations, maintaining 17025-compliant photometric accuracy is essential for result defensibility and audit readiness.
NMI traceability: Traceability chains terminate at the National Measurement Institute (NMI), which maintains Australia’s primary standards and produces certified reference materials under ISO 17034 and ISO/IEC 17025 accreditation. NMI provides chemical matrix reference materials and purity standards with stated uncertainties to support calibration and method validation in pharmaceutical, environmental and clinical laboratories—critical for spectrophotometer wavelength accuracy, absorbance linearity and drift checks. With national GDP at US$1,752,193,310,000 and an urban population of 23,600,172, Australia’s measurement infrastructure must support large-scale regulated testing; NMI’s accredited CRMs and services anchor that infrastructure and close the traceability loop for photometric assays.
Australia Spectrophotometers Market Segmentation
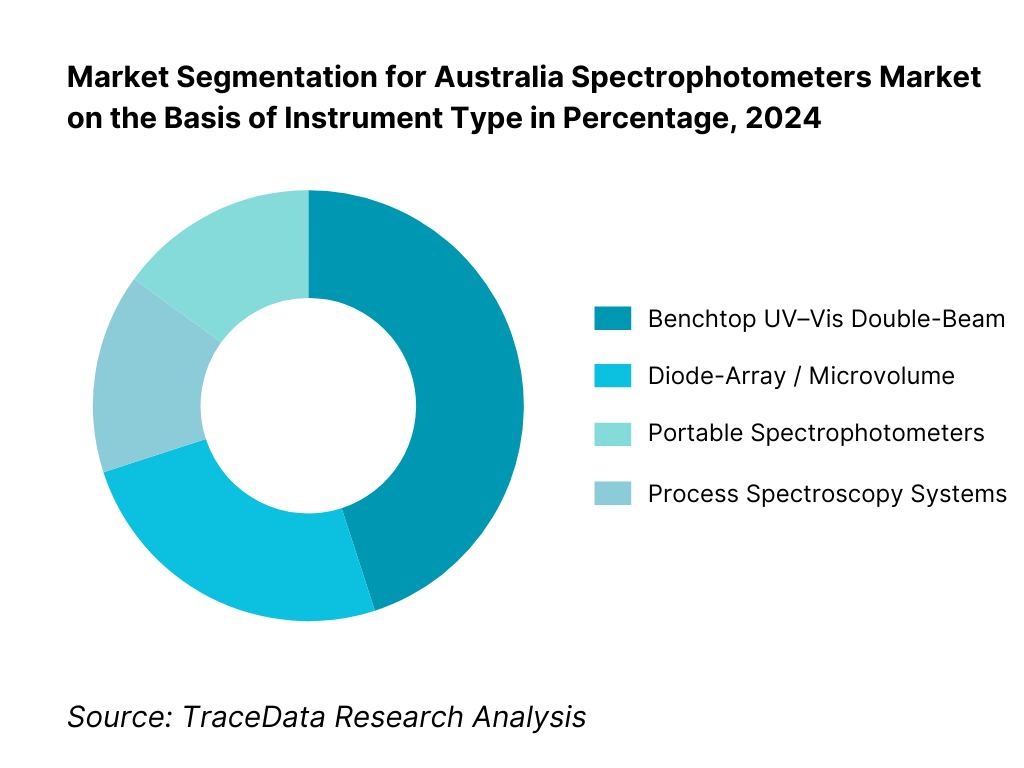
By Instrument Type: The Australia spectrophotometry market is segmented into benchtop UV–Vis double-beam, diode-array (microvolume/high-throughput), portable/field units, and inline/process systems. In 2023, benchtop UV–Vis double-beam systems dominate, due to their robust balance of accuracy, versatility for laboratory workflows, and established use across diagnostics, QA/QC, and environmental labs. These systems benefit from strong service and calibration infrastructure. Diode-array/microvolume systems hold around 25%, favored in high-throughput and nucleic acid/protein quant applications. Portable field units are rising, driven by on-site environmental and mining assays, while inline systems are increasingly adopted by manufacturing and utilities for process monitoring.
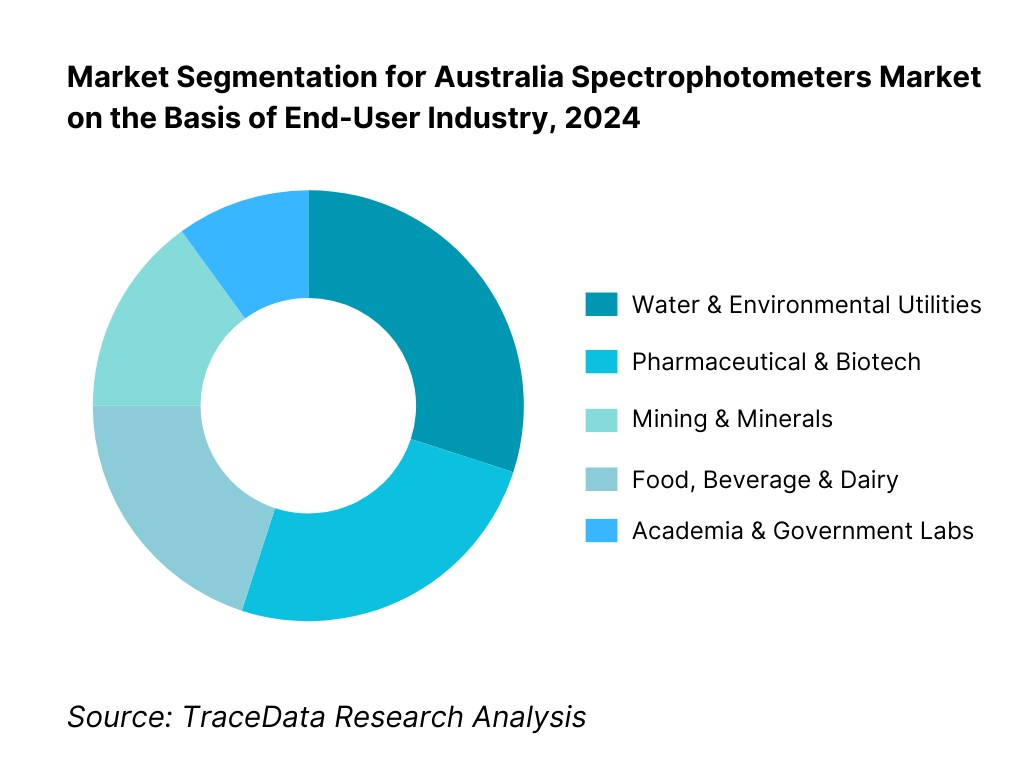
By End-User Industry: The market is segmented into water & environmental utilities, pharmaceutical & biotech, mining & minerals, food/beverage & dairy, and academic/government laboratories. In 2024, water and environmental utilities accounted for the largest share, given the stringent drinking water standards and routine UV/Vis measurements mandated by national guidelines. Pharmaceutical and biotech followed due to QS, QA/QC, and dissolution testing needs under TGA regulation. The mining & minerals segment holds approximately 20%, reflecting the importance of colorimetric assays in ore and process monitoring.
Competitive Landscape in Australia Spectrophotometers Market
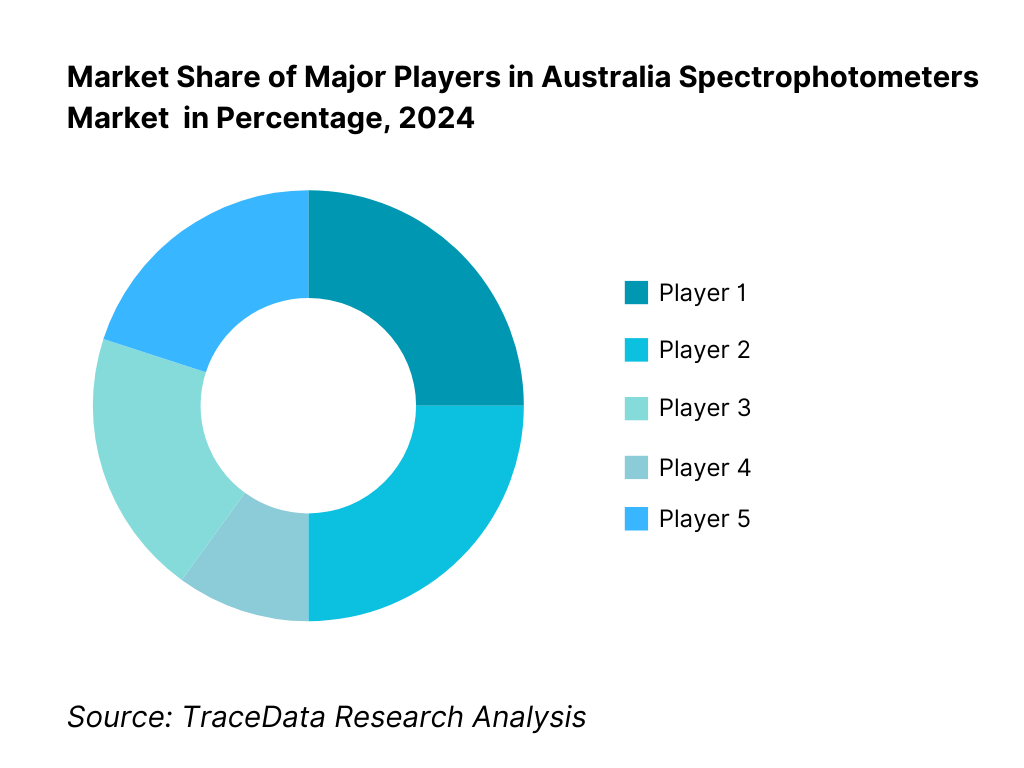
The Australia spectrophotometry market is characterised by a mix of global OEMs with well-established local operations and specialist service-oriented players, reflecting both technological leadership and local support capabilities. The competitive landscape is concentrated among global leaders with strong brand recognition and local support networks. Their dominance stems from a combination of advanced technical capabilities (wide wavelength range, detector technologies), compliance-ready instruments (meeting TGA, NATA, CFR standards), and comprehensive accessory ecosystems. They maintain competitive advantage through robust service footprints (calibration, maintenance) and strong regulatory alignment.
Name | Founding Year | Headquarters |
Agilent Technologies | 1999 | Santa Clara, USA |
Shimadzu Corporation | 1875 | Kyoto, Japan |
Thermo Fisher Scientific | 2006 | Waltham, USA |
Revvity (formerly PerkinElmer) | 1937 | Waltham, USA |
JASCO Corporation | 1958 | Tokyo, Japan |
Hitachi High-Tech | 2001 | Tokyo, Japan |
HORIBA, Ltd. | 1953 | Kyoto, Japan |
Analytik Jena (Endress+Hauser) | 1990 | Jena, Germany |
Mettler-Toledo | 1989 | Greifensee, Switzerland |
Hach (now part of Veralto) | 1947 | Ames, USA |
Molecular Devices (Danaher) | 1983 | Sunnyvale, USA |
Eppendorf SE | 1945 | Hamburg, Germany |
Ocean Insight (Halma) | 1989 | Dunedin, USA |
SCINCO | 1990 | Seoul, South Korea |
PG Instruments | 1999 | Lutterworth, UK |
Some of the Recent Competitor Trends and Key Information About Competitors Include:
Agilent Technologies: As one of the leading players in the Australian spectrophotometers market, Agilent expanded its Cary UV-Vis series distribution in 2023, integrating cloud-based connectivity features. The company has also strengthened its service network in Sydney and Melbourne to support NATA-accredited labs and universities, reflecting growing demand for compliant and digitally enabled instruments.
Shimadzu Corporation: Known for its robust double-beam UV-Vis systems, Shimadzu enhanced its presence in Australia by partnering with regional distributors in Queensland and Western Australia. In 2023, the company introduced its UV-i Selection platform, designed to improve usability and reduce downtime in environmental and pharmaceutical testing.
Thermo Fisher Scientific: A major global leader, Thermo Fisher reinforced its Australian footprint by launching advanced microvolume spectrophotometers tailored for biotech and clinical applications. In 2023, it also expanded its Brisbane application lab, offering training and compliance validation services for pharmaceutical customers under TGA regulations.
HORIBA Scientific: With a strong background in optical technologies, HORIBA has seen rising adoption of its spectrophotometers in the mining and minerals sector in Western Australia. In 2023, the company focused on promoting fiber-optic coupled systems for real-time process monitoring, responding to the increasing demand for inline analysis in the resources industry.
Revvity (formerly PerkinElmer): Revvity strengthened its market position in Australia by updating its UV/Vis Lambda series with enhanced CFR Part 11 compliance features in 2023. The company has also increased collaborations with water utilities and environmental testing agencies, providing solutions that align with Australian Drinking Water Guidelines (ADWG) requirements.
What Lies Ahead for Australia Spectrophotometers Market?
The Australia spectrophotometers market is expected to expand steadily by 2029, underpinned by regulatory compliance requirements across environmental testing and pharmaceutical QA/QC, increasing demand for clinical diagnostics, and continuous investments in R&D from universities and government institutions. The market outlook is further supported by Australia’s robust water monitoring framework under ADWG, strong mining sector testing needs, and the rising adoption of connected and automated lab solutions.
Rise of Portable and Inline Systems: The future of the Australian spectrophotometers market will see a greater emphasis on portable and inline spectrophotometry. Water utilities and mining companies increasingly demand real-time field and process monitoring solutions that minimize downtime and enable quicker decision-making. These systems, coupled with rugged designs, will become mainstream as industries focus on efficiency and regulatory responsiveness.
Focus on Compliance-Ready Instruments: As laboratories and industries operate under strict guidelines from TGA, NATA, and ISO/IEC 17025, spectrophotometer suppliers will need to emphasize instruments that are fully compliance-ready. Instruments with built-in audit trails, secure data logging, and traceable calibration records will dominate procurement pipelines, particularly in pharma, biotech, and government-regulated testing environments.
Expansion of Application-Specific Solutions: Specialized demand for application-specific instruments will grow, particularly in mining, food & dairy, and environmental monitoring. Solutions designed for nitrate/phosphate testing in water, protein quantification in dairy, and colorimetric assays in mining will see strong adoption. This sector-driven customization will enhance relevance and value to end-users, moving beyond generic UV-Vis systems.
Leveraging AI and Digital Integration: The adoption of AI-driven spectral analysis and integration with Laboratory Information Management Systems (LIMS) will accelerate. These advancements will enable laboratories to automate result interpretation, minimize manual error, and enhance throughput. Cloud-enabled instruments will further support remote monitoring, preventive maintenance, and centralized compliance reporting, making digital integration a central growth lever in the Australian spectrophotometers market.
Australia Spectrophotometers Market Segmentation
By Technology
UV–Vis Single-Beam
UV–Vis Double-Beam
Diode-Array UV–Vis (incl. rapid-scan)
Microvolume/Nano-drop Type
Microplate Absorbance Readers
NIR Spectrophotometers (bench/portable)
Process/Inline UV–Vis (fiber-optic, flow-through)
By Wavelength Range
UV Only (≈190–380 nm)
Visible Only (≈380–780 nm)
UV–Vis (≈190–780 nm)
UV–Vis-NIR Extended (to ≈1,100–3,300 nm)
NIR (≈780–2,500 nm+)
By Optical Geometry / Detector
Single-Beam
Double-Beam / Split-Beam
Integrating Sphere / Diffuse Reflectance
Fiber-Optic Probe Systems
Detector Type: PMT, Silicon Photodiode, CCD/CMOS Array
By Form Factor / Throughput
Benchtop
High-Throughput
Microplate
Microvolume
Portable/Field
Inline/At-Line
By Region
New South Wales / ACT
Victoria
Queensland
Western Australia
South Australia
Tasmania
Northern Territory
Players Mentioned in the Report:
Agilent Technologies
Shimadzu Corporation
Thermo Fisher Scientific
Revvity (PerkinElmer)
JASCO Corporation
Hitachi High-Tech
HORIBA Scientific
Analytik Jena
Mettler Toledo
Hach (Xylem)
Molecular Devices (Danaher)
Eppendorf
Ocean Insight (Halma)
SCINCO
PG Instruments
Key Target Audience
Chief Technology Officers (CTOs) at pharmaceutical and biotech firms
Analytical Instrument Buyers at water utilities
Head of R&D in mining and minerals processing companies
QA/QC Managers in food, beverage, and dairy industries
Procurement Heads at independent testing laboratories
Investments and venture capitalist firms (specializing in scientific instrumentation and laboratory automation)
Government and regulatory bodies (e.g., TGA, NATA)
Facility Managers at university central labs and industry R&D centers
Time Period:
Historical Period: 2019-2024
Base Year: 2025
- Forecast Period: 2025-2030
Report Coverage
Choose individual sections to purchase. Mix and match as you like.
4.1 Delivery Model Analysis for Spectrophotometers-Direct Sales, Distributor Sales, Online Channels, Leasing & Service Contracts (Margins, Preference, Strengths & Weaknesses)
4.2 Revenue Streams for Spectrophotometers Market (Instrument Sales, Accessories, Software Licenses, Calibration & Maintenance, IQ/OQ/PQ Services, Extended Warranties, Consumables-cuvettes, lamps)
4.3 Business Model Canvas for Spectrophotometer OEMs in Australia
5.1 Independent Distributors vs OEM Direct Subsidiaries (market penetration, after-sales service impact)
5.2 Investment Model in Spectrophotometers Market (capex vs opex, leasing models, government research grants, public tenders)
5.3 Comparative Analysis of Procurement Funnel-Public Tenders vs Private Research Labs (evaluation criteria, local preference, service requirements)
5.4 Laboratory & Utility Budget Allocation for Instrumentation
8.1 Revenues, 2019-2024 (In AUD Mn & USD Mn)
9.1 By Market Structure (In-House Research Labs vs Outsourced Contract Labs), 2023-2024P
9.2 By Technology (UV-Vis Single Beam, UV-Vis Double Beam, Diode Array, NIR, Microvolume, Process/Inline), 2023-2024P
9.3 By End-User Industry Verticals (Clinical Diagnostics, Pharma & Biotech, Mining & Minerals, Food & Dairy, Water Utilities, Academia & Government), 2023-2024P
9.3.1 By Type of Mining/Metallurgy Applications
9.3.2 By Type of Pharma/QA-QC Applications
9.3.3 By Type of Food & Dairy Applications
9.3.4 By Type of Clinical Diagnostics Applications
9.4 By Organization Size (Large Research Institutions, Universities, SMEs, Independent Labs), 2023-2024P
9.5 By User Level (Research Scientists, Lab Technicians, Process Engineers), 2023-2024P
9.6 By Mode of Usage (Benchtop, Portable, Inline/Process, Microvolume, Microplate Readers), 2023-2024P
9.7 By Customization (Standard Instruments vs Customized Research Setups), 2023-2024P
9.8 By Region (NSW/ACT, Victoria, Queensland, Western Australia, South Australia, Tasmania, Northern Territory), 2023-2024P
10.1 End-User Cohort Analysis (Hospitals, Utilities, Mining Labs, Academia)
10.2 Procurement Needs & Decision-Making Process (price, compliance, service support)
10.3 Instrument Effectiveness & ROI Analysis (sample throughput, downtime, service SLAs)
10.4 Gap Analysis Framework
11.1 Trends and Developments in Australia Spectrophotometers Market
11.2 Growth Drivers (ADWG compliance, TGA IVD framework, pharma QC, mining exports, university grants)
11.3 SWOT Analysis for Market Players
11.4 Issues and Challenges (budget cycles, downtime, calibration, limited local manufacturing)
11.5 Government Regulations & Standards
12.1 Market Size and Future Potential for Portable/Field Spectrophotometers in Australia
12.2 Business Models and Revenue Streams (rental units, mobile labs, remote monitoring add-ons)
12.3 Delivery Models and Application Range (environmental, field mining assays, utilities)
12.4 Cross Comparison of Leading Portable Spectrophotometer Providers (company overview, funding, revenues, units installed, field ruggedness, fees, accessories)
15.1 Market Share of Key Players in Australia Basis Revenues, 2024
15.2 Benchmark of Key Competitors Including: Company Overview, USP, Business Strategies, Business Model, Number of Instruments Installed, Revenues, Pricing Basis Technology, Technology Used, Best-Selling Products, Major Clients, Strategic Tie-Ups, Marketing Strategy, Recent Developments
15.3 Operating Model Analysis Framework (direct vs distributor, service hubs, demo units)
15.4 Gartner Magic Quadrant (positioning OEMs by vision & execution)
15.5 Bowmans Strategic Clock for Competitive Advantage
15 Competitors: Agilent Technologies, Shimadzu Corporation, Thermo Fisher Scientific, Revvity (PerkinElmer), JASCO Corporation, Hitachi High-Tech, HORIBA Scientific, Analytik Jena, Mettler Toledo, Hach (Xylem), Molecular Devices, Eppendorf, Ocean Insight, SCINCO, PG Instruments
16.1 Revenues, 2025-2030 (In AUD Mn & USD Mn)
17.1 By Market Structure (In-House Research Labs vs Outsourced Contract Labs), 2025-2030
17.2 By Technology (UV-Vis Single Beam, UV-Vis Double Beam, Diode Array, NIR, Microvolume, Process/Inline), 2025-2030
17.3 By End-User Industry Verticals (Clinical Diagnostics, Pharma & Biotech, Mining & Minerals, Food & Dairy, Water Utilities, Academia & Government), 2025-2030
17.3.1 By Type of Mining/Metallurgy Applications
17.3.2 By Type of Pharma/QA-QC Applications
17.3.3 By Type of Food & Dairy Applications
17.3.4 By Type of Clinical Diagnostics Applications
17.4 By Organization Size (Large Research Institutions, Universities, SMEs, Independent Labs), 2025-2030
17.5 By User Level (Research Scientists, Lab Technicians, Process Engineers), 2025-2030
17.6 By Mode of Usage (Benchtop, Portable, Inline/Process, Microvolume, Microplate Readers), 2025-2030
17.7 By Customization (Standard Instruments vs Customized Research Setups), 2025-2030
17.8 By Region (NSW/ACT, Victoria, Queensland, Western Australia, South Australia, Tasmania, Northern Territory), 2025-2030
Research Methodology
Step 1: Ecosystem Creation
The first step involves mapping the complete ecosystem of the Australia Spectrophotometers Market, identifying both demand-side and supply-side entities. On the demand side, this includes hospitals, pathology labs, pharmaceutical manufacturers, water utilities, food & dairy processors, mining labs, and academic research institutes. On the supply side, we consider global OEMs, regional distributors, calibration service providers, regulatory authorities (TGA, NATA, NMI), and accessory/consumable suppliers. Based on this ecosystem, 5–6 leading manufacturers such as Agilent Technologies, Shimadzu, Thermo Fisher Scientific, HORIBA, Revvity (PerkinElmer), and JASCO are shortlisted using criteria such as financial performance, installed base, compliance-ready product portfolios, and service coverage across major Australian states.
Step 2: Desk Research
An exhaustive desk research phase is conducted referencing diverse secondary and proprietary databases to build industry-level insights. This includes analyzing revenues of OEMs in Australia, import/export data under HS 9027, calibration adherence intervals from NATA, and testing volumes published in public health and water quality reports. Desk research also incorporates reviews of annual reports, regulatory filings, and press releases of market players to evaluate pricing strategies, replacement cycles, service contracts, and local investments. These inputs provide a foundational understanding of the spectrophotometer market’s revenue drivers, demand clusters, and operational dynamics within Australia’s regulated laboratory ecosystem.
Step 3: Primary Research
In-depth interviews are conducted with C-level executives of OEM subsidiaries, regional distributors, and calibration service providers, alongside managers in end-user industries such as pharmaceutical QA/QC labs, water utilities, and mining companies. These interactions serve three main purposes: validating market hypotheses, authenticating statistical information, and extracting operational insights. A bottom-to-top approach is undertaken to evaluate revenue contributions of each company within their end-user verticals. To strengthen accuracy, disguised interviews are conducted under the guise of potential clients to validate financial, operational, and service data against secondary research. These primary conversations further capture details on replacement cycles, service gaps, and compliance readiness of instruments in use.
Step 4: Sanity Check
Finally, a dual methodology of bottom-to-top and top-to-bottom analysis is applied to cross-verify market sizing outcomes. Bottom-up modeling aggregates revenues from key suppliers, service contracts, and replacement units, while top-down modeling references macro-level industry data such as diagnostic service volumes, mining output, and water quality testing statistics. This dual validation ensures that the market model is robust, consistent with Australia’s regulatory framework, and reflective of the true demand environment for spectrophotometers.
FAQs
01 What is the potential for the Australia Spectrophotometers Market?
The Australia Spectrophotometers Market shows strong multi-sector potential, anchored by mandatory testing under Australian Drinking Water Guidelines, stringent TGA/ISO compliance in pharma and clinical labs, and high analytical intensity in mining, food & dairy, and research institutions. Replacement cycles for legacy UV-Vis platforms, the shift toward microvolume and diode-array systems, and growing adoption of inline/process spectroscopy in utilities and manufacturing further expand headroom. Local distributors and NATA-accredited service networks deepen penetration across NSW/ACT, Victoria, Queensland, and Western Australia, sustaining steady installations and service revenues.
02 Who are the Key Players in the Australia Spectrophotometers Market?
Leading participants include Agilent Technologies, Shimadzu Corporation, Thermo Fisher Scientific, Revvity (PerkinElmer), JASCO Corporation, Hitachi High-Tech, HORIBA Scientific, Analytik Jena (Endress+Hauser), Mettler Toledo, Hach, Molecular Devices (Danaher), Eppendorf, Ocean Insight (Halma), SCINCO, and PG Instruments. These companies stand out for deep product portfolios (benchtop UV-Vis, diode-array, microvolume, microplate, and inline/process units), compliance-ready software (audit trails, 21 CFR Part 11), extensive accessory ecosystems (sippers, temperature control, fiber probes), and established ANZ service coverage through subsidiaries and authorized partners.
03 What are the Growth Drivers for the Australia Spectrophotometers Market?
Growth is propelled by regulatory compliance and auditability requirements in pharma/biotech and hospital chemistry labs, continuous monitoring mandates in water and environmental testing, and assay intensity in mining and minerals processing. Investments in digitized laboratories—LIMS/ELN connectivity, cloud reporting, and data-integrity workflows—favor newer UV-Vis platforms with validated methods and secure audit trails. University and government research funding, expansion of biomanufacturing, and process analytics (PAT) adoption in food, beverage, and chemicals add consistent demand for higher-throughput, lower-maintenance systems.
04 What are the Challenges in the Australia Spectrophotometers Market?
Key headwinds include capex scrutiny in public health and utilities procurement, instrument downtime risks and the need for rapid service/loaner coverage, and strict calibration/adherence under NATA and ISO/IEC 17025. Fragmented tender specifications across states, method-transfer and data-integrity burdens, and shortages of skilled technicians complicate rollouts. Competition from adjacent techniques (e.g., IC, HPLC, ICP-OES) in certain assays and lingering supply-chain lead times for lamps, detectors, and optics also pressure upgrade timelines and inventory planning.