Australia Used Automobiles Market Outlook to 2030
By Market Structure, By Vehicle Type, By Powertrain, By Vehicle Age & Kilometres, By Sales Channel, By Buyer Type, and By Region
- Product Code: TDR0228
- Region: Asia
- Published on: August 2025
- Total Pages: 80
Report Summary
The report titled “Australia Used Automobiles Market Outlook to 2030 – By Market Structure, By Vehicle Type, By Powertrain, By Vehicle Age & Kilometres, By Sales Channel, By Buyer Type, and By Region” provides a comprehensive analysis of Australia’s secondary automotive ecosystem. The study traces the overview and genesis of the industry—from dealer-led trade-ins and auction remarketing to today’s omnichannel retail—then examines the overall market size in revenue terms, detailed market segmentation, and the evolving trends and developments shaping demand. The report builds a customer-level profile of key cohorts—individual retail buyers, ABN small businesses, fleet replacement, rideshare/commercial—covering discovery, financing behavior, and post-sale service patterns, and surfaces issues and challenges including depreciation volatility (especially for electrified stock), compliance cost per unit, transport/logistics constraints, reconditioning capacity, and warranty/returns exposure. The report concludes with future market projections to 2029 based on transaction volumes, channel mix, powertrain and vehicle-age shifts, and regional patterns, integrating cause-and-effect relationships (cost-of-living dynamics, interest-rate environment, new-car supply normalization, migration/household formation) and success case studies that spotlight omnichannel rollouts, reconditioning hub models, and instant-offer programs—distilling the major opportunities and cautions for stakeholders across Australia’s used-automobile value chain.
Australia Used Automobiles Market Overview and Size
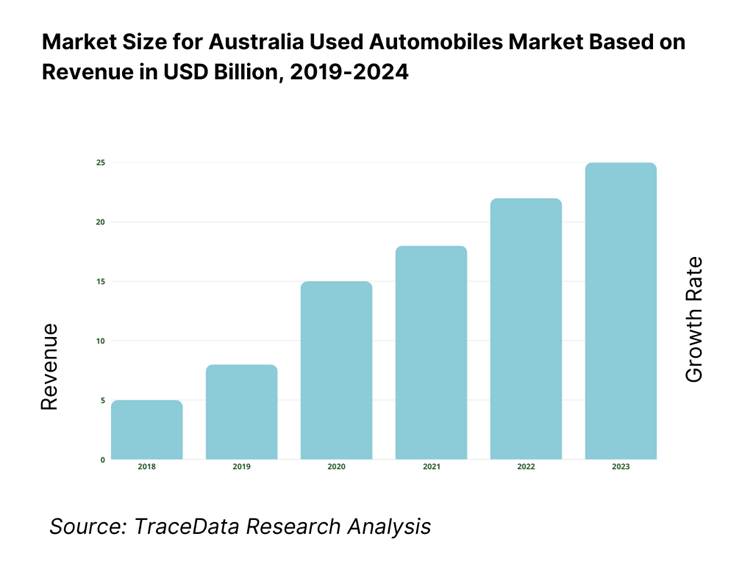
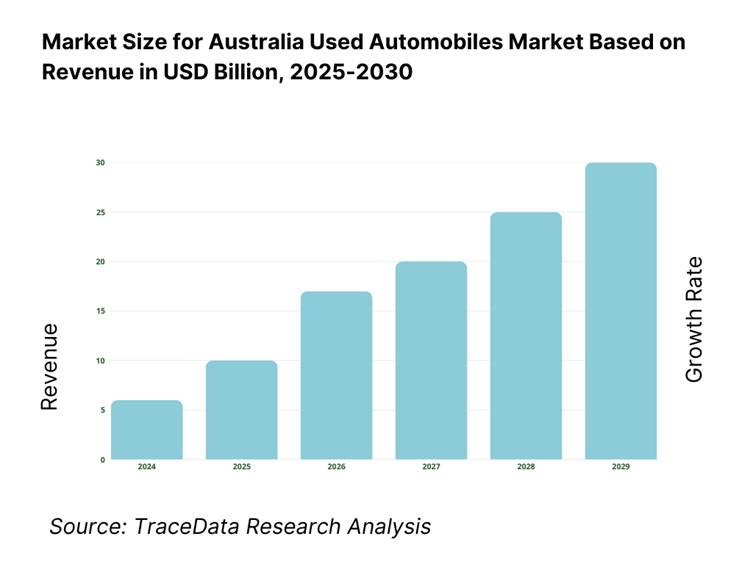
The Australia used automobiles market is valued at USD 28,323.8 million in 2024, with a CAGR of approximately 6.4 % during 2018–2023, as implied by estimates projecting growth from earlier historical base and the AUD-to-USD conversions in authoritative reports. This market expansion is driven by rising new-vehicle prices, supply constraints in the new vehicle segment, and the growing affordability of retaining value models through certified pre‑owned programs and online platforms enhancing transaction transparency.
Several urban centres—particularly Sydney (NSW), Melbourne (VIC), and Brisbane (QLD)—dominate the used car market due to concentrated population density, higher household purchasing power, and well-developed dealership and logistics infrastructure. Moreover, strong digital adoption in these cities enhances online inventory visibility and faster transaction cycles, reinforcing their leadership in the used car ecosystem.
What Factors are Leading to the Growth of the Australia Used Automobiles Market:
Cost-of-Living Index: Australia’s cost-of-living remains notably elevated: data from the Australian Parliament shows household living costs rose by 15 percent over the two years to June 2024, reflecting sustained pressure on disposable incomes. In addition, research by Expatistan indicates that Australia’s cost-of-living is higher than 87 percent of countries worldwide. These macro factors drive consumers toward more affordable mobility options. Used vehicles offer a lower-cost alternative—buyers can avoid depreciation and high new-car prices. The heightened cost of essentials like food, housing, and transport intensifies demand for reliable second-hand vehicles that allow households to stretch budgets. This dynamic is especially pronounced in cities with acute cost pressures, where consumers increasingly prefer cost-efficient used vehicles over new ones.
Migration & Household Formation: Australia experienced substantial migration: in 2022–23, net overseas migration peaked at 536,000 people, with international students forming a significant portion. At the same time, average household size declined—from approximately 2.9 people per household in the mid‑1980s to about 2.5 in recent years. More households plus migration-driven population surge means more individuals or smaller families entering the market needing personal transportation. Combined, these trends elevate demand for usable, accessible used cars, especially for young professionals and migrant families who need independent mobility but may prefer cost-effective, pre‑owned vehicles over expensive new models.
New-Car Supply Lead-Times: The new‑vehicle market is experiencing extended delivery delays: in the latter half of 2022, the average time between purchase agreement and delivery exceeded 150 days. Despite record new-vehicle deliveries of 1,216,780 units sold in 2023, surpassing the previous peak of 1,189,116 in 2017, supply chain constraints continue. These prolonged lead times push consumers toward readily available used vehicles to meet their immediate transportation needs. For those unwilling or unable to wait long months for new-car delivery, high-quality used cars become the practical and timely alternative.
Which Industry Challenges Have Impacted the Growth of the Australia Used Automobiles Market:
Depreciation Volatility: Used vehicle depreciation in Australia exhibits marked variance. A report highlights that electric cars under two years retain only 82.8 percent of original value, while those aged two to four years drop to 57.6 percent retained value. Such volatility makes forecasting resale values risky and complicates dealer pricing strategies. Rapid changes in retained value particularly affect EVs and hybrids, creating unpredictability for both sellers and buyers in the used market. This fluctuation can deter investment in certain vehicle types or complicate financing and inventory valuation, especially for dealers managing vast and diverse stock portfolios.
Compliance Cost per Unit: Imported used vehicles, especially under specialist compliance schemes, face substantial costs. A community discussion notes compliance post-arrival can cost around AUD 2,000 to AUD 3,000 per vehicle. This figure, while anecdotal, aligns with the broad cost burdens imposed by regulatory conformance for imported units. These compliance costs—involving safety certification, modifications, and paperwork—diminish dealer margins or raise retail prices for consumers. For local dealers handling imports, the additional outlay per unit makes high-volume, low-margin operations less feasible, and may limit supply options for rare or in-demand models.
Warranty Claim Ratio: Warranty claim data specific to second-hand vehicles is less readily published, but general automotive warranty trends offer insight. Worldwide, warranty claims comprised roughly 3 percent of total vehicle sales revenue and 11 percent of unit sales in 2023. Although this applies to new vehicle markets broadly, used cars often carry residual warranties or dealer-backed guarantees. Claim incidences and associated costs (service, parts, labour) impose financial risk, especially on low-margin used vehicles. Dealers must balance warranty offerings to instill buyer confidence against the cost exposure of potential claims on older vehicles with unknown histories.
What are the Regulations and Initiatives which have Governed the Market:
ACL Consumer Guarantees: Under Australian Consumer Law (ACL), any product purchased must meet expectations and be fit for purpose. For used vehicles sold through motor dealerships, the ACL mandates automatic guarantees with no additional cost to consumers. This regulatory assurance increases buyer trust but also imposes obligations on sellers to rectify defects or offer refunds. Compliance adds operational costs and requires robust inspection, warranty, and customer service protocols to meet legal standards, without giving dealerships flexibility to sell "as‑is" vehicles—impacting risk and margin profiles.
State Statutory Warranties: In several states, statutory warranties apply to used vehicles. For instance, in Victoria, lawmakers require dealers to offer a warranty lasting 3 months or 5,000 kilometres, whichever occurs first. These minimum standards protect consumers but also expose dealers to potential repair costs. The mandatory warranty period may necessitate pre-sale reconditioning, which increases cost and inventory turnaround time. Dealers must factor reconditioning to meet these obligations, affecting price and throughput efficiency—especially for older or high-mileage vehicles more prone to defects.
PPSR / NEVDIS Checks: Every vehicle in Australia must be checked against multiple registers before sale. PPSR (Personal Property Securities Register) ensures no outstanding finance, while NEVDIS (National Exchange of Vehicle and Driver Information System) provides odometer, write-off, and stolen status. These checks are compulsory for legal sale and transfer of ownership. Non-compliance risks legal penalties and reputational damage. Automated checking systems may cost dealers per check, but failure to conduct them could invalidate sales or incur fines. The need for comprehensive register checks adds administrative burden, requiring reliable digital systems and trained staff to process and verify each used vehicle transaction.
Australia Used Automobiles Market Segmentation
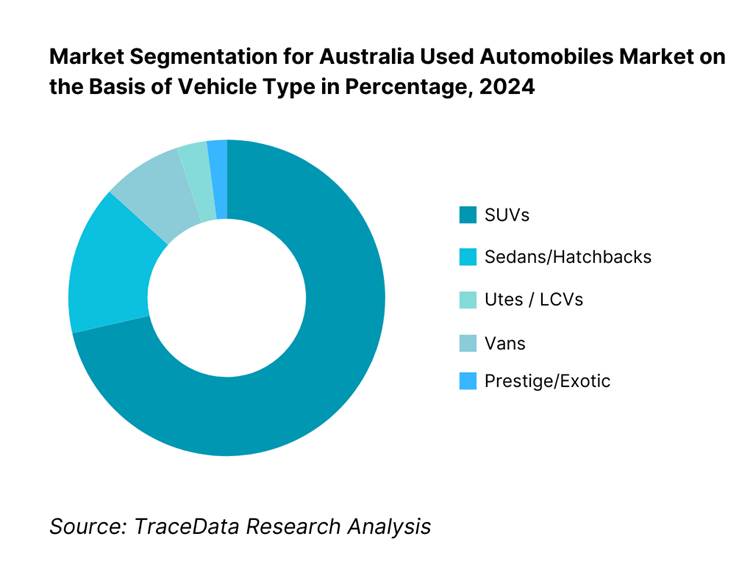
By Vehicle Type: SUVs dominate the market as consumer preference continues shifting toward SUVs due to their versatility, perceived safety, and suitability for both urban and regional use. They also hold stronger residual values and enjoy higher demand across both family and business buyers, reinforcing their outsized presence in used retail.
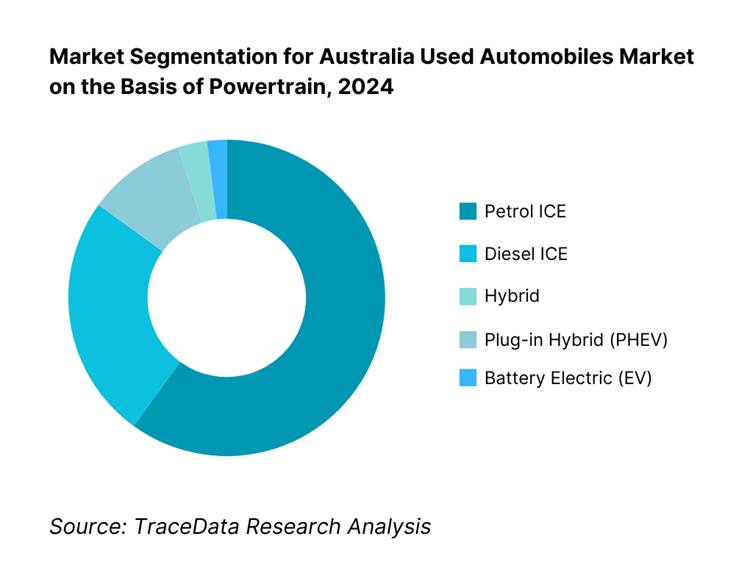
By Powertrain: Petrol vehicles remain dominant due to widespread fueling infrastructure, lower initial costs, and extensive servicing networks. Structural preferences still favor ICE models in affordability and maintenance simplicity, especially for first-time and budget-conscious buyers.
Competitive Landscape in Australia Used Automobiles Market
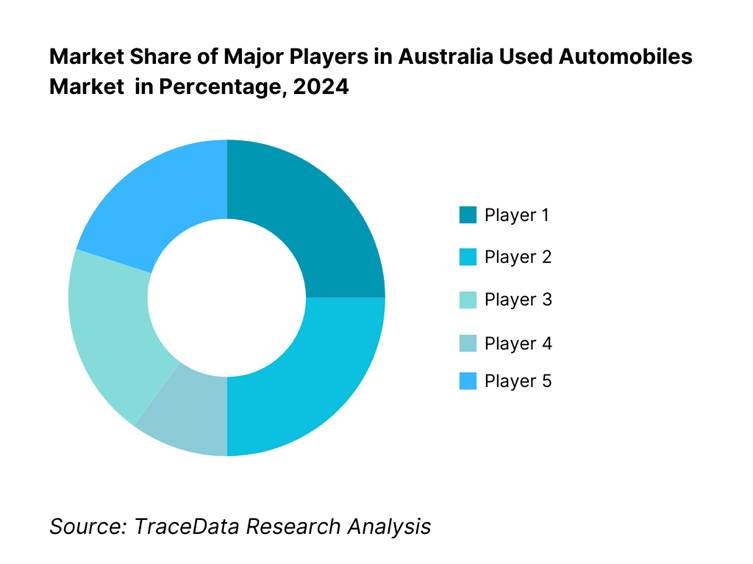
The competitive landscape is characterized by a mix of large dealer groups, niche specialists, marketplaces, and auction houses. The market is highly consolidated, with key players leveraging scale, digital capabilities, and omnichannel presence.
Name | Founding Year | Headquarters |
Eagers Automotive / easyauto123 | 1913 | Brisbane, Australia |
Peter Warren Automotive Holdings | 1958 | Warwick Farm, Australia |
Autosports Group | 2006 | Sydney, Australia |
OzCar | 1998 | Sydney, Australia |
Westside Auto Wholesale | 1988 | Perth, Australia |
Tony White Group (TWG) | 1989 | Queensland, Australia |
Dutton Group (Dutton Garage / One) | 1911 | Melbourne, Australia |
CAR Group / carsales.com.au | 1997 | Melbourne, Australia |
Autotrader Australia | 1997 | Melbourne, Australia |
CarsGuide | 2000 | Sydney, Australia |
Pickles Auctions | 1964 | Sydney, Australia |
Manheim (Cox Automotive Australia) | 1945 (US) | Atlanta, USA / Melbourne |
Grays (GraysOnline) | 1922 | Sydney, Australia |
Autorola Australia | 2001 | Sydney, Australia |
AutoFlip | 2019 | Melbourne, Australia |
Some of the Recent Competitor Trends and Key Information About Competitors Include:
Eagers Automotive / easyauto123: As one of the largest automotive dealer groups in Australia, Eagers expanded its easyauto123 used car superstores across major metro regions in 2023. The company reported growth in retail volumes, supported by integrated financing and insurance services and the expansion of its omnichannel retail model, enabling end-to-end online purchasing.
carsales.com.au (CAR Group): A dominant online marketplace, carsales strengthened its instant offer program in 2023, allowing consumers to sell vehicles directly to dealers quickly. The platform also integrated AI-driven valuation tools and expanded its EV listings, addressing the rising interest in electric and hybrid vehicles.
Pickles Auctions: Known for its strength in fleet and government disposals, Pickles recorded a surge in auction clearance rates during 2023, driven by high demand for SUVs and utes. The company expanded its digital auction platform, making it easier for both dealers and private buyers to participate remotely.
OzCar: With its extensive independent dealership network, OzCar introduced flexible in-house financing solutions in 2023, targeting affordability-conscious buyers. The company also invested in expanding stockyards and implementing digital inspection systems to increase buyer confidence in used vehicle quality.
Dutton Group (Dutton Garage / Dutton One): Specialising in prestige and classic automobiles, Dutton Group expanded its national footprint in 2023 by acquiring additional premium dealerships. It also launched concierge sourcing services, enabling affluent clients to acquire rare luxury and collectible vehicles.
What Lies Ahead for the Australia Used Automobiles Market?
The Australia used automobiles market is set to expand steadily over the forecast horizon, underpinned by sustained cost-of-living pressure that keeps buyers trading down to pre-owned vehicles, continued normalisation of new-car supply (freeing up trade-ins and fleet de-fleets), and a deeper digital retail stack that lowers friction from search to handover. Expect healthier inventory turns at large dealer groups and marketplaces, stronger finance/insurance attach, and rising transparency (battery-health reports, PPSR/NEVDIS integration) that boosts consumer confidence and repeat purchases.
Rise of Hybrid Buying Models (Online × Offline): Buying journeys will blend digital discovery, instant offers, and remote approvals with targeted showroom touchpoints for test drives and delivery. Dealers will scale “click-to-buy” plus home delivery/collection, while auctions continue shifting to timed online lanes. This hybrid model unlocks broader geographic demand, compresses time-to-sale, and supports national inventory balancing via reconditioning hubs and interstate logistics—especially valuable for SUVs/utes and near-new stock with high cross-border appeal.
Focus on Outcome-Based Value (CX, Reliability, TCO): Enterprises will align merchandising and warranties to measurable outcomes: fewer post-sale defects, lower return rates, and clearer total-cost-of-ownership. Expect tighter inspection standards, certified pre-owned expansion, battery state-of-health disclosures for electrified stock, and service plans bundled at checkout. Metrics like days-to-turn, reconditioning spend per unit, and claim severity will be actively managed and reported to sustain margins while lifting NPS.
Expansion of Segment-Specific Supply Pools: Fleet/lease de-fleets, rideshare turnover, government disposals, and renewed import pathways for specialist models (via RVS/SEVS/RAV) will diversify supply. SUVs and utes remain the workhorses, while late-model hybrids begin to flow through in larger volumes as new-car backlogs clear. Dealers that stand up specialist lanes—EV/hybrid remarketing, prestige/exotics, and tradie-ready LCVs—will capture distinct buyer cohorts and premium gross per unit.
Leveraging AI and Analytics: Pricing engines fed by live marketplace telemetry, auction signals, and regional demand will set list prices dynamically and guide acquisition bids. Computer-vision inspection, VIN-linked service histories, and predictive recon forecasts will compress time-to-retail and reduce avoidable spend. For EVs, battery analytics (state-of-health, fast-charge history) will standardise valuation and underwriting, unlocking finance products tailored to pack longevity and usage patterns.
Australia Used Automobiles Market Segmentation
By Vehicle Type
Hatchbacks
Sedans
SUVs (compact, mid-size, full-size)
Utes & Pick-ups (light commercial vehicles)
Vans & MPVs
Luxury & Prestige Vehicles
Classic & Collectible Automobiles
By Powertrain
Petrol ICE Vehicles
Diesel ICE Vehicles
Hybrid Vehicles (HEV)
Plug-in Hybrid Electric Vehicles (PHEV)
Battery Electric Vehicles (BEV)
By Vehicle Age & Usage
Near-New (0–2 years old, low km)
Mid-Life (2–5 years old, moderate km)
Late-Life (5–10 years old, higher km)
High-Mileage/Legacy (>10 years or >150,000 km)
By Sales Channel
Franchised Dealer Groups (e.g., Eagers Automotive, Peter Warren Automotive)
Independent Used Car Dealers (regional & urban operators)
Online Marketplaces (carsales.com.au, Autotrader, CarsGuide)
Auction Houses (Pickles, Manheim, Grays)
Private-to-Dealer Instant Offer Platforms (AutoFlip, dealer networks)
By Buyer Type
Individual Retail Buyers
Small Businesses
Fleet Replacement Buyers
Rideshare & Commercial Operators
By Price Tier
Entry-Level (< AUD 15,000)
Mid-Market (AUD 15,000 – 30,000)
Upper-Mid Segment (AUD 30,000 – 50,000)
Premium (AUD 50,000 – 80,000)
Luxury & Prestige (> AUD 80,000)
By Region
New South Wales
Victoria
Queensland
Western Australia
South Australia
Tasmania
Northern Territory
Australian Capital Territory
Players Mentioned in the Report:
Eagers Automotive / easyauto123
Peter Warren Automotive Holdings
Autosports Group
OzCar
Westside Auto Wholesale
Tony White Group (TWG)
Dutton Group (Dutton Garage / Dutton One)
CAR Group / carsales
Autotrader Australia
CarsGuide
Pickles
Manheim (Cox Automotive Australia)
Grays
Autorola Australia
AutoFlip
Key Target Audience
Large and medium Dealership Groups looking to optimize used-car retail strategies
Automotive Marketplace Platforms seeking competitive benchmarking
Fleet & Lease Remarketers aiming to enhance disposal efficiency
Vehicle Financing & Insurance Providers targeting F&I growth
Logistics & Inspection Services optimizing used vehicle distribution
Technology & Valuation Providers enabling digital retailing
Investments and Venture Capitalist Firms
Government and Regulatory Bodies
Time Period:
Historical Period: 2019-2024
Base Year: 2025
- Forecast Period: 2025-2030
Report Coverage
Choose individual sections to purchase. Mix and match as you like.
4.1. Delivery Model Analysis for Used Vehicle Sales-Online, Blended, In-Person Showroom, Auction/Wholesale [margins, preference, strengths & weaknesses]
4.2. Revenue Streams for Used Automobiles Market [retail sales, wholesale, F&I, warranties, logistics, subscription models]
4.3. Business Model Canvas for Used Automobile Market [customer segments, value proposition, channels, key resources, partnerships, cost structure, revenue streams]
5.1. Independent Dealers vs. Franchised Dealer Groups [market share, pricing, reconditioning capabilities]
5.2. Investment Models in Used Automobiles Market [dealer-owned inventory, consignment, asset-light digital-first]
5.3. Comparative Analysis of Sourcing & Funnelling by Auctions vs. Marketplaces vs. Dealers
5.4. Consumer Spending & Budget Allocation for Used Automobiles by Household Income Brackets
8.1. Revenues (AUD Bn), 2019-2024
9.1. By Market Structure (Dealer Sales, Auction Sales, Online-First, Private-to-Dealer)
9.2. By Vehicle Type (Hatchback, Sedan, SUV, Ute, Van/LCV, Prestige/Exotic)
9.3. By Powertrain (Petrol ICE, Diesel, Hybrid, Plug-in Hybrid, EV)
9.4. By Vehicle Age & Kilometres (Near-New, Mid-Life, Late-Life, High-Km Legacy)
9.5. By Buyer Type (Retail Individual, Small Business, Fleet Replacement, Rideshare/Commercial)
9.6. By Price Tier (Entry-Level, Mid-Market, Upper-Mid, Premium, Luxury)
9.7. By Region (NSW, VIC, QLD, WA, SA, TAS, NT, ACT)
10.1. Buyer Landscape and Cohort Analysis [millennial buyers, downsizers, commercial buyers, EV adopters]
10.2. Decision-Making Process [vehicle discovery, instant offers, dealer vs. marketplace funnel]
10.3. Ownership ROI Analysis [depreciation, warranty claims, finance burden, resale potential]
10.4. Gap Analysis Framework [consumer expectations vs. actual service delivery]
11.1. Trends and Developments [end-to-end online sales, instant offers, subscription models, EV remarketing]
11.2. Growth Drivers [migration, household formation, affordability pressures, fleet defleeting]
11.3. SWOT Analysis for Used Automobiles Market
11.4. Issues and Challenges [odometer fraud, compliance cost, hail/flood-damaged vehicles, logistics delays]
11.5. Government Regulations [ACL statutory warranties, PPSR/NEVDIS checks, SEVS/RVS import pathways, state-level roadworthy requirements]
12.1. Market Size and Future Potential for Online Used Vehicle Sales
12.2. Business Model and Revenue Streams of Digital-First Players
12.3. Delivery Models and Value-Add Services [home delivery, instant buy, return/exchange windows]
12.4. Cross-Comparison of Leading Online Platforms (carsales, Autotrader, CarsGuide, AutoFlip) based on: (Company Overview, Investment and Funding, Revenues, Listings & Sold Units, Revenue Streams, Pricing Models, Return/Exchange Policies, Strategic Partnerships)
15.1. Market Share of Key Players by Revenues, Listings, and Sales Volume
15.2. Benchmark of Key Competitors [Company Overview, USP, Strategies, Inventory Scale, Pricing Model, Finance/Insurance Penetration, Technology Adoption, Major Clients, Strategic Tie-ups, Recent Developments]
15.3. Operating Model Analysis Framework [reconditioning hubs, logistics, omnichannel retail]
15.4. Gartner Magic Quadrant-Dealer Groups vs. Online Platforms vs. Auction Houses
15.5. Bowmans Strategic Clock for Competitive Advantage
16.1. Revenues (AUD Bn), 2025-2030
17.1. By Market Structure (Dealer, Auction, Online-First, Private-to-Dealer)
17.2. By Vehicle Type (Hatchback, Sedan, SUV, Ute, Van/LCV, Prestige/Exotic)
17.3. By Powertrain (Petrol ICE, Diesel, Hybrid, Plug-in Hybrid, EV)
17.4. By Vehicle Age & Kilometres (Near-New, Mid-Life, Late-Life, High-Km)
17.5. By Buyer Type (Retail, Commercial, Fleet, Rideshare)
17.6. By Price Tier (Entry, Mid, Premium, Luxury)
17.7. By Region (NSW, VIC, QLD, WA, SA, TAS, NT, ACT)
Research Methodology
Step 1: Ecosystem Creation
We begin by mapping the ecosystem of the Australia Used Automobiles Market, identifying all demand-side and supply-side entities. On the supply side, this includes franchised dealer groups, independent dealers, online marketplaces, auctions, fleet and lease remarketers, and government disposal agencies. On the demand side, it encompasses individual buyers, SMEs, rideshare/commercial operators, and financiers/insurers supporting transactions. Based on this ecosystem, we shortlist 5–6 leading market participants (dealer groups, auction houses, and digital marketplaces) on the basis of their financial strength, inventory turnover, regional reach, and customer base. Sourcing at this stage is conducted through industry articles, government portals (ACCC, ABS, FCAI), and proprietary databases to collate macro and micro-level industry information.
Step 2: Desk Research
We then engage in an exhaustive desk research process using diverse secondary and proprietary databases. This enables a comprehensive analysis of the market by aggregating data such as vehicle parc statistics, transaction volumes, and supply pipelines. We evaluate industry dynamics including the number of active dealerships, auction clearances, pricing frameworks, reconditioning models, and finance penetration. In parallel, we examine company-level data, referencing press releases, financial statements, and annual reports of major players like Eagers Automotive, carsales.com.au, and Pickles. This establishes a baseline understanding of both the market and the operational strategies of key entities active in the ecosystem.
Step 3: Primary Research
Following desk research, we conduct a series of in-depth interviews with C-level executives and stakeholders representing dealer groups, marketplace platforms, auction operators, financiers, insurers, and end-users. This stage validates initial hypotheses, authenticates statistical inputs, and extracts critical operational and financial insights directly from practitioners. A bottom-up approach is employed to evaluate revenue contributions per player, which is then aggregated to assess the broader market. As part of validation, we conduct disguised interviews under the guise of potential buyers, enabling us to cross-verify operational and financial data shared by executives. This provides an accurate lens into revenue streams, value chains, inventory acquisition methods, pricing dynamics, and compliance processes within the used vehicle market.
Step 4: Sanity Check
To conclude, both bottom-up and top-down modeling exercises are executed to validate market size and growth calculations. This dual-layered sanity check ensures consistency between aggregated company-level financials, macro-level transaction data, and government statistics. The result is a highly robust and credible representation of the Australia Used Automobiles Market.
FAQs
01 What is the potential for the Australia Used Automobiles Market?
The Australia Used Automobiles Market is positioned for sustained growth, valued at USD 28.3 billion in 2023 according to government-linked datasets and industry publications. The market’s potential is reinforced by macroeconomic pressures such as higher household living costs, which reached a 15% increase between mid-2022 and mid-2024 (Australian Parliamentary analysis), and the rising demand for affordable mobility solutions. Alongside these trends, the growing digitalisation of retail transactions and expansion of certified pre-owned programs are unlocking new consumer segments, highlighting the market’s capacity to remain a dominant pillar of Australia’s automotive ecosystem.
02 Who are the Key Players in the Australia Used Automobiles Market?
The Australia Used Automobiles Market features a diverse mix of dealer groups, auction houses, and digital platforms. Prominent players include Eagers Automotive (easyauto123), Peter Warren Automotive Holdings, Autosports Group, OzCar, and Tony White Group. On the marketplace side, companies like carsales.com.au, Autotrader, and CarsGuide hold strong digital footprints, while Pickles, Manheim, and Grays dominate the auction ecosystem. Prestige and niche operators such as Dutton Group also play a key role. These firms collectively shape the competitive landscape through national dealer networks, integrated financing, logistics infrastructure, and technological investments in AI-driven pricing and inspections.
03 What are the Growth Drivers for the Australia Used Automobiles Market?
Growth in the Australia Used Automobiles Market is being driven by a confluence of macroeconomic and industry factors. A major driver is the rise in cost-of-living expenses, which redirects consumers toward affordable used vehicles. Strong migration inflows of 536,000 net overseas arrivals in 2022–23 (Australian Bureau of Statistics) and the decline in average household size to 2.5 persons (RBA) further expand demand for accessible mobility options. At the same time, new-vehicle delivery lead times exceeding 150 days (Deloitte) channel buyers into the used vehicle segment. Together, these dynamics sustain robust and broad-based demand for pre-owned automobiles.
04 What are the Challenges in the Australia Used Automobiles Market?
The market faces multiple structural challenges. Depreciation volatility, particularly in electrified vehicles where two- to four-year-old EVs retain just 57.6% of original value (Yahoo Finance AU), creates uncertainty for both dealers and buyers. Compliance costs, ranging from AUD 2,000–3,000 per imported unit (First AML), place margin pressure on businesses managing imports. Additionally, statutory warranties—such as Victoria’s mandatory 3-month/5,000 km coverage (Consumer Affairs Victoria)—require significant reconditioning investments. These hurdles, combined with heightened warranty claim exposure and the administrative burden of PPSR and NEVDIS checks, underscore the operational and financial challenges that weigh on the sector’s expansion.