Finland Logistics and Warehousing Market Outlook to 2029
By Mode of Freight, Type of Warehousing, End-User Industry, Ownership Model, and Region
Report Overview
Report Code
TDR0208
Coverage
Europe
Published
July 2025
Pages
80
Flexible Purchase Options
Select and purchase only the chapters you need for your strategic decisions
On This Page
Report Overview
The report titled “Finland Logistics and Warehousing Market Outlook to 2029 – By Mode of Freight, Type of Warehousing, End-User Industry, Ownership Model, and Region” provides a comprehensive analysis of the logistics and warehousing sector in Finland. The report covers an overview and genesis of the industry, overall market size in terms of revenue, market segmentation; trends and developments, regulatory landscape, customer level profiling, issues and challenges, and comparative landscape including competition scenario, cross-comparison, opportunities and bottlenecks, and company profiling of major players in the logistics and warehousing ecosystem.
Report Coverage
Verified Market Sizing
Multi-layer forecasting with historical data and 5–10 year outlook
Deep-Dive Segmentation
Cross-sectional analysis by product type, end user, application and region
Competitive Benchmarking & Positioning
Market share, operating model, pricing and competition matrices
Actionable Insights & Risk Assessment
High-growth white spaces, underserved segments, technology disruptions and demand inflection points
Review Methodology & Data Structure
Preview report structure, data sources and research framework
Executive Summary
The report titled “Finland Logistics and Warehousing Market Outlook to 2029 – By Mode of Freight, Type of Warehousing, End-User Industry, Ownership Model, and Region” provides a comprehensive analysis of the logistics and warehousing sector in Finland. The report covers an overview and genesis of the industry, overall market size in terms of revenue, market segmentation; trends and developments, regulatory landscape, customer level profiling, issues and challenges, and comparative landscape including competition scenario, cross-comparison, opportunities and bottlenecks, and company profiling of major players in the logistics and warehousing ecosystem. The report concludes with future market projections based on revenue, by segment, by freight mode, end-user sector, regional analysis, and success case studies highlighting the key opportunities and risks.
Finland Logistics and Warehousing Market Overview and Size
The Finland logistics and warehousing market reached a valuation of EUR 6.5 Billion in 2023, supported by robust trade flows, strategic geographic positioning as a gateway to Northern Europe, and increasing e-commerce penetration. The market is marked by key logistics players such as DB Schenker, Kuehne + Nagel, Posti, DHL, and Nurminen Logistics, known for their integrated supply chain offerings, advanced warehouse automation, and efficient last-mile delivery networks.
In 2023, Posti Group introduced a smart warehousing solution to cater to rising e-commerce order fulfillment in Helsinki and nearby regions. The adoption of robotics and IoT-enabled asset tracking has enhanced operational efficiency and improved inventory management across temperature-controlled and general cargo warehouses.
The southern region of Finland, particularly Helsinki, Espoo, and Vantaa, serve as major logistics hubs due to their proximity to international ports, airports, and cross-border trucking routes with Sweden, Russia, and the Baltics.
Market Size for Finland Logistics and Warehousing Industry on the Basis of Revenue in USD Billion, 2018-2024

What Factors are Leading to the Growth of Finland Logistics and Warehousing Market:
Strategic Location & Trade Connectivity: Finland serves as a vital gateway between Western Europe, Russia, and the Baltic states. Its well-integrated transport infrastructure—featuring over 20 major ports, extensive rail corridors, and cross-border trucking lanes—positions it as a critical logistics hub for regional and international freight.
Growth of E-Commerce and Last-Mile Delivery: Online retail has surged by 17% year-on-year in 2023, creating increased demand for fulfillment centers and express logistics services. Urban warehouses are being repurposed for same-day delivery capabilities in cities like Helsinki and Tampere, while companies are investing in AI-driven route optimization to manage rising parcel volumes.
Sustainability and Green Logistics: With Finland targeting carbon neutrality by 2035, logistics firms are investing in electric trucks, carbon tracking software, and sustainable packaging solutions. Government incentives and EU-backed funding have accelerated the adoption of low-emission transport fleets and energy-efficient warehousing designs.
Which Industry Challenges Have Impacted the Growth for Finland Logistics and Warehousing Market
High Operating Costs and Labor Shortages: Finland faces some of the highest logistics operating costs in Europe due to high labor expenses, fuel prices, and cold climate energy requirements. In 2023, operational costs for warehouse facilities rose by 12% year-on-year, driven by increasing energy tariffs and wage inflation. Moreover, logistics companies are experiencing a significant shortage of skilled warehouse and transportation labor, especially in remote regions, which has hampered service levels and scalability.
Fragmented Infrastructure in Remote Areas: While southern Finland is well-connected, logistics infrastructure in northern and eastern regions remains underdeveloped, leading to delays, higher last-mile delivery costs, and limited warehousing penetration. In Lapland and Kainuu, for instance, average delivery lead times are 1.7x higher compared to the Helsinki region, impacting service efficiency for retail and industrial clients.
Cross-Border Regulatory Complexities: As Finland shares borders with Russia, Sweden, and Norway, cross-border compliance with EU and non-EU logistics regulations creates delays and uncertainty. Customs processing times on the eastern border have increased by 23% post-2022, especially due to geopolitical tensions and increased inspections, affecting the reliability of international freight routes.
What are the Regulations and Initiatives which have Governed the Market
EU Green Freight Standards and Emission Mandates: Under EU directives, logistics companies operating in Finland must comply with the EU Green Deal, aiming for carbon neutrality by 2050. Finland has aligned with these mandates through national policies requiring emission reporting, fuel efficiency targets, and electrification of fleets. In 2023, over 60% of logistics firms in Finland began reporting carbon footprints as part of mandatory ESG disclosures.
Logistics Digitization and Smart Infrastructure Programs: The Finnish Ministry of Transport and Communications launched the “Smart Logistics Finland” initiative in 2022, promoting digitization of supply chains through government-backed funding for warehouse automation, digital freight corridors, and IoT-enabled infrastructure. Over €80 million has been allocated to upgrade logistics clusters in Helsinki, Turku, and Tampere by 2025.
Tax Benefits and Support for Sustainable Warehousing: To encourage green warehousing, the Finnish government offers tax deductions and subsidies for warehouses adopting solar panels, LED lighting, and energy-efficient HVAC systems. In 2023, over 35% of newly constructed warehouses in Finland qualified as “low-carbon certified” facilities under the national green building standard (RT 38102).
Finland Logistics and Warehousing Market Segmentation
By Market Structure: Organized players dominate the market owing to their integration with international supply chains, technology-enabled operations, and compliance with EU safety and emissions regulations. Companies such as DHL, DB Schenker, and Posti Logistics lead this segment through their warehousing automation, freight optimization tools, and multimodal service offerings. Unorganized players, while smaller in scale, continue to serve localized needs such as short-distance transport and small-scale storage, especially in rural and less urbanized parts of Finland.
By Mode of Freight: Road freight continues to hold the largest share of the logistics market due to its extensive reach, flexibility, and efficiency in connecting major ports and cities such as Helsinki, Turku, and Tampere. Sea freight follows, driven by Finland’s active ports and international trade volume. Rail freight plays a prominent role in bulk transport, particularly for industries like forestry and metals, while air freight, though smaller in volume, serves high-value and time-sensitive cargo.
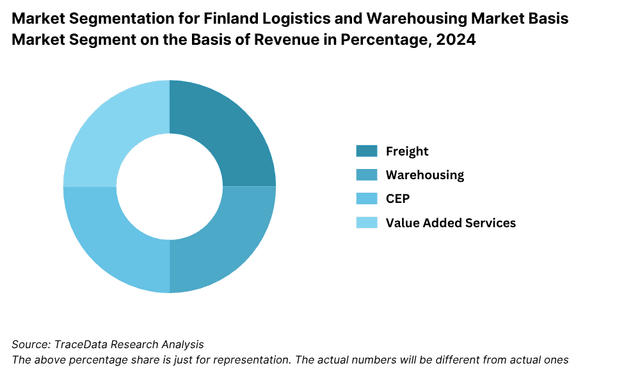

By Type of Warehousing: General-purpose warehousing forms the bulk of the warehousing landscape in Finland, supporting industries like electronics, machinery, and retail. Cold storage warehousing is gaining momentum due to growing demand from the food processing and pharmaceutical sectors. Bonded and customs warehouses, especially near ports, support international trade and cargo consolidation, catering to import-export companies.
Competitive Landscape in Finland Logistics and Warehousing Market
The Finland logistics and warehousing market is moderately consolidated, with several established domestic and international logistics players operating across freight, storage, and last-mile delivery segments. Companies such as Posti Group, DB Schenker, Kuehne + Nagel, DHL Supply Chain, and Nurminen Logistics dominate the market. However, the growth of specialized cold chain providers, automation-focused startups, and regional warehousing firms is gradually diversifying the landscape and increasing competition.
Company Name | Founding Year | Original Headquarters |
Posti Group (Itella Logistics) | 1638 | Helsinki, Finland |
DB Schenker Finland | 1872 (FI: ~1900s) | Essen, Germany |
Kuehne + Nagel Finland | 1890 (FI: ~1970s) | Schindellegi, Switzerland |
DHL Supply Chain / Freight Finland | 1969 (FI: ~1970s) | Bonn, Germany |
DSV Finland (formerly DFDS Transport) | 1976 (FI: ~1990s) | Hedehusene, Denmark |
Itella Transport (merged with Posti) | 2007 | Helsinki, Finland |
Nokian Tyres Logistics | 1988 | Nokia, Finland |
Bring Finland (part of Posten Norge) | 2008 (FI: ~2010s) | Oslo, Norway |
Matkahuolto Oy | 1933 | Helsinki, Finland |
Freja Transport & Logistics Oy | 1985 | Skive, Denmark (FI office in Vantaa) |
UPS Finland | 1907 (FI: ~1980s) | Atlanta, USA |
FedEx Express Finland | 1971 (FI: ~1990s) | Memphis, USA |
Nippon Express Finland Oy | 1937 (FI: ~2000s) | Tokyo, Japan |
Yusen Logistics Finland Oy | 1955 (FI: ~2010s) | Tokyo, Japan |
Maersk Finland (Cold & Container Logistics) | 1904 (FI: ~1990s) | Copenhagen, Denmark |
Some of the recent competitor trends and key information about competitors include:
Posti Group: As the national postal and logistics service provider, Posti Group handled over 54 million domestic parcels in 2023, with strong investment in AI-powered route optimization and sustainable packaging. Their expansion of temperature-controlled logistics in Helsinki and Tampere regions has supported the growing food and pharmaceutical sectors.
DB Schenker: Known for its multimodal logistics and warehousing capabilities, DB Schenker added 50,000 sq. meters of automated warehousing space in 2023 in Southern Finland. Their new Helsinki logistics hub, integrated with IoT and robotics, aims to reduce order processing times by 30%.
Kuehne + Nagel: A leader in global freight forwarding, Kuehne + Nagel strengthened its footprint in Finland through digital freight platforms and warehouse digitization projects. The company reported a 12% year-on-year increase in contract logistics revenue from Finnish manufacturing and electronics clients.
DHL Supply Chain: DHL is investing heavily in green logistics, with a fleet of electric trucks deployed in metropolitan areas like Helsinki and Turku. Their new 2023 initiative—“Zero Emission Warehousing”—targets full decarbonization of select facilities by 2026.
Nurminen Logistics: Specializing in rail logistics and industrial warehousing, Nurminen expanded eastbound freight services toward Asia despite geopolitical disruptions. In 2023, they launched a new direct rail service from Finland to China, increasing transit capacity by 20% for electronics and heavy machinery.
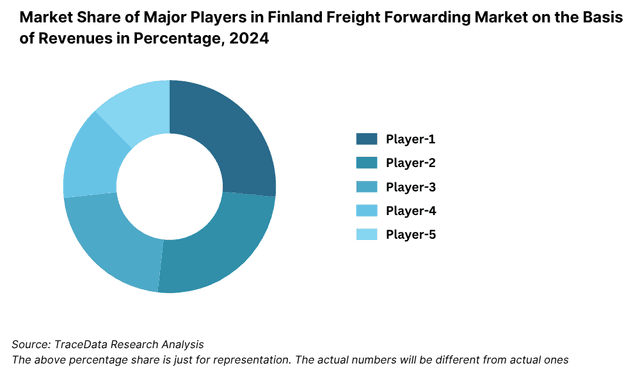
Market Share of Major Players in Finland Freight Forwarding Market on the Basis of Revenues in Percentage, 2024
What Lies Ahead for Finland Logistics and Warehousing Market?
The Finland logistics and warehousing market is projected to witness stable growth through 2029, with a moderate yet consistent CAGR anticipated over the forecast period. This growth will be supported by rising cross-border trade, increasing demand from the e-commerce sector, and national investments in digital and sustainable infrastructure.
Expansion of Green Logistics and Electrification: As Finland accelerates its journey toward carbon neutrality by 2035, logistics players are expected to adopt greener practices, including electrified transport fleets, solar-powered warehouses, and low-emission packaging. Government-backed incentives and EU funding will continue to support the deployment of sustainable logistics models, especially in urban freight and cold chain operations.
Adoption of Automation and Robotics: The adoption of automation, AI-driven warehouse management systems, and robotics is expected to gain significant traction in the coming years. These technologies will drive improvements in inventory accuracy, labor productivity, and real-time order tracking. Warehousing operators will increasingly invest in smart shelves, autonomous forklifts, and predictive analytics to enhance operational efficiency.
Rise of Urban Micro-Fulfillment Centers: To meet growing same-day and next-day delivery expectations, particularly in high-density cities like Helsinki and Espoo, logistics companies are likely to establish micro-fulfillment hubs closer to consumers. These compact, technology-enabled warehouses will play a key role in reshaping last-mile delivery and reducing transportation lead times.
Increased Integration of Digital Freight Platforms: Digital freight matching, AI-based pricing engines, and real-time cargo tracking will redefine freight transport in Finland. These platforms will reduce empty miles, improve vehicle utilization, and offer transparent freight pricing to clients. The digitization trend is set to benefit SMEs and regional shippers seeking cost-effective logistics solutions.
Future Outlook and Projections for Finland Logistics and Warehousing Market on the Basis of Revenues in USD Billion, 2024-2029

Finland Logistics and Warehousing Market Segmentation
• By Market Structure:
o Organized Sector
o Unorganized Sector
o Regional Freight Forwarders
o National 3PL Providers
o Global Logistics Companies
o Public Warehousing
o Contract Warehousing
• By Mode of Freight:
o Road Freight
o Rail Freight
o Sea Freight
o Air Freight
o Multimodal Transport
• By Type of Warehousing:
o General Warehousing
o Cold Storage Warehousing
o Bonded Warehousing
o Automated Warehousing
o E-commerce Fulfillment Centers
o Micro-Fulfillment Centers
• By End-User Industry:
o Retail and E-commerce
o Automotive
o Food and Beverages
o Pharmaceuticals
o Electronics and Machinery
o Chemicals
o Forestry and Paper
• By Ownership Model:
o Own Facility
o Leased Facility
o Shared Warehousing
• By Region:
o Southern Finland (Helsinki, Espoo, Vantaa)
o Western Finland (Turku, Tampere)
o Eastern Finland (Joensuu, Kuopio)
o Northern Finland (Oulu, Lapland)
Players Mentioned in the Report:
Freight Forwarding Companies
- Agility Logistics
- Expeditors Finland Oy
- GEODIS
- DSV Air & Sea Oy
- DHL Global Forwarding
- Nippon Express (APC Logistics Finland)
- Panalpina
- SVH Finland
- MM Cargo Solutions
- Scan Global Logistics
- KWH Group (KWH Logistics / Backman-Trummer)
- Blue Water Finland
- Varova
- K-Express Oy
- NTG Road Oy
- Fernfracht
Warehousing Companies
- Rhenus Finland
- DB Schenker
- Kuehne + Nagel
- Americold Finland (part of Americold network)
- Spedman Group
- NTG Road Oy
- Hacklin Hamiko
- Avind International Oy
- Cargo Connexion
- WCARGO
E‑Commerce Logistics Companies
- HUB Logistics (HUB)
- 3PLogistiikka
- Colligx (e‑commerce logistics)
- ShipBob
- Axla Logistics
- DB Schenker e‑commerce services
- Posti Group (Sparta e‑Commerce)
Express Logistics Companies
- DHL Express
- UPS
- FedEx
- TNT
- HUGO Express Oy
Key Target Audience:
• Logistics and Freight Forwarding Companies
• Warehousing Operators
• E-commerce and Retail Businesses
• Manufacturing and Export Firms
• Cold Chain Providers
• Technology Providers (WMS, TMS, IoT)
• Government and Regulatory Bodies (e.g., Finnish Transport and Communications Agency)
• Investment and Infrastructure Planning Agencies
Time Period:
• Historical Period: 2018–2023
• Base Year: 2024
• Forecast Period: 2024–2029
Explore Flexible Purchase Options or Have Limited Budget?
Pay only for relevant chapters • Customizable report sections
Table of Contents
Choose individual sections to purchase. Mix and match as you like.
4.1. Macroeconomic framework for Finland Including GDP (2018-2024), GDP Growth (2018-2024), GDP Contribution by Sector
4.2. Logistics Sector Contribution to GDP and how the contribution has been changing in the historical assessment
4.3. Ease of Doing Business in Finland
4.4. LPI Index of Finland and Improvements in the last 10-15 Years
4.5. Custom Procedure and Custom Charges in Finland Logistics market
5.1. Landscape of Investment Parks and Free Trade Zones in Finland
5.2. Current Scenario for Logistics Infrastructure in Finland
5.3. Road Infrastructure in Finland including Road Network, Toll Charges and Toll Network, Major Goods Traded through Road, Major Flow Corridors for Road (Inbound and Outbound)
5.4. Air Infrastructure in Finland including Total Volume Handled, FTK for Air Freight, Major Inbound and Outbound Flow Corridors, Major Goods traded through Air, Number of Commercial and passenger Airports, Air Freight Volume by Ports and other Parameters
5.5. Sea Infrastructure in Finland including Total Volume Handled, FTK for Sea Freight, Major Inbound and Outbound Flow Corridors, Major Goods Traded through Sea, Number of Ports for Coastal and Ocean Freight, Number of Vessels, Sea Freight Volume by Ports and other Parameters
5.6. Rail Infrastructure in Finland including Total Volume Handled, FTK for Rail Freight, Major Inbound and Outbound Flow Corridors, Major Goods Traded through Rail and others
6.1. Basis Revenues, 2018-2024P
7.1. By Segment (Freight Forwarding, Warehousing, CEP and Value-Added Services), 2018-2024P
7.2. By End User Industries, 2018-2024P
8.1. Market Overview and Genesis
8.2. Finland Freight Forwarding Market Size by Revenues, 2018-2024P
8.3. Finland 3PL Freight Forwarding Market Segmentation, 2018-2024P
8.3.1. By Mode of Freight Transport (Road, Sea, Air and Rail), 2018-2024P
8.3.1.1. Price per FTK for Road/Air/Sea and Rail in Finland
8.3.1.2. Road Freight (Domestic and International Volume, FTK and Revenue; Number of Registered Vehicles)
8.3.1.3. Road Freight Domestic and International Corridors
8.3.1.4. Ocean Freight (Domestic and International Volume, FTK and Revenue; Volume by Commodity; Sea Ports Key Statistics)
8.3.1.5. Air Freight (Domestic and International Volume, FTK and Revenue)
8.3.1.6. Rail Freight (Domestic and International Volume, FTK and Revenue; Volume by Commodity and Region)
8.3.1.7. Export-Import Scenario (Value by Mode of Transport, Commodity and Country; Volume by Principal Commodities)
8.3.2. By Intercity Road Freight Corridors, 2018-2024P
8.3.3. By International Road Freight Corridors, 2018-2024P
8.3.4. By End User (Industrial, FMCG, F&B, Retail and Others), 2018-2024P
8.4. Snapshot of Freight Truck Aggregators in Finland Including Company Overview, USP. Business Strategies, Future Plans, Business Model, Number of Fleets, Margins/Commission, Number of Booking, Major Clients, Average Booking Amount, Major Routes and others
8.5. Competitive Landscape in Finland Freight Forwarding Market, 2021
8.5.1. Heat Map of Major Players in Finland Freight Forwarding on the Basis of Service offering
8.5.2. Market Share of Maior Players in Finland Freight Forwarding Market, 2023
8.5.3. Cross Comparison of Major Players in Freight Forwarding Companies on the Basis of Parameters including Volume of Road Freight, Inception Year, Number of Fleets (Owned and Subcontracted), Fleets by Type, Occupancy Rate, Number of Employees, Major Route Network, Major Clients, Revenues, Volume of Sea Freight, Volume of Air Freight, USP, Business Strategy, Technology, (2023)
8.6. Finland 3PL Freight Forwarding Future Market Size by Revenues, 2025-2029
8.7. Finland Freight Forwarding Market Segmentation, 2025-2029
8.7.1. Future Market Segmentation by Mode of Freight Transport (Road, Sea, Air and Rail), 2025-2029
8.7.2. Future Market Segmentation by International Road Freight Corridors (China, Finland and Finland), 2025-2029
8.7.3. Future Market Segmentation by End User (Industrial, FMCG, F&B, Retail and Others), 2025-2029
9.1. Market Overview and Genesis
9.2. Value Chain Analysis in Finland Warehousing Market including entities, margins, role of each entity, process flow, challenges and other aspects
9.3. Finland Warehousing Market Size on the Basis of Revenues and Warehousing Space, 2018-2024P
9.4. Finland 3PL Warehousing Segmentation
9.4.1. Finland Warehousing Revenue by Business Model (Industrial/Retail, ICD/CFS and Cold Storage), 2018-2024P
9.4.2. Finland Warehousing By Type of Warehouse (General, Open Yard, Freezer/Chiller, Ambient and Bonded Warehouses), 2018-2024P
9.4.3. Finland Warehousing Revenue by End User (Industrial & Construction, FMCG, Retail, Food & Beverage and Others), 2018-2024P
9.4.4. 3PL Warehousing Space by Region, 2024P
9.5. Competitive Landscape in Finland 3PL Warehousing Market
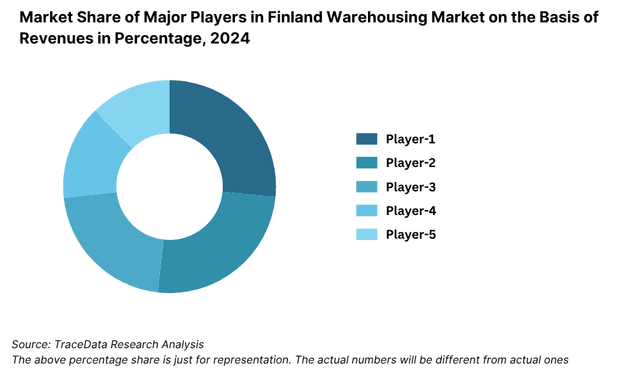
9.5.1. Market share of Top 10 Companies in Finland Warehousing Market, 2023
9.5.2. Cross Comparison of Top 10 3PL Warehousing Companies on the Basis of Parameters including Company Overview, USP, Business Strategy, Future Plans, Technology, Revenues from Warehousing, Number of Warehouses, Warehousing Space, Location of Warehouses, Type of Warehouses, Occupancy Rate, Rental Rates, Clients and others, (2023)
9.6. Finland Warehousing Future Market Size on the Basis of Revenues, 2025-2029
9.7. Finland Warehousing Market Future Segmentation
9.7.1. Finland Warehousing Revenue by Business Model (Industrial/Retail, ICD/CFS and Cold Storage), 2025-2029
9.7.2. Finland Warehousing Revenue By Type of Warehouse (General, Open Yard, Freezer/Chiller, Ambient and Bonded Warehouses), 2025-2029
9.7.3. Finland Warehousing Revenue by End User (Industrial & Construction, FMCG, Retail, Food & Beverage and Others), 2025-2029
10.1. Market Overview and Genesis
10.2. Value Chain Analysis in Finland CEP Market including entities, margins, role of each entity, process flow, challenges and other aspects
10.3. Revenue Composition and Contribution Between First Mile/Mid Mile and Last Mile Delivery-Analysis for Domestic and International Shipments
10.4. Finland CEP Market Size on the Basis of Revenues and Shipments, 2018-2024P
10.5. Finland CEP Market Segmentation, 2021
10.5.1. Segmentation by Mails and Documents, E-Commerce Shipments and Express Cargo, 2023-2024P
10.5.2. Segmentation by International and Domestic Express, 2023-2024P
10.5.3. Segmentation by B2B, B2C and C2C, 2023-2024P
10.5.4. Segmentation by Period of Delivery, 2023-2024P
10.6. Competitive Landscape in 3PL Market, 2021
10.6.1. Overview and Genesis, Market Nature, Market Stage and Major Competing Parameters
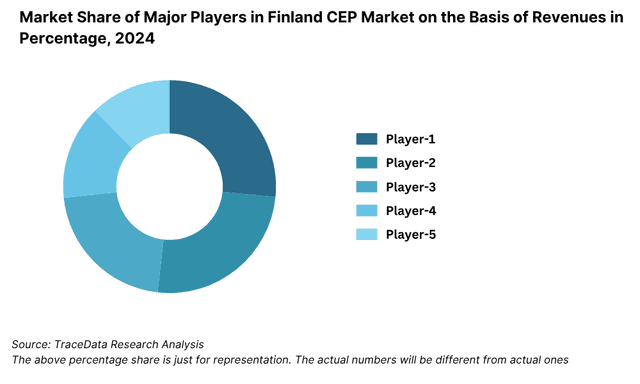
10.6.2. Market Share of Companies in Finland CEP Market on the Basis of Revenues/Number of Shipments, 2023
10.6.3. Market Share of Top 5 Companies in Finland E-Commerce Shipment Market on the Basis of Revenues/Number of Shipments, 2023
10.6.4. Cross Comparison of Top 10 Finland CEP Companies on the Basis of Parameters including Company Overview, USP, Business Strategy, Future Plans, Technology, Number of last Mile Delivery Shipments, Revenues, Major Clients, Number of Fleets, Number of Employees, Number of Riders, Number of Pin Code Served, Major Service Offering and others
10.7. Finland CEP Market Size on the Basis of Revenues and Shipments, 2025-2029
10.8. Finland CEP Market Segmentation
10.8.1. Segmentation by Mails and Documents, E-Commerce Shipments and Express Cargo, 2025-2029
10.8.2. Segmentation by International and Domestic Express, 2025-2029
10.8.3. Segmentation by B2B, B2C and C2C, 2025-2029
10.8.4. Segmentation by Period of Delivery, 2025-2029
11.1. Customer Cohort Analysis and End User Paradigm for Different Industry Verticals under Logistics Sector (Telecommunications, FMCG, Automotive, Apparel, F&B, Construction and Pharmaceuticals)
11.2. Understanding on Logistics Spend by End User, 2023-2024P
11.3. End User Preferences in terms of In-House or Outsourcing Logistics Services and Reason for Selection; Segregate this by Size of Company on the Basis of Revenues
11.4. Major Logistics Company who are Specialized in Serving Each Type of End User (Telecommunications, FMCG, Apparel, F&B, Construction and Pharmaceuticals)
11.5. Detailed Landscape of Each End Users across Parameters including Major Products Manufactured and Traded, Emerging Products, Type of Services Required, and Type of Services Outsourced, Major Companies, Contract Duration, Likelihood to Recommend, Market Orientation, Major Clusters, Type of Sourcing Preference, Pain Points, Facilities/Services Required, Future Outlook. Market Size for End User Industry Vertical with Growth Rate, 2018-2024P
12.1. Basis Revenues, 2025-2029
13.1. By Segment (Freight Forwarding, Warehousing, CEP and Value-Added Services), 2025-2029
13.2. By End User Industries, 2025-2029
13.3. Recommendation
13.4. Opportunity Analysis
Discuss a Customized Research Scope
Custom research scope • Tailored insights • Industry expertise
Research Methodology
Step 1: Ecosystem Creation
Map the ecosystem and identify all the demand side and supply side entities for the Finland Logistics and Warehousing Market. This includes freight forwarding firms, third-party logistics (3PL) providers, warehousing operators, cold chain service providers, technology vendors (e.g., WMS/TMS providers), and end-user industries such as e-commerce, pharmaceuticals, automotive, and manufacturing.
Sourcing is made through industry articles, government publications, logistics association reports, and multiple secondary and proprietary databases to perform desk research around the market and collate industry-level information. This step allows us to shortlist the leading 5–6 logistics and warehousing companies in Finland based on revenue, infrastructure footprint, fleet size, and technological capabilities.
Step 2: Desk Research
Subsequently, we engage in an exhaustive desk research process by referencing diverse secondary and proprietary databases. This approach enables us to conduct a thorough analysis of the market, aggregating industry-level insights related to freight volume, warehouse capacity, geographic distribution, pricing models, and regulatory developments.
We also study company-level data from sources such as press releases, annual reports, investor presentations, government filings, sustainability reports, and industry news portals. This process provides a foundational understanding of both market dynamics and key stakeholder operations.
Step 3: Primary Research
We initiate a series of in-depth interviews with C-level executives, operations managers, supply chain heads, and other stakeholders representing various logistics and warehousing firms, government authorities, trade associations, and end-user industries in Finland.
This interview process is conducted to validate market hypotheses, cross-check secondary data findings, and collect first-hand insights on capacity utilization, warehouse automation, pricing benchmarks, sustainability initiatives, and infrastructure gaps.
Bottom-to-top market sizing is undertaken by evaluating operational metrics (e.g., average shipment volume, warehouse turnover rate, cost per pallet/square meter) for each interviewed player and aggregating these inputs to estimate the overall market.
As part of our validation strategy, we also conduct disguised interviews by approaching companies as potential clients to verify the claims made by executives. These interactions allow us to gather transparent inputs on pricing, turnaround times, service quality, value-added services, and operational scale.
Step 4: Sanity Check
- Top-down and bottom-up market sizing models are reconciled using triangulation techniques and sanity checks. This process helps ensure accuracy and consistency of volume and revenue estimates for each logistics segment. Market projections are built using historical growth rates, macroeconomic indicators, trade activity trends, warehousing capacity additions, and policy-level developments.
See What's Inside the Report
Get a preview of key findings, methodology and report coverage
Frequently Asked Questions
The Finland logistics and warehousing market holds strong growth potential, reaching a valuation of EUR 6.5 Billion in 2023. This potential is supported by Finland’s strategic geographic location as a trade gateway to Northern and Eastern Europe, the growing demand for efficient last-mile delivery, and investments in digital and sustainable logistics infrastructure. Increasing e-commerce activity and expansion of cold chain logistics further contribute to the market's promising outlook through 2029.
The market is led by major international and domestic logistics providers including Posti Group, DB Schenker, DHL Supply Chain, Kuehne + Nagel, and Nurminen Logistics. These companies are recognized for their large-scale operations, multimodal logistics networks, and focus on technological integration. Other emerging players include DSV Finland, Bring Logistics, and Transval Group, who contribute to regional and specialized logistics services.
Key growth drivers include Finland’s position as a cross-border logistics hub, increasing e-commerce penetration, and the push toward green logistics and digital transformation. Government-led initiatives promoting smart warehousing, automated systems, and sustainable transportation solutions also play a significant role in expanding the market. Moreover, demand from industries like pharmaceuticals, food, electronics, and automotive continues to fuel growth across warehousing and freight segments.
The market faces several challenges including high operational costs, shortage of skilled labor, and fragmented infrastructure in remote regions. Additionally, cross-border regulatory complexities, particularly with non-EU neighbors, can hinder trade fluidity. Seasonal weather disruptions and increased compliance costs related to sustainability and digital mandates further present operational hurdles for logistics service providers.
License Options
PDF + Excel
Complete report package
$4,000
Excel Only
Data and analytics
$2,500
Custom Sections
Starts from $100
$0