India Adhesives Market Outlook to 2030
By Technology, By Chemistry, By End Use, By Substrate, By Distribution Channel, By Market Structure, and By Region
Report Overview
Report Code
TDR0312
Coverage
Asia
Published
September 2025
Pages
80
Flexible Purchase Options
Select and purchase only the chapters you need for your strategic decisions
On This Page
Report Overview
The report titled “India Adhesives Market Outlook to 2030 – By Technology, By Chemistry, By End Use, By Substrate, By Distribution Channel, By Market Structure, and By Region” provides a comprehensive analysis of the India adhesives industry. The report covers the overview and genesis of the industry; overall market size in revenue terms; detailed market segmentation; trends and developments; regulatory landscape; customer-level profiling; issues and challenges; and the competitive landscape including competition scenario, cross-comparison, opportunities and bottlenecks, and company profiling of major players.
Report Coverage
Verified Market Sizing
Multi-layer forecasting with historical data and 5–10 year outlook
Deep-Dive Segmentation
Cross-sectional analysis by product type, end user, application and region
Competitive Benchmarking & Positioning
Market share, operating model, pricing and competition matrices
Actionable Insights & Risk Assessment
High-growth white spaces, underserved segments, technology disruptions and demand inflection points
Review Methodology & Data Structure
Preview report structure, data sources and research framework
Executive Summary
The report titled “India Adhesives Market Outlook to 2030 – By Technology, By Chemistry, By End Use, By Substrate, By Distribution Channel, By Market Structure, and By Region” provides a comprehensive analysis of the India adhesives industry. The report covers the overview and genesis of the industry; overall market size in revenue terms; detailed market segmentation; trends and developments; regulatory landscape; customer-level profiling; issues and challenges; and the competitive landscape including competition scenario, cross-comparison, opportunities and bottlenecks, and company profiling of major players. The report concludes with future market projections based on application volumes and coat-weight norms, technology and chemistry mixes, regional demand patterns, and cause-and-effect relationships across macro drivers and regulatory shifts. Success case studies highlight specification-led wins, localization of key chemistries, channel transformation, and best-practice application engineering—surfacing the major opportunities and cautions for stakeholders through 2030.
India Adhesives Market Overview and Size
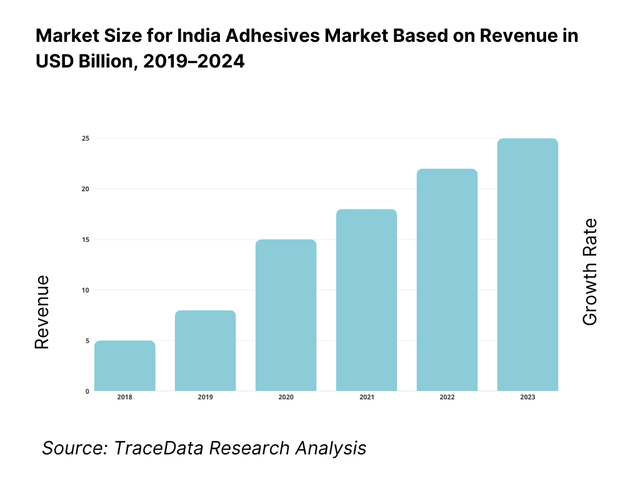
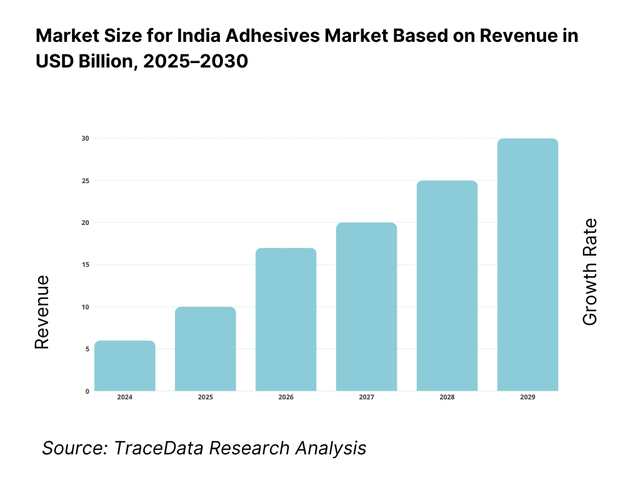
The India adhesives market is valued at approximately USD 3.40 billion, derived from a five-year historical analysis. This valuation reflects robust traction across end-use industries such as packaging, construction, automotive, and furniture, underpinned by rapid urbanization, infrastructure development, and expanding e‑commerce ecosystems.
Key regional dominance emerges in Western and Southern India, driven by strong industrial clusters, advanced manufacturing hubs, superior logistics infrastructure, and significant demand from packaging and automotive sectors. These regions also benefit from proximity to raw‑material sources and established distribution networks, reinforcing their leading positions in the adhesives market.
What Factors are Leading to the Growth of the India Adhesives Market:
Urban Infrastructure and Construction Boom: India’s gross fixed capital formation in construction reached INR 40,000 billion (40 trillion) in financial year 2022–23—a significant increase from INR 32,000 billion in 2020–21. Urban housing starts exceeded 1,200,000 units in FY 2022–23, up from 900,000 units two years earlier. These surges directly elevate demand for tile adhesives, sealants, and waterproofing products, driving adhesives consumption in building and construction sectors. Sustained infrastructure investments—defense roads, metros, industrial corridors—have further escalated demand for construction adhesives in civil and structural bonding applications, thereby amplifying industry growth.
Packaging and E-commerce Expansion: In 2023, India’s e-commerce gross merchandise value (GMV) surpassed USD 150 billion, up from USD 100 billion in 2021, while organized retail sales in FMCG grew to INR 12,000 billion, up from INR 9,000 billion two years prior. With parcel volumes reaching over 15 billion shipments annually, demand for carton-sealing, flexible-laminate, and pressure-sensitive adhesives has increased. This expansion in packaging industries—driven by online consumer behavior and modern retail chains—has cemented adhesives’ position as essential inputs in packaging and logistics.
Manufacturing and Auto Sector Revival: Manufacturing value-added in India rose to INR 38,000 billion in FY 2022–23, from INR 30,000 billion in FY 2020–21, while automobile production reached 5 million units in calendar year 2023—higher than 4 million units in 2021. Increased output in manufacturing and automotive sectors expands structural and specialty adhesive requirements—for example, in hemming, NVH applications, bonding lightweight panels, and electronic modules—boosting adhesives usage in OEM assembly lines and supply chains.
Which Industry Challenges Have Impacted the Growth of the India Adhesives Market:
Raw Material Price Volatility Amplified by Currency Fluctuations: India’s manufacturing PMI-linked cost pressures correlate with the Rupee’s depreciation: the INR valued roughly ₹83 to USD 1 in mid-2023, compared to ₹74 in early 2021. This depreciation elevates imported monomer feedstock costs (e.g., vinyl acetate monomer, isocyanates) since global oil-linked inputs surged, with Brent crude averaging USD 90 per barrel in 2023 versus USD 70 in 2021. Such spikes strain formulation margins and force price pass-through pressures, particularly for smaller formulators.
Environmental Compliance and VOC Regulations: Central Pollution Control Board (CPCB) mandates enforce maximum Volatile Organic Compound (VOC) emissions of 150 g/L for solvent-based adhesives in industrial clusters. Several State Pollution Control Boards require consent-to-operate checks for adhesive manufacturing plants with solvent emissions exceeding 200 tons per annum. The capital outlay for VOC-capture systems and compliance audits in 2023 averaged INR 50 million per plant, imposing cost burdens on formulators while compliance mechanisms remain complex.
Low Technical Awareness Among SMEs: In 2023, government MSME surveys revealed that only 35% of small-scale furniture and packaging enterprises had access to lab-based adhesive testing or training facilities, compared to 70% of larger enterprises. The deficiency in technical know-how regarding surface preparation, adhesive selection, and application methods leads to improper use, adhesive failures, and customer dissatisfaction. This lack of awareness limits formulators’ ability to shift demand toward performance-based, premium adhesive solutions.
What are the Regulations and Initiatives which have Governed the Market:
Bureau of Indian Standards (BIS) Certification: BIS implements mandatory certification for adhesives intended for construction and packaging. For example, adhesives for PVA wood bonding must comply with IS 4835 (type A/B), enforced via product license and factory inspections. In 2023, over 200 adhesive plants were audited, and 150 product licenses were renewed. Non-compliance can lead to product recalls and penalties, underscoring the criticality of BIS licensing for market access.
Food-Contact Packaging Regulatory Compliance: Adhesives used in food packaging must meet overall migration limits of 10 mg/dm², as per FSSAI packaging regulations. In 2023, FSSAI conducted over 500 site inspections and penalized firms violating migration limits exceeding 20 mg/dm². Adhesive formulators targeting food or pharma packaging must therefore maintain stringent testing protocols and certified compliance, impacting development costs and shelf-life validations.
Environmental Authorization via SPCB/CPCB: Adhesive manufacturing units require 'Consent to Establish' and 'Consent to Operate' from State Pollution Control Boards, if emissions exceed 100 kg/day of VOCs or generate effluent volumes above 5 m³/day. In 2023, such consents cost approximately INR 200,000 per year, and processing timelines ranged from 60 to 90 days. Compliance with SPCB norms on air and water emission levels is mandatory and non-negotiable; failure can result in plant shutdowns or prosecutions.
India Adhesives Market Segmentation
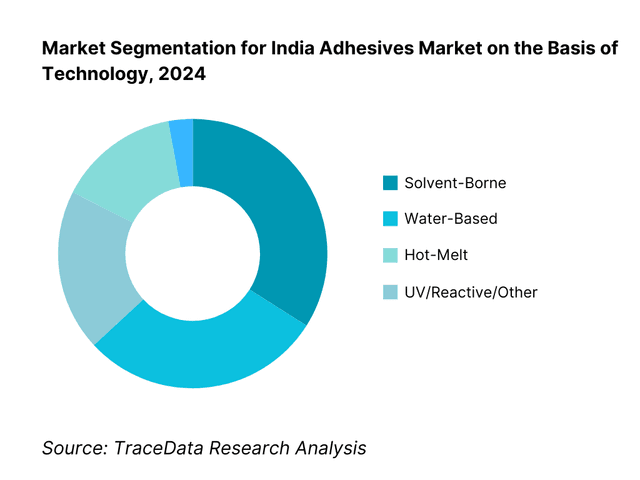
By Technology: The India adhesives market is segmented into solvent-borne, water-based, hot-melt, and UV/reactive/other technologies. Among these, the solvent-borne segment dominates with the largest share, as it offers superior bonding strength, rapid cure times, and versatility across diverse substrates such as metals and plastics. Its established usage across construction, automotive, and industrial applications, combined with extensive formulation maturity, contributes to its leading position. Water-based adhesives are growing steadily but remain behind due to cost and performance perceptions.
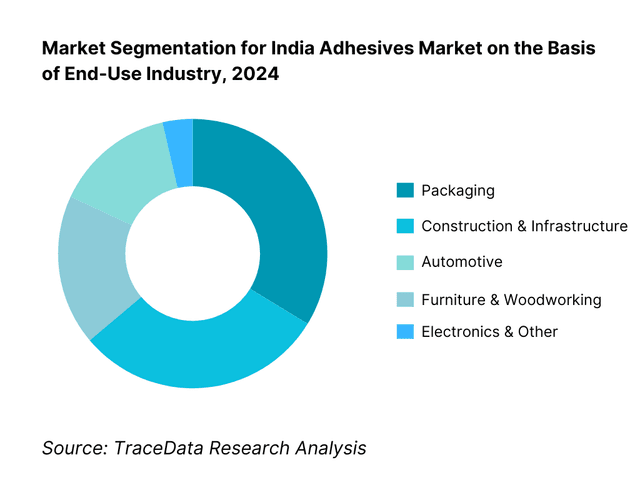
By End-Use Industry: The adhesives market is segmented by sector into packaging, construction & infrastructure, automotive, furniture & woodworking, and electronics & other industries. The packaging segment commands dominance, driven by booming e-commerce, growing FMCG demand, and modernization of supply chains that require high-performance adhesives for flexible and rigid formats. The rise in consumer packaged goods and logistics infrastructure further solidify its leadership.
Competitive Landscape in India Adhesives Market
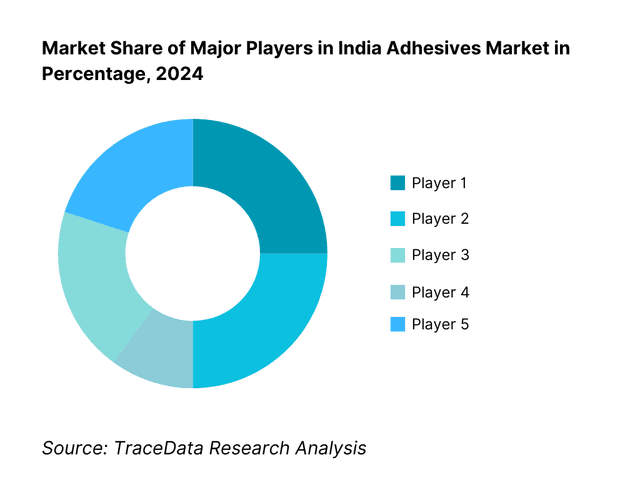
The India adhesives market is consolidated among a few large, diversified players with country-wide reach and deep technical capabilities. These firms exert considerable market influence through brand recognition, distribution networks, and product innovation.
Name | Founding Year | Original Headquarters |
Pidilite Industries Ltd. | 1959 | Mumbai, India |
Henkel AG & Co. KGaA | 1876 | Aachen, Germany |
H.B. Fuller Company | 1887 | St. Paul, Minnesota, USA |
Sika AG | 1910 | Zürich, Switzerland |
Bostik (Arkema) | 1889 | Chelsea, Massachusetts, USA |
3M Company | 1902 | Two Harbors, Minnesota, USA |
Avery Dennison Corporation | 1935 | Los Angeles, California, USA |
Huntsman Corporation (Adv. Materials) | 1970 | Fullerton, California, USA |
Astral Ltd. (Astral Adhesives) | 1996 | Ahmedabad, India |
Anabond Limited | 1979 | Chennai, India |
Jowat SE | 1919 | Detmold, Germany |
Mapei S.p.A. | 1937 | Milan, Italy |
Soudal NV | 1966 | Turnhout, Belgium |
The Dow Chemical Company | 1897 | Midland, Michigan, USA |
Chemline India Ltd. | 1990 | New Delhi, India |
Some of the Recent Competitor Trends and Key Information About Competitors Include:
Pidilite Industries Ltd.: As India’s largest adhesives manufacturer, Pidilite introduced eco-friendly formulations in its Fevicol and Dr. Fixit ranges in 2024, aligning with the increasing demand for sustainable construction and packaging solutions.
Henkel Adhesive Technologies India: Henkel strengthened its presence in industrial adhesives by expanding its application center in Pune in 2024, enabling faster prototyping and customized bonding solutions for automotive and electronics OEMs.
H.B. Fuller India: H.B. Fuller reported strong growth in the packaging adhesives segment in 2024, driven by the expansion of e-commerce and FMCG sectors, and launched new hot-melt adhesive grades tailored for high-speed flexible packaging lines.
Sika India Pvt. Ltd.: Known for construction and structural adhesives, Sika India expanded its product portfolio in 2024 to include high-performance tile adhesives and sealants, supporting the government’s housing and infrastructure development initiatives.
3M India Ltd.: 3M has seen rising adoption of its industrial tapes and structural adhesive systems in 2024, particularly in the automotive sector, where manufacturers are replacing traditional fasteners with lightweight bonding technologies.
What Lies Ahead for India Adhesives Market?
The India adhesives market is set to expand steadily over the next planning cycle, underpinned by three structural engines: infrastructure build-out (civil works, housing, metros), an e-commerce-led packaging surge across cartons, labels and flexible laminates, and ongoing localization of chemistries under Make-in-India. Rising use of lightweight materials in automotive and appliances, plus specification-driven procurement by large OEMs and EPC contractors, will keep value migrating to higher-performance systems (PUR hot-melts, structural epoxies, silyl-modified polymers, UV/EB). Sustainability mandates (low-VOC, food-contact compliance) further accelerate premium, water-borne and solvent-less adoption.
Rise of Hybrid Bonding Models: Application choices will increasingly blend mechanical fastening + structural bonding and hybrid chemistries (e.g., SMPs combining elastic sealing with strong adhesion). On packaging lines, converters will mix solvent-less laminating adhesives for speed with water-borne systems for specific barrier stacks; in construction, installers will pair tile adhesives with elastic sealants for movement joints; in transportation, hem-flange structural adhesives will complement rivets/spot-welds to improve crash performance and NVH. This “best-of-both” deployment raises reliability, reduces rework, and shortens takt times—key for capacity-constrained OEMs and contractors.
Focus on Outcome-Based Procurement: Large buyers will move from price-per-kg to performance-per-job metrics: peel/shear retention after humidity/heat ageing, open-time versus line speed, migration compliance for food packs, and total cost of ownership (less downtime, wastage, and warranty claims). Specification selling—backed by method statements, on-site trials, and quantified ROI—will decide vendor listings. Distributors and installers that can document bond quality with digital QA (batch traceability, application logs) will gain share, while commodity grades with inconsistent performance will be rationalized out of approved lists.
Expansion of Sector-Specific Solutions: Demand will deepen in flexible packaging (high-speed solvent-less lines, aluminum-free barrier stacks), building & construction (tile/flooring adhesives, waterproofing ancillaries, façade and glazing), automotive & EV (battery pack bonding, lightweight composites, NVH), woodworking & furniture (low-odor PVA/EVA and contact systems), electronics & appliances (SMT/underfill, thermal interface), and hygiene/medical (hot-melt PSAs). Each vertical requires tailored properties—heat/humidity resistance, dielectric strength, low fogging/odor, food-contact safety—pushing formulators toward specialized portfolios and technical service depth.
Leveraging Digital, AI & In-Line Analytics: Formulators and converters will deploy AI-assisted formulation to optimize resin/tackifier ratios for target peel/viscosity windows, while in-line sensors (temperature, coat-weight, web tension) and machine-learning models predict defects before they occur. Digital twins of coating/lamination lines will help set recipes for new substrates faster; mobile apps will guide installers on surface prep, nozzle choice, and cure profiles. Aggregated field data will feed rapid root-cause analysis, shrinking failure rates and elevating first-time-right metrics—directly improving customer economics and supplier stickiness.
India Adhesives Market Segmentation
By Technology
Water-based
Solvent-based
Hot-melt
Reactive / 2K
UV/EB-curable
Anaerobic / Cyanoacrylate
By Chemistry
Polyvinyl Acetate / EVA
Acrylics
Polyurethane
Epoxy
Cyanoacrylate (CA)
Silicone & SMP
Rubber-based
Anaerobic
By End-Use / Application
Packaging & Converting
Building & Construction
Woodworking & Furniture
Automotive & Transportation
Electronics & Electrical / Appliances
Footwear & Leather
Healthcare & Hygiene / Others
By Substrate
Paper & Paperboard (kraft, duplex, SBS)
Plastics & Films (PE, PP, PET, BOPP, PA, PVC)
Metals (steel, aluminum, coated sheets)
Wood & Wood-composites (MDF, plywood, particleboard, HPL)
Glass & Ceramics (tiles, glass façades)
Textiles & Leather (natural/synthetic)
Foams & Elastomers (PU, EPDM, EPE/EVA)
Electronics Materials (PCBs, heatsinks, housings)
By Packaging / Form Factor
Sachets & Tubes (consumer/retail)
Cartridges & Foil Sausages (sealants/constructive bonding)
Pails / Drums / IBCs (industrial bulk)
Pellets/Slats (HM) (hot-melt)
Jumbo Rolls / Logs (PSA) (labels & tapes)
Aerosol / Sprayable (contact/specialty use)
By Region
North (Delhi-NCR, Haryana, Punjab, UP)
West (Maharashtra, Gujarat, Goa)
South (Karnataka, Tamil Nadu, Telangana, Kerala)
East & North-East (West Bengal, Odisha, Assam, Meghalaya)
Central
Players Mentioned in the Report:
Pidilite Industries Ltd.
Henkel Adhesive Technologies India
H.B. Fuller India Pvt. Ltd.
Sika India Pvt. Ltd.
Arkema – Bostik India Pvt. Ltd.
3M India Ltd.
Avery Dennison India
Huntsman Advanced Materials India Pvt. Ltd.
Astral Ltd. (Astral Adhesives / Resinova)
Anabond Limited
Jubilant Agri & Consumer Products Ltd. (Jivanjor)
Dow Chemical International Pvt. Ltd.
Mapei Construction Products India Pvt. Ltd.
Soudal India Pvt. Ltd.
Chemline India Ltd.
Key Target Audience
C-suite Executives in Adhesives Manufacturing Firms
Investment and Venture Capitalist Firms
Government and Regulatory Bodies (e.g., Bureau of Indian Standards, Central Pollution Control Board, FSSAI)
Strategic Sourcing Teams in Packaging, Automotive, and Construction OEMs
Technology Licensing and R&D Decision-Makers
Institutional Buyers in Industrial Materials Distribution
Procurement Heads at Large E-commerce & Retail Firms
Policy and Trade Analysts within Industry Associations
Time Period:
Historical Period: 2019-2024
Base Year: 2025
- Forecast Period: 2025-2030
Explore Flexible Purchase Options or Have Limited Budget?
Pay only for relevant chapters • Customizable report sections
Table of Contents
Choose individual sections to purchase. Mix and match as you like.
4.1. Delivery Model Analysis for Adhesives (Direct to OEM, Distributor-Led, Retail Counter, E-commerce, Institutional Supply)-Margins, Preference, Strengths, Weaknesses
4.2. Revenue Streams for Adhesives Market (Consumer Adhesives, Industrial Adhesives, Specialty Adhesives, Custom Formulations, OEM Tie-Ups)
4.3. Business Model Canvas for Adhesives Market (Key Activities, Value Propositions, Channels, Customer Segments, Revenue Streams, Cost Structures)
5.1. Organized vs. Unorganized Manufacturers (Share %, Pricing Gap, Quality Perceptions)
5.2. Investment Model in India Adhesives Market (Brownfield Expansions, Greenfield Plants, Tolling Units)
5.3. Comparative Analysis of Adhesive Supply to Government vs. Private Projects (Tendering, Approval Process, Pricing Dynamics)
5.4. Adhesives Budget Allocation by Company Size (Large OEMs vs. SMEs)
6.1. Sector-Wise Demand Potential (Packaging, Construction, Automotive, Furniture, Electronics, Footwear)
6.2. Regional Demand Hotspots (North, South, West, East)
6.3. Opportunity Heat Map (Chemistry vs. End-Use)
7.1. Domestic Adhesive Production vs. Consumption (ktpa)
7.2. Import Dependency (Monomers, Specialty Resins)
7.3. Pricing Impact of Supply Gaps
8.1. Revenues (Historical & Current, INR Cr)
9.1. By Market Structure (Organized vs. Unorganized)
9.2. By Adhesive Technology (Water-Based, Solvent-Based, Hot-Melt, Reactive, UV/EB-Curable)
9.3. By End-Use Verticals (Packaging, Automotive, Construction, Electronics, Furniture, Footwear, Healthcare)
9.3.1. By Packaging Type (Carton Sealing, Flexible Packaging, Labels & PSA, Specialty Packs)
9.3.2. By Automotive Application (Structural Bonding, Trim, NVH, Windshield, Hem-Flange)
9.3.3. By Construction Application (Tile Adhesives, Sealants, Waterproofing, Flooring, Structural Glazing)
9.3.4. By Electronics Application (SMT, Potting, Underfill, Thermal Adhesives)
9.4. By Company Size (Large OEMs, Medium Enterprises, SMEs)
9.5. By Substrate (Paper & Board, Plastics, Metals, Wood, Glass, Composites)
9.6. By Mode of Distribution (Direct, Distributor, Retail Hardware, E-commerce, Institutional Supply)
9.7. By Customized vs. Standard Adhesives (Share %)
9.8. By Region (North, South, East, West & Central India)
10.1. OEM and Industrial Client Landscape & Cohort Analysis
10.2. Adhesive Procurement Decision-Making Process (Specification Driven vs. Price Driven)
10.3. Adhesive Application Effectiveness & ROI Analysis (Bond Strength, Lifecycle Performance, Failure Rate %)
10.4. Gap Analysis Framework (Consumer Needs vs. Current Offerings)
11.1. Trends and Developments (Water-Based Shift, Solvent-Less Lamination, PUR Hot-Melts, Bio-Based Adhesives)
11.2. Growth Drivers (Infrastructure Spending, Packaging Growth, Automotive Demand, Make-in-India, E-commerce Boom)
11.3. SWOT Analysis for Adhesives Market
11.4. Issues and Challenges (Raw Material Volatility, VOC Emissions, Low Awareness in Semi-Urban Markets)
11.5. Government Regulations (BIS Standards, FSSAI Packaging Compliance, CPCB VOC Guidelines)
12.1. Market Size and Future Potential of Adhesive E-commerce in India
12.2. Business Model and Revenue Streams (Direct B2B, Marketplace, OEM Tie-Ups)
12.3. Delivery Models (Standard Packs, Subscription, Just-in-Time)
12.4. Cross Comparison of Leading Online Adhesive Sellers (Company Overview, Funding, Revenues, Number of SKUs, Pricing, Channel Partners, User Base)
15.1. Market Share of Key Players in India Adhesives Market (Basis Revenues)
15.2. Benchmark of Key Competitors (Company Overview, USP, Business Strategies, Business Model, India Capacity, Revenues, Pricing, Technology, Best-Selling Products, Major Clients, Strategic Tie-Ups, Marketing Strategy, Recent Developments)
15.3. Operating Model Analysis Framework (Direct Manufacturing, Tolling, Import-Dependent, Hybrid)
15.4. Gartner Magic Quadrant (Leaders, Challengers, Visionaries, Niche Players)
15.5. Bowman’s Strategic Clock for Competitive Advantage
16.1. Revenues (Forward Outlook)
17.1. By Market Structure (Organized vs. Unorganized)
17.2. By Adhesive Technology (Water-Based, Solvent-Based, Hot-Melt, Reactive, UV/EB)
17.3. By End-Use Verticals (Packaging, Automotive, Construction, Electronics, Furniture, Footwear, Healthcare)
17.4. By Company Size (Large OEMs, Medium Enterprises, SMEs)
17.5. By Substrate (Paper, Plastic, Metal, Wood, Glass)
17.6. By Mode of Distribution (Direct, Distributor, Retail, E-commerce)
17.7. By Customized vs. Standard Adhesives (Share %)
17.8. By Region (North, South, East, West & Central India)
Discuss a Customized Research Scope
Custom research scope • Tailored insights • Industry expertise
Research Methodology
Step 1: Ecosystem Creation
We begin by mapping the India adhesives ecosystem, identifying all demand-side and supply-side entities. On the supply side, the map includes raw material suppliers (vinyl acetate monomer, isocyanates, acrylics, tackifiers), adhesive formulators (consumer, industrial, construction), distributors, and retail hardware/e-commerce platforms. On the demand side, we track usage across packaging, construction & infrastructure, automotive, furniture & woodworking, electronics & appliances, and footwear industries. Based on this mapping, we shortlist 5–6 leading adhesive players in India—Pidilite, Henkel, H.B. Fuller, Sika, Astral, and 3M—evaluating them by financial information, client base (OEMs, converters, contractors), and geographic reach. Sourcing is done via industry publications, secondary databases, trade portals, and proprietary datasets to collate ecosystem-level insights.
Step 2: Desk Research
Next, we engage in a comprehensive desk research process using multiple secondary and proprietary databases. This enables us to analyze industry-level trends, including production volumes, capacity distribution, and consumption patterns across end-use verticals. We examine company-level information such as revenues, product portfolio mix (consumer adhesives vs. industrial formulations), distribution reach, and expansion projects. Press releases, annual reports, filings with the Ministry of Corporate Affairs (MCA), and global parent financials are carefully studied. Desk research also evaluates regulatory compliance data (BIS licenses, FSSAI audits, CPCB approvals), providing a consolidated foundation to understand the market’s structure, key drivers, and constraints before primary engagement.
Step 3: Primary Research
We then conduct in-depth interviews with C-level executives, plant managers, procurement heads, distributors, and end-users representing the adhesives value chain. This serves to validate market hypotheses and confirm statistical data obtained in desk research. A bottom-to-top approach is applied to assess adhesive consumption by sector and revenue contribution of each major player, aggregating into the total market. As part of our validation strategy, disguised interviews are executed, where we approach companies as potential customers. This enables us to validate operating margins, pricing practices (kg/job), and supply chain processes, while cross-checking against secondary sources. Insights collected extend to application practices, failure modes, performance testing, and sales channels.
Step 4: Sanity Check
Finally, a top-to-bottom and bottom-to-top triangulation is performed to ensure the accuracy of findings. Market size modeling exercises reconcile consumption norms per substrate/application (e.g., g/m² in flexible packaging, kg/m² in tile laying, kg/joint in woodworking) with supply-side production/distribution data. This double validation ensures consistency between reported revenues, actual demand-side usage, and ecosystem-wide data. The sanity check thus guarantees robust and defensible estimates of the India adhesives market structure, segmentation, and competitive dynamics.
See What's Inside the Report
Get a preview of key findings, methodology and report coverage
Frequently Asked Questions
The India Adhesives Market is poised for substantial growth, reaching a valuation of INR ~240 billion in 2023 (equivalent to USD 2.91 billion per a FY2023 industry assessment; INR figure derived at ~₹82.6/US$ based on the rupee’s 2023 trading range). This momentum is driven by accelerating demand from packaging (e-commerce, FMCG), housing and civil works, automotive lightweighting, and specification-led usage in electronics and appliances. The market’s potential is further bolstered by Make-in-India localization, sustainability/low-VOC compliance, and upgrades to higher-performance systems (PUR-HM, structural epoxies, SMP/RTV).
The India Adhesives Market features several key players, including Pidilite Industries, Henkel Adhesive Technologies, and H.B. Fuller. These companies dominate due to extensive product portfolios across chemistries/technologies, deep OEM and converter relationships, and nationwide channels with application support. Other notable players include Sika, Arkema–Bostik, 3M, Avery Dennison, Huntsman (Araldite), Astral (Resinova), Anabond, Dow, Mapei, Soudal, Chemline India, and Asian Paints (Adhesives Division)—collectively covering consumer, construction, packaging, transportation, woodworking, and electronics end-uses.
Primary growth drivers include robust fixed-asset formation and urban infrastructure activity (metros, housing, roads) that expand demand for tile/flooring adhesives, construction sealants, and waterproofing ancillaries; the surge in e-commerce and FMCG logistics that lifts carton sealing, label/PSA, and flexible-laminate adhesive consumption; and manufacturing upgrades in automotive, electronics, appliances, footwear, and furniture, where bonding replaces mechanical fastening and enables lighter designs. Sustainability regulations around VOCs and food-contact safety push conversion toward water-borne, solvent-less, and low-migration systems, supporting value-mix improvement and specification-led procurement.
Key challenges include volatility in imported feedstocks (e.g., VAM, isocyanates, acrylic monomers) and currency swings that compress formulator margins; tightening environmental norms (VOC control, EHS audits) and food-contact compliance that raise testing/qualification costs and lengthen time-to-market; and capability gaps among SMEs/installers around surface preparation, adhesive selection, and application SOPs—leading to bond failures and warranty risk. Intensifying competition from private labels and fragmented regional players adds pricing pressure, making technical service, QA documentation, and performance-per-job value proofs crucial to sustain share.
License Options
PDF + Excel
Complete report package
$4,000
Excel Only
Data and analytics
$2,500
Custom Sections
Starts from $100
$0