India Biofertilizers Market Outlook to 2030
By Microbial Category, By Formulation Type, By Application Method, By Crop Group, By Distribution Channel, and By Region
Report Overview
Report Code
TDR0376
Coverage
Asia
Published
November 2025
Pages
80
Flexible Purchase Options
Select and purchase only the chapters you need for your strategic decisions
On This Page
Report Overview
The report titled “India Biofertilizers Market Outlook to 2030 – By Microbial Category, By Formulation Type, By Application Method, By Crop Group, By Distribution Channel, and By Region” provides a comprehensive analysis of the biofertilizers industry in India. The report covers an overview and genesis of the industry, overall market size in terms of revenue, market segmentation, trends and developments, regulatory landscape, customer-level profiling, issues and challenges, and competitive landscape including competition scenario, cross-comparison, opportunities and bottlenecks, and company profiling of major players in the biofertilizers market.
Report Coverage
Verified Market Sizing
Multi-layer forecasting with historical data and 5–10 year outlook
Deep-Dive Segmentation
Cross-sectional analysis by product type, end user, application and region
Competitive Benchmarking & Positioning
Market share, operating model, pricing and competition matrices
Actionable Insights & Risk Assessment
High-growth white spaces, underserved segments, technology disruptions and demand inflection points
Review Methodology & Data Structure
Preview report structure, data sources and research framework
Executive Summary
The report titled “India Biofertilizers Market Outlook to 2030 – By Microbial Category, By Formulation Type, By Application Method, By Crop Group, By Distribution Channel, and By Region” provides a comprehensive analysis of the biofertilizers industry in India. The report covers an overview and genesis of the industry, overall market size in terms of revenue, market segmentation, trends and developments, regulatory landscape, customer-level profiling, issues and challenges, and competitive landscape including competition scenario, cross-comparison, opportunities and bottlenecks, and company profiling of major players in the biofertilizers market. The report concludes with future market projections based on inoculant volumes, microbial categories, regional adoption patterns, cause-and-effect relationships (soil fertility programs, PM-PRANAM outcomes, SHC utilization), and success case studies highlighting the major opportunities and cautions.
India Biofertilizers Market Overview and Size
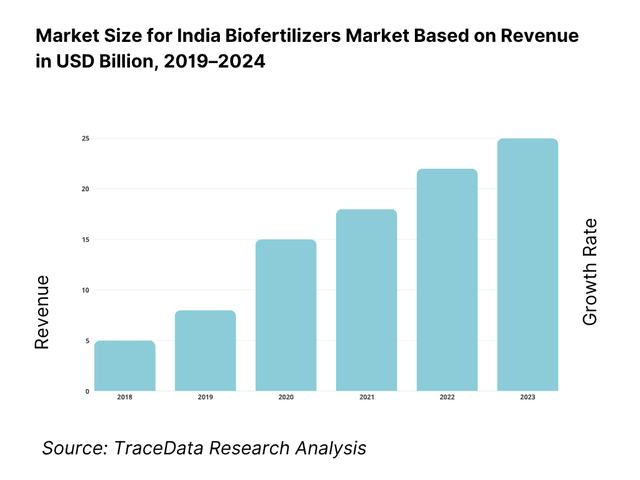
The India biofertilizers market is valued at USD 115 million, based on a five-year historical analysis that consolidates company shipments, channel checks, and end-use uptake across major cropping systems. Demand is anchored by government support for sustainable inputs, rising organic acreage, and nutrient-use-efficiency programs in cereals, pulses, and horticulture. In the latest cycle, the market advanced further to USD 142.97 million, reflecting a step-up in institutional procurement and private-label liquid inoculants.
Dominance clusters are visible in Maharashtra, Uttar Pradesh, Punjab, Haryana, Tamil Nadu, and Karnataka. These hubs lead due to large irrigated command areas, robust agri-input retail density, and state-backed demonstrations that mainstream seed and soil inoculation in paddy–wheat, cotton, soybean, sugarcane, and horticulture belts. Proximity to manufacturers and cooperatives (IFFCO, NFL, GSFC) compresses distribution costs and ensures cold-chain discipline for liquid and carrier formulations, reinforcing repeat adoption among FPOs and custom hiring centers.
What Factors are Leading to the Growth of the India Biofertilizers Market:
Cropping throughput and food system intensity create continuous microbial-nutrition demand (market pull).: India’s agricultural base operates at a massive scale that naturally sustains the demand for microbial nutrition. The country produces 355.48 million tonnes of horticultural crops and 3,322.98 lakh tonnes of foodgrains, forming one of the world’s largest nutrient extraction cycles. With a population exceeding 1.45 billion, consumption and processing activities continuously deplete soil nutrients, creating an ongoing need for biological replenishment. Organic exports surpassing 2.6 lakh metric tonnes highlight growing premium markets that favor sustainable cultivation practices. The combination of vast cropping intensity, population-driven consumption, and export-linked quality standards creates a stable and expanding adoption pathway for biofertilizers.
Policy nudges and balanced-nutrition programs shift acres toward biologicals (market enablement).: Government initiatives are actively realigning India’s fertilizer use patterns toward sustainability. Programs like PM-PRANAM incentivize states to reduce chemical fertilizer dependency, resulting in a significant drop in consumption across multiple regions. The Soil Health Card platform has institutionalized nutrient mapping across millions of hectares, promoting crop- and soil-specific fertilizer recommendations that integrate microbial inoculants. These frameworks reduce adoption barriers for biofertilizers by embedding biological inputs into official nutrient management advisories, promoting their inclusion in public tenders, and increasing acceptance among farmers through state-backed demonstrations and subsidy channels.
Water-stress and resource-efficiency imperatives favor root-zone biology (market need).: India faces a critical water sustainability challenge, with annual groundwater extraction far exceeding recharge levels and hundreds of districts classified as over-exploited. Such hydrological stress has intensified the search for solutions that enhance nutrient absorption efficiency per drop of irrigation. Mycorrhizal fungi and plant-growth–promoting rhizobacteria (PGPR) improve root surface area, enabling better uptake of nitrogen, phosphorus, and micronutrients under limited water availability. As micro-irrigation systems expand across high-value horticultural belts, these microbial products are becoming central to climate-smart agronomy, ensuring yield resilience and nutrient efficiency under growing resource constraints.
Which Industry Challenges Have Impacted the Growth of the India Biofertilizers Market:
Dominance of synthetics and high nutrient throughput slows switching at scale (incumbent inertia).: India’s synthetic fertilizer ecosystem remains vast and cost-competitive, sustaining a large installed production capacity. Annual urea output exceeding 300 LMT and dense nationwide distribution networks ensure easy accessibility and affordability for farmers. These entrenched supply lines and subsidies make synthetic fertilizers the default input choice for most crops. Even though the government promotes balanced fertilization, the comparative ease of distribution and pricing advantage of chemical fertilizers delays full-scale substitution with microbial alternatives, limiting biofertilizer uptake beyond high-value or subsidy-supported cultivation zones.
Quality assurance capacity must keep pace with proliferation of SKUs and labels (testing load).: The rapid expansion of microbial product portfolios—including liquid, carrier-based, and consortium formulations—has increased the pressure on testing and certification infrastructure. India hosts over 8,000 accredited laboratories, yet only a small fraction specialize in microbial quality control. Regional variations in testing standards and limited district-level facilities result in slow certification cycles and occasional inconsistencies in product quality. As biofertilizer brands multiply, the need for uniform and accessible testing infrastructure becomes essential to prevent substandard batches, protect farmer trust, and maintain product efficacy across different agro-climatic regions.
Climate-linked volatility demands resilient biology and storage logistics (operational risk).: India’s tropical climate, marked by long-distance logistics and high ambient temperatures, poses severe challenges to microbial survival in both carrier and liquid formulations. Seasonal crop calendars, with foodgrain and horticultural production exceeding 3,600 million tonnes annually, require precise supply synchronization to prevent expiry and loss. Many rural markets still lack cold storage or temperature-controlled warehouses, affecting product shelf-life and CFU viability. Additionally, groundwater-stressed regions experience delayed planting windows, compressing application cycles and complicating last-mile delivery—making microbial resilience and packaging innovation critical operational priorities for the sector.
What are the Regulations and Initiatives which have Governed the Market:
Fertiliser (Control) Order—mandatory conformance to Schedule-III biofertilizer standards (licensing backbone).: The manufacture, sale, and distribution of biofertilizers are governed by the Fertiliser (Control) Order (FCO), which mandates strict adherence to Schedule-III standards. All products must meet defined CFU counts, carrier purity, and contamination limits before release into the market. Licensing, labeling, and batch testing are compulsory for notified organisms such as Rhizobium, Azotobacter, Azospirillum, PSB, and KMB. The FCO framework ensures product consistency, authorizes government inspection, and provides a national standard for registration, helping regulate both private and cooperative manufacturers within an enforceable compliance environment.
BIS product specifications—organism-wise standards anchor QA (standards alignment).: The Bureau of Indian Standards (BIS) has issued specific microbial and formulation standards that complement the FCO framework. These specifications define permissible microbial counts, contamination thresholds, and carrier quality requirements for both carrier-based and liquid inoculants. BIS-certified SKUs are widely referenced in public tenders and cooperative procurement contracts, ensuring that only validated products are distributed through government-supported channels. This harmonization between BIS specifications and FCO regulation underpins a quality-assured ecosystem that enhances product reliability and market confidence among institutional buyers and farmers.
Laboratory accreditation ecosystem—NABL framework underpins reliable testing (quality enforcement).: The National Accreditation Board for Testing and Calibration Laboratories (NABL) provides the backbone for quality verification in the biofertilizer ecosystem. With over 8,500 accredited facilities across testing and calibration categories, the NABL system ensures uniformity and technical competence in microbial analysis. State agriculture departments are gradually establishing specialized testing centers under NABL accreditation to validate CFU counts, carrier quality, and shelf-life. This growing laboratory network enhances regulatory enforcement under both FCO and BIS frameworks, reduces disputes over batch quality, and builds a transparent testing regime that safeguards both producers and end-users.
India Biofertilizers Market Segmentation
By Product Type: India’s biofertilizers market is segmented by product type into nitrogen-fixing, PSB, KMB, mycorrhiza, and consortia. Nitrogen-fixing products currently hold the dominant share in India under product type. Their leadership stems from widespread use in pulses, oilseeds, and cotton, where biological N fixation substitutes part of urea in basal and top dressing. Established strains (e.g., Rhizobium for legumes; Azotobacter/Azospirillum for cereals) have decades of KVK demonstration data and are embedded in state package-of-practices, driving habitual purchase through cooperative outlets and agri-retailers. This deep agronomic fit and reliable yield response keep nitrogen fixers ahead.

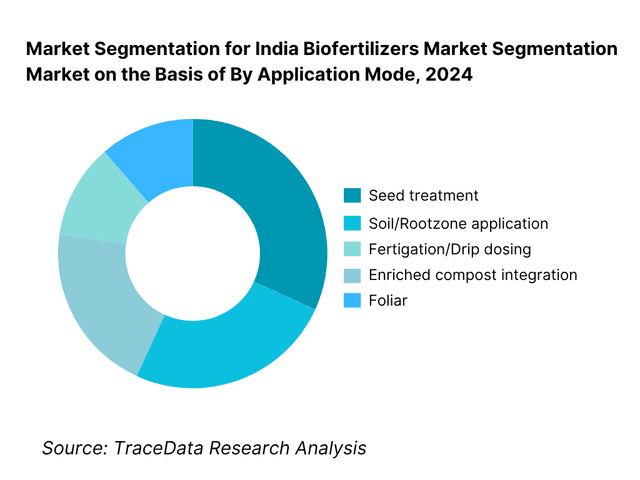
By Application Mode: India’s biofertilizers market is segmented by application into seed treatment, soil/rootzone application, fertigation, foliar, and enriched compost use. Seed treatment is dominant owing to its low ticket size per acre, simple on-farm operations (slurry/coating), and strong inclusion in government demos and tender kits. The method ensures high microbial proximity to the rhizosphere at germination, improving stand establishment and nitrogen/phosphorus uptake. Seed treatment’s compatibility with existing sowing workflows and minimal equipment needs (unlike fertigation) sustains its leadership across smallholders.
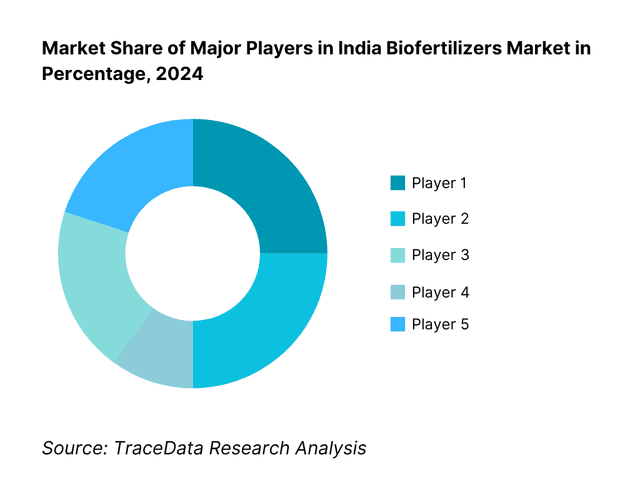
Competitive Landscape in India Biofertilizers Market
The India biofertilizers market features a mix of large public sector undertakings/cooperatives and agile private biocontrol specialists. A handful of national brands drive scale via cooperative channels and institutional programs, while mid-sized innovators push liquid and encapsulated strains, polymer carriers, and consortia suited to local soils. This coexistence—volume from PSUs and differentiation from biotechs—creates disciplined pricing, expanding SKU breadth in liquid PSB, AMF, and plant growth-promoting rhizobacteria (PGPR).
Name | Founding Year | Original Headquarters |
IFFCO | 1967 | New Delhi, India |
National Fertilizers Limited (NFL) | 1974 | Noida, India |
Gujarat State Fertilizers & Chemicals | 1962 | Vadodara, India |
Rashtriya Chemicals & Fertilizers (RCF) | 1978 | Mumbai, India |
Madras Fertilizers Limited (MFL) | 1966 | Chennai, India |
Krishak Bharati Cooperative Limited | 1980 | Noida, India |
UPL Ltd | 1969 | Mumbai, India |
IPL Biologicals Limited | 1994 | Gurugram, India |
Kan Biosys Pvt. Ltd. | 1992 | Pune, India |
Biostadt India Limited | 2003 | Mumbai, India |
T. Stanes & Company Limited | 1861 | Coimbatore, India |
Nova AgriTech Limited | 2007 | Hyderabad, India |
Varsha Bioscience & Technology India Pvt. Ltd. | 2001 | Hyderabad, India |
Aumgene Biosciences | 2004 | Rajkot, India |
Manidharma Biotech Pvt. Ltd. | 2001 | Chennai, India |
Some of the Recent Competitor Trends and Key Information About Competitors Include:
IFFCO: As one of India’s largest cooperative biofertilizer manufacturers, IFFCO has expanded its liquid biofertilizer production lines across multiple units, integrating automated fermenters to enhance CFU consistency and shelf-life. The cooperative also strengthened its digital distribution through IFFCO eBazar and introduced bundled “Soil Health Packages” combining biofertilizers with nano-urea and biostimulants for enhanced adoption among farmers.
National Fertilizers Limited (NFL): NFL increased its institutional supply of Rhizobium and PSB inoculants under various government organic and natural farming schemes. The company modernized its QC protocols aligned with the FCO’s Schedule III amendments, and partnered with state agriculture departments for demonstrations promoting balanced fertilization in cereals and pulses through biological inputs.
Gujarat State Fertilizers & Chemicals (GSFC): GSFC has focused on expanding its biofertilizer capacity at its Vadodara unit, emphasizing Vesicular-Arbuscular Mycorrhiza (VAM) formulations for horticultural crops. The company also launched pilot projects on gel-based and encapsulated carriers, designed to maintain microbial viability under high-temperature conditions prevalent in western India.
UPL Ltd (Natural Plant Protection Division): UPL’s biosolutions arm continues to scale globally, and within India, it has introduced microbial consortia formulations that combine nitrogen-fixing and phosphate-solubilizing strains for sugarcane and paddy systems. The company’s collaboration with ICAR institutions supports strain validation and soil microbiome mapping, aligning with its broader sustainable agriculture initiative.
IPL Biologicals: A pioneer in commercial microbial solutions, IPL Biologicals expanded its liquid and encapsulated biofertilizer range in 2024, improving product stability and compatibility with fertigation systems. The company increased its dealer network coverage to 80% of key agricultural states and invested in strain-specific R&D for drought-resilient microbes suited for semi-arid regions.
What Lies Ahead for India Biofertilizers Market?
The India Biofertilizers Market is expected to witness consistent expansion through the coming decade, supported by strong national efforts toward soil health restoration, fertilizer rationalization, and organic farming. The country’s vast agricultural base—producing over 3,322.98 lakh tonnes of foodgrains and 355.48 million tonnes of horticultural produce—creates a recurring nutrient demand that biofertilizers can serve sustainably. Policy support through programs such as PM-PRANAM and the expansion of the Soil Health Card network positions biofertilizers as a key component of India’s future input strategy and rural sustainability roadmap.
Rise of Consortium and Liquid Biofertilizer Technologies: The next phase of market evolution will be driven by advanced microbial formulations—particularly liquid, encapsulated, and consortia-based biofertilizers capable of surviving tropical logistics and integrating with fertigation systems. India’s irrigation network now covers over 70 million hectares of cropped land, creating ideal conditions for precision application. The synergy of microbial inputs and efficient irrigation enables targeted nutrient delivery, minimal wastage, and improved fertilizer-use efficiency, aligning with national objectives for balanced nutrient management and reduced chemical dependency.
Focus on Climate Resilience and Soil Restoration: India’s groundwater extraction levels remain significantly higher than its recharge capacity, resulting in widespread depletion across hundreds of administrative units. This stresses the need for soil microbiology solutions that enhance nutrient uptake and water efficiency. Demand for mycorrhizal and phosphate-mobilizing inoculants is projected to rise rapidly in semi-arid and water-stressed zones. Biofertilizers are transitioning from being seen as “organic” inputs to becoming essential climate-resilient tools across India’s 147 million-hectare net sown area, helping farmers maintain yields while improving soil structure and fertility.
Expansion of State and Institutional Procurement: Government and cooperative procurement are emerging as major market accelerators. Fertilizer subsidy allocations exceeding ₹1.75 lakh crore create significant scope for integrating biological alternatives into the supply framework. State-level agriculture missions under PKVY and NMSA continue to fund cluster-based demonstrations, driving farmer adoption at scale. Cooperatives such as IFFCO and KRIBHCO have expanded their distribution through over 36,000 Primary Agricultural Cooperative Societies (PACS), ensuring product accessibility, credit facilitation, and training—key components of sustained market penetration.
Leveraging Digital and Scientific Infrastructure: Rural broadband access exceeding 880 million users is enabling the integration of digital technologies into the biofertilizer ecosystem. Agri-tech companies are using QR-based traceability, mobile advisory services, and e-commerce distribution to reach farmers more effectively. Simultaneously, regulatory oversight is improving through the Fertiliser (Control) Order and expanding NABL-accredited laboratory network, which ensures microbial quality and CFU verification. Together, these developments are building a traceable, quality-assured supply chain that will strengthen farmer confidence and industry credibility.
Sectoral Convergence with Organic and Carbon-Smart Agriculture: India’s growing organic export footprint—over 2.6 lakh metric tonnes valued above ₹5,500 crore—reflects rising domestic and global preference for chemical-free produce. As carbon credit mechanisms mature, microbial inoculants that enhance soil organic carbon will play a measurable role in sustainability-linked agricultural financing. This convergence of organic certification, carbon sequestration, and regenerative soil practices positions biofertilizers at the intersection of agricultural productivity and environmental responsibility—anchoring their long-term strategic relevance within India’s green growth and low-emission development agenda.

India Biofertilizers Market Segmentation
By Microbial Type
Nitrogen-Fixing Biofertilizers (Rhizobium, Azotobacter, Azospirillum)
Phosphate-Solubilizing Biofertilizers (PSB, PSF)
Potassium and Micronutrient Solubilizers (KSB, ZSB, Silicate solubilizers)
Mycorrhizae (AMF/VAM)
Multi-Strain Consortia & PGPR
By Formulation Type
Carrier-Based Biofertilizers (talc/lignite/peat-based powders)
Liquid Biofertilizers (stabilized liquid inoculants)
Encapsulated/Gel-Based Biofertilizers (polymer-coated or alginate forms)
Granular/Pelletized Biofertilizers (VAM and AMF formulations)
Water-Soluble Concentrates (drip and fertigation compatible)
By Application Method
Seed Treatment and Coating
Seedling Root Dip or Transplant Treatment
Soil Application or Broadcasting
Fertigation and Drip Dosing
Enriched Compost Integration
By Crop Type
Cereals & Millets (paddy, wheat, maize)
Pulses & Oilseeds (soybean, groundnut, chickpea, mustard)
Commercial Crops (sugarcane, cotton)
Horticulture & Plantation Crops (fruits, vegetables, tea, coffee, spices)
Protected Cultivation & Floriculture
By Distribution Channel
Cooperatives & PSUs (IFFCO, KRIBHCO, NFL, RCF depots, PACS)
Private Retail & Dealer Networks
Farmer Producer Organizations (FPOs) & Institutional Procurement
Government Schemes & Tenders (PKVY, BPKP, PM-PRANAM)
E-Commerce & AgriTech Platforms
Players Mentioned in the Report:
Indian Farmers Fertiliser Cooperative (IFFCO)
National Fertilizers Limited (NFL)
Gujarat State Fertilizers & Chemicals (GSFC)
Rashtriya Chemicals & Fertilizers (RCF)
Madras Fertilizers Limited (MFL)
Krishak Bharati Cooperative (KRIBHCO)
UPL Ltd (BioSolutions)
IPL Biologicals
Kan Biosys
Biostadt India
T. Stanes & Co.
Nova AgriTech (Bio-inputs)
Aumgene Biosciences
Varsha Bioscience & Technology
Manidharma Biotech
Key Target Audience
Fertilizer PSUs & Cooperatives (IFFCO, NFL, RCF, GSFC, KRIBHCO)
Agri-Input Manufacturers & Bio-solutions Divisions (UPL BioSolutions, Biostadt, IPL Biologicals units)
Farmer Producer Organizations (FPOs) & State Federations (NAFED-linked FPO clusters)
Large Agribusinesses & Food Processors (contract farming, residue-limit programs)
Retail & Distribution Networks (agri-retail chains, cooperative societies)
Micro-Irrigation & Precision Ag Providers (drip/fertigation OEMs, drone service firms)
Investments and Venture Capitalist Firms (Ag-bio, climate-tech, nature-based solutions)
Government & Regulatory Bodies
Time Period:
Historical Period: 2019-2024
Base Year: 2025
Forecast Period: 2025-2030
Explore Flexible Purchase Options or Have Limited Budget?
Pay only for relevant chapters • Customizable report sections
Table of Contents
Choose individual sections to purchase. Mix and match as you like.
4.1. Delivery Model Analysis for Biofertilizers-Carrier-Based, Liquid, Encapsulated, Consortium Formats
4.2. Revenue Streams for India Biofertilizers Market
4.3. Business Model Canvas for India Biofertilizers Market
5.1. Cooperative and PSU Biofertilizer Production vs. Private Manufacturers (IFFCO, GSFC, NFL, FACT vs. Kan Biosys, IPL Biologicals, T. Stanes, Varsha, Biostadt)
5.2. Investment Model in India Biofertilizers Market (Capex for fermenters, formulation lines; PPP under BPKP / PM-PRANAM; DBT grant schemes; state subsidy models)
5.3. Comparative Analysis of Procurement and Distribution by Government vs. Private Channels (tendering timelines, margin structures, logistics, quality controls)
5.4. Biofertilizer Budget Allocation by State Programs (PKVY/BPKP cluster allocations; organic corridor funding; PM-PRANAM district targets)
8.1. Revenues (In INR Cr / USD Mn, 2019-2024)
9.1. By Market Structure (In-House vs. Outsourced Manufacturing)
9.2. By Microbial Category (Rhizobium, Azotobacter, Azospirillum, PSB, KSB, ZSB, VAM, BGA)
9.3. By Crop Group (Cereals & Millets, Pulses & Oilseeds, Sugarcane & Cotton, Fruits & Vegetables, Plantations & Spices)
9.4. By Company Size (Cooperatives/PSUs, Mid-Tier Private, SME Bio-Manufacturers)
9.5. By Application Method (Seed Treatment, Root Dip, Soil Broadcast, Drip / Fertigation)
9.6. By Mode of Distribution (Cooperative / PACS, Retail Dealer, FPC, e-Commerce, Govt Procurement)
9.7. By Product Customization (Single Strain vs. Consortium vs. Fortified Blends)
9.8. By Region (Northern, Western, Southern, Eastern, North-Eastern India)
10.1. Corporate / Institutional Client Landscape and Cohort Analysis (Agri cooperatives, FPCs, exporters, contract farmers)
10.2. Adoption Drivers and Decision-Making Process (soil health card prescriptions, state extension officers, input dealers, progressive farmer networks)
10.3. Training Program Effectiveness and ROI Analysis (yield improvement, input cost savings, organic premium pricing impact)
10.4. Gap Analysis Framework (awareness, distribution, product availability, technical support deficit)
11.1. Trends and Developments (liquid biofertilizers, encapsulation, consortium technologies, digital extension tools)
11.2. Growth Drivers (soil health restoration, organic farming schemes, fertilizer substitution, export potential)
11.3. SWOT Analysis
11.4. Issues and Challenges (CFU stability, sub-standard products, low awareness, storage infrastructure)
11.5. Government Regulations (FCO Schedule III specs, BIS standards, ICAR strain validation, PKVY/BPKP norms, PM-PRANAM targets)
12.1. Market Size and Future Potential for Online Biofertilizer Distribution in India, 2018-2030 (Agri-input e-commerce penetration, JaivikKheti sales)
12.2. Business Model and Revenue Streams (B2B, B2C, D2F, subscription supply for clusters)
12.3. Delivery Models and Types of Products Offered (liquid biofertilizers, consortia packs, starter kits)
15.1. Market Share of Key Players by Revenue and Volume (2024)
15.2. Benchmark of Key Competitors-Company Overview, USP, Business Model, Production Capacity, Distribution Network, CFU Performance, Technology, Major Clients (PSUs / Co-ops / FPCs), Strategic Tie-Ups, Marketing Approach, Recent Developments
15.3. Operating Model Analysis Framework (own fermenter vs. toll manufacturing; QC cycle; distribution control)
15.4. Gartner-Style Quadrant for Market Positioning (R&D maturity vs. distribution depth)
15.5. Bowman’s Strategic Clock for Competitive Advantage (price leadership vs. differentiation via quality / consortia IP)
16.1. Revenues (In INR Cr / USD Mn, 2025-2030)
17.1. By Market Structure (In-House vs. Outsourced Manufacturing), 2025-2030
17.2. By Microbial Category (Rhizobium, Azotobacter, Azospirillum, PSB, KSB, ZSB, VAM, BGA), 2025-2030
17.3. By Crop Group (Cereals & Millets, Pulses & Oilseeds, Sugarcane & Cotton, Fruits & Vegetables, Plantations & Spices), 2025-2030
17.4. By Company Size (Cooperatives/PSUs, Mid-Tier Private, SME Bio-Manufacturers), 2025-2030
17.5. By Application Method (Seed Treatment, Root Dip, Soil Broadcast, Drip/Fertigation), 2025-2030
17.6. By Distribution Channel (Cooperative/PACS, Retail, FPC, e-Commerce), 2025-2030
17.7. By Product Customization (Single Strain vs. Consortium vs. Fortified Blends), 2025-2030
17.8. By Region (Northern, Western, Southern, Eastern, North-Eastern India), 2025-2030
Discuss a Customized Research Scope
Custom research scope • Tailored insights • Industry expertise
Research Methodology
Step 1: Ecosystem Creation
Map the ecosystem and identify all the demand-side and supply-side entities for the India Biofertilizers Market. Based on this ecosystem, we will shortlist 5–6 leading biofertilizer producers in the country based on their financial performance, manufacturing capacity, distribution reach, and institutional client base. The supply-side ecosystem includes fertilizer PSUs and cooperatives such as IFFCO, NFL, RCF, GSFC, and KRIBHCO, along with major private manufacturers like IPL Biologicals, Kan Biosys, Biostadt India, and Nova AgriTech. Supporting entities include ICAR strain banks, BIS and FCO regulatory bodies, NABL-accredited testing laboratories, packaging suppliers, and regional distributors. The demand-side ecosystem comprises farmers, FPOs, cooperatives, state agriculture departments, Soil Health Card advisory networks, and organic/PGS clusters that integrate microbial products in nutrient management plans. Sourcing is conducted through government databases, tender portals, and industry bulletins, along with company annual reports, cooperative society data, and ministry publications to perform desk research and collate industry-level information.
Step 2: Desk Research
Subsequently, we engage in an exhaustive desk research process by referencing diverse government, secondary, and proprietary databases. This enables a thorough assessment of the market structure, competitive hierarchy, and policy framework. We analyze production and distribution statistics, licensed manufacturing units under FCO, and BIS-certified formulations to quantify installed fermentation capacities and product categories. Revenue and product-mix data are aggregated from company filings, tender award records, and PSU disclosures. Desk research further examines agronomic demand drivers, including foodgrain production of 3,322.98 LMT and horticulture output of 355.48 million tonnes (PIB–MoA&FW), regional procurement under PKVY, BPKP, and PM-PRANAM, and NABL testing expansion. Company-level insights are supplemented using press releases, regulatory filings, and fertilizer control reports, building a robust foundation for supply-demand mapping and policy analysis.
Step 3: Primary Research
We initiate a series of in-depth interviews with senior executives, agronomists, and state-level procurement officials representing entities within the India Biofertilizers Market. These interactions validate hypotheses developed during secondary analysis and authenticate operational, financial, and adoption-related statistics. Interview respondents include plant heads, R&D scientists, and QA managers from PSUs, cooperatives, and private firms, alongside KVK agronomists, distributor networks, and FPO leaders. This dialogue captures granular data on production capacity utilization, strain efficacy, CFU compliance, distribution margins, and inventory management practices. A bottom-to-top approach is applied to aggregate volume and revenue contributions from manufacturers and state buyers, thereby arriving at the national market figure. For accuracy, the team also conducts disguised interviews as potential clients to validate order cycles, pricing, and operational claims, cross-verifying against cooperative tender records and government procurement databases.
Step 4: Sanity Check
A top-to-bottom and bottom-to-top modeling exercise is undertaken to test data accuracy and ensure internal consistency of the India Biofertilizers Market sizing. The top-down model uses macro parameters such as cropped area, recommended microbial dosage, and adoption rates under SHC and PKVY programs, while the bottom-up model aggregates reported production, sales, and dispatch data from verified manufacturers and state procurement tenders. Cross-validation is carried out through triangulation with FCO registration data, BIS-certified production capacities, and tendered delivery volumes. Any variance beyond acceptable thresholds is reconciled through iterative recalibration. This integrated sanity check ensures that final estimates of the India Biofertilizers Market reflect both regulatory-verified supply potential and ground-level adoption realities across India’s major agricultural states.
See What's Inside the Report
Get a preview of key findings, methodology and report coverage
Frequently Asked Questions
The India Biofertilizers Market has shown immense potential as sustainable agriculture becomes a national priority. The market was valued at USD 115 million in 2024, supported by massive agricultural output of 3,322.98 lakh tonnes of foodgrains and 355.48 million tonnes of horticultural produce. The demand surge is further driven by the PM-PRANAM initiative, which encouraged multiple states to significantly reduce chemical fertilizer consumption. As organic farming acreage expands and government schemes incentivize bio-based inputs, the biofertilizers market is positioned as a core enabler of soil regeneration and balanced nutrient management across India’s farming landscape.
The India Biofertilizers Market is characterized by a mix of public sector undertakings, cooperatives, and private manufacturers. Prominent players include IFFCO, National Fertilizers Limited (NFL), Gujarat State Fertilizers & Chemicals (GSFC), and Krishak Bharati Cooperative Limited (KRIBHCO), which have established wide rural distribution networks. Leading private participants include IPL Biologicals, Kan Biosys, Biostadt India, T. Stanes & Co., UPL Biosolutions, and Nova AgriTech. These companies maintain dominance through large fermentation capacities, BIS-certified product portfolios, and robust dealer and cooperative linkages spanning more than 36,000 PACS outlets nationwide, ensuring strong last-mile accessibility.
The India Biofertilizers Market is expanding due to multiple macroeconomic and agronomic factors. Nationwide implementation of the Soil Health Card program ensures precise nutrient management across more than 141 million hectares of cropped area, encouraging microbial input use. Worsening groundwater conditions—where extraction exceeds 240 BCM against recharge of roughly 150 BCM—are pushing farmers to adopt root-zone biology that enhances nutrient and moisture absorption. Additionally, India’s organic exports exceeding 2.6 lakh metric tonnes valued at over ₹5,500 crore highlight a growing preference for residue-free produce globally, creating strong downstream incentives for biofertilizer adoption within export-linked farming systems.
The India Biofertilizers Market continues to face structural and operational hurdles despite strong policy support. Chemical fertilizers still dominate agricultural input use, with urea production exceeding 300 LMT, creating an entrenched subsidy-driven dependency that slows biological alternatives. Limited testing and quality infrastructure—despite over 8,500 NABL-accredited laboratories nationwide—restrict uniform enforcement of microbial quality standards. Furthermore, hundreds of groundwater-stressed districts with high temperatures and fragmented supply chains hinder microbial viability during transport and storage, affecting farmer trust and consistent field performance across diverse agro-climatic zones.
License Options
PDF + Excel
Complete report package
$4,000
Excel Only
Data and analytics
$2,500
Custom Sections
Starts from $100
$0