India Labeling Market Outlook to 2035
By Label Type, By Printing Technology, By Material & Substrate, By End-Use Industry, and By Region
Report Overview
Report Code
TDR0407
Coverage
Asia
Published
January 2026
Pages
80
Flexible Purchase Options
Select and purchase only the chapters you need for your strategic decisions
On This Page
Report Overview
The report titled “India Labeling Market Outlook to 2035 – By Label Type, By Printing Technology, By Material & Substrate, By End-Use Industry, and By Region” provides a comprehensive analysis of the labeling industry in India. The report covers an overview and genesis of the market, overall market size in terms of value, detailed market segmentation; trends and developments, regulatory and compliance landscape, buyer and pack-owner profiling, key issues and challenges, and competitive landscape including competition scenario, cross-comparison, opportunities and bottlenecks, and company profiling of major players in the India labeling market.
Report Coverage
Verified Market Sizing
Multi-layer forecasting with historical data and 5–10 year outlook
Deep-Dive Segmentation
Cross-sectional analysis by product type, end user, application and region
Competitive Benchmarking & Positioning
Market share, operating model, pricing and competition matrices
Actionable Insights & Risk Assessment
High-growth white spaces, underserved segments, technology disruptions and demand inflection points
Review Methodology & Data Structure
Preview report structure, data sources and research framework
Executive Summary
The report titled “India Labeling Market Outlook to 2035 – By Label Type, By Printing Technology, By Material & Substrate, By End-Use Industry, and By Region” provides a comprehensive analysis of the labeling industry in India. The report covers an overview and genesis of the market, overall market size in terms of value, detailed market segmentation; trends and developments, regulatory and compliance landscape, buyer and pack-owner profiling, key issues and challenges, and competitive landscape including competition scenario, cross-comparison, opportunities and bottlenecks, and company profiling of major players in the India labeling market. The report concludes with future market projections based on packaged consumption growth, SKU proliferation, compliance-driven label upgrades, printing technology shifts, sustainability-led material transitions, digitalization of prepress and inspection workflows, cause-and-effect relationships, and case-based illustrations highlighting the major opportunities and cautions.
India Labeling Market Overview and Size
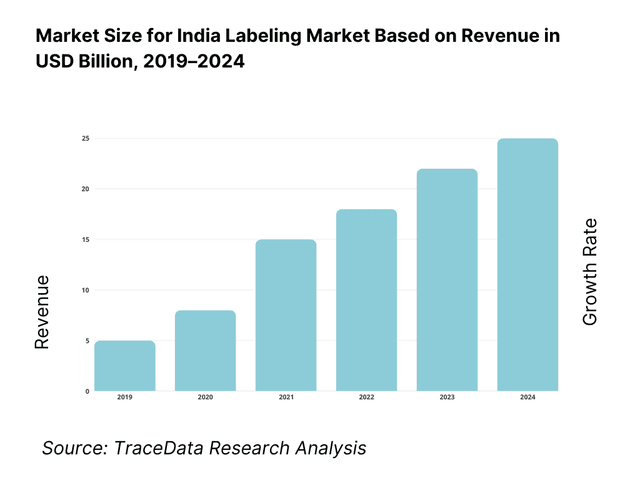
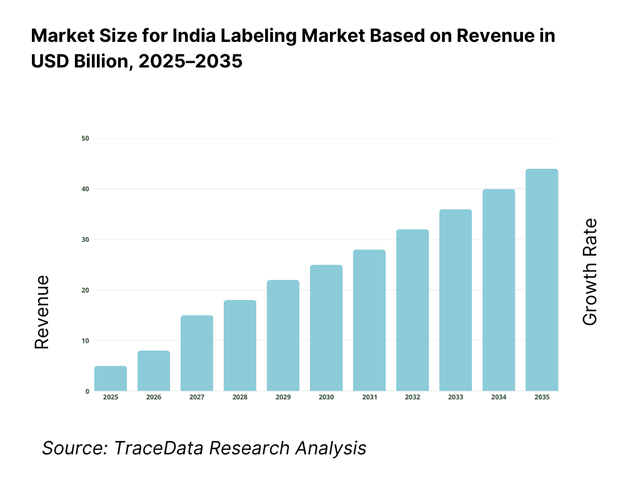
The India labeling market is valued at ~USD ~ billion (i.e. ~USD ~ billion). This reflects the combined demand for pressure-sensitive labels (PSL), wet glue labels, wrap-around labels, shrink sleeves, in-mold labels (IML), and specialized functional labels used across FMCG, food & beverage, pharmaceuticals, healthcare, personal care, home care, retail, logistics, chemicals, and industrial segments. Label consumption is structurally linked to India’s expanding packaged product universe, growth of organized retail and e-commerce, and the increasing requirement for product authentication, traceability, and compliant consumer information.
India’s labeling demand is concentrated around major manufacturing and consumption clusters, including Maharashtra–Gujarat industrial belt, Delhi NCR, Bengaluru–Tamil Nadu corridor, Hyderabad pharma cluster, and eastern manufacturing pockets. The market exhibits recurring characteristics driven by continuous replenishment of label inventory tied to production volumes, frequent artwork changes across brands, and ongoing SKU proliferation. As packaging lines become faster and more automated, label quality and consistency—such as adhesive performance, die-cut precision, scannability, and ink durability—become critical determinants of label supplier selection, pushing the market gradually from commodity print toward capability-led converting.
What Factors are Leading to the Growth of India Labeling Market:
• Expansion of Packaged Consumption and SKU Proliferation: India’s shift toward packaged food, beverages, personal care, and home care products is expanding the overall label consumption base. In addition to volume growth, increasing SKU proliferation—driven by multiple pack sizes, variants, and regional formats—has raised label complexity and refresh frequency. This has increased demand for high-quality labels that support branding, regulatory disclosure, and product differentiation across competitive retail environments.
• Growth of Regulated End-Use Industries: The expansion of pharmaceuticals, healthcare, nutraceuticals, and wellness categories is significantly increasing labeling requirements in India. These segments demand high print accuracy, compliance with statutory norms, tamper-evident features, and durability across storage and distribution conditions. As exports from these sectors rise, labeling standards increasingly align with global expectations for traceability, readability, and controlled artwork management.
• Shift Toward Pressure-Sensitive Labels and Automation-Ready Formats: Brand owners are increasingly adopting pressure-sensitive labels and sleeve formats due to their compatibility with high-speed packaging lines and premium packaging aesthetics. These formats offer better print quality, flexibility across container shapes, and easier integration of security and information features. This shift supports automation, reduces application errors, and improves consistency across multi-plant manufacturing networks.
Which Industry Challenges Have Impacted the Growth for India Labeling Market
• Intense Price Competition in Commoditized Label Segments: Basic paper and low-complexity labels face aggressive price-led procurement, where decisions are driven by per-unit cost rather than quality or lifecycle performance. This compresses margins for converters, increases execution risk on underpriced contracts, and limits reinvestment in automation, inspection systems, and capability upgrades.
• Raw Material Cost Volatility and Supply Dependence: Label converters rely on inputs such as paper, films, adhesives, inks, and liners, many of which are exposed to polymer price fluctuations and import dependencies. Volatility in input costs can disrupt profitability and lead times, especially under fixed-price contracts where cost pass-through mechanisms are limited.
• Operational Complexity from SKU Proliferation and Compliance Demands: Increasing SKU counts and frequent artwork changes raise the risk of errors related to incorrect labels, language mismatches, or non-compliant declarations. Managing large artwork libraries, version control, and inspection readiness adds operational complexity and overhead, particularly for converters without robust digital workflows and quality controls.
What are the Regulations and Initiatives which have Governed the Market:
• Mandatory Consumer Information and Label Compliance Requirements: Indian regulations require labels to carry detailed statutory information such as product identity, quantity, manufacturer details, batch numbers, dates, ingredients, and usage instructions. These requirements increase the importance of accuracy, proofing discipline, and structured change management across label design and production cycles.
• Traceability and Anti-Counterfeiting Initiatives in Regulated Categories: In sectors such as pharmaceuticals, healthcare, and high-value consumer goods, growing emphasis on traceability and product authentication is driving adoption of tamper-evident labels, variable data printing, QR codes, and security features. These initiatives strengthen demand for technologically advanced and compliance-ready labeling solutions.
• Sustainability-Driven Packaging and Material Guidelines: Sustainability priorities linked to corporate ESG commitments and waste reduction goals are influencing label material choices and design structures. Increasing focus on recyclable-compatible labels, wash-off adhesives, and reduced liner waste is shaping label development decisions, encouraging converters to invest in sustainable materials and process validation.
India Labeling Market Segmentation
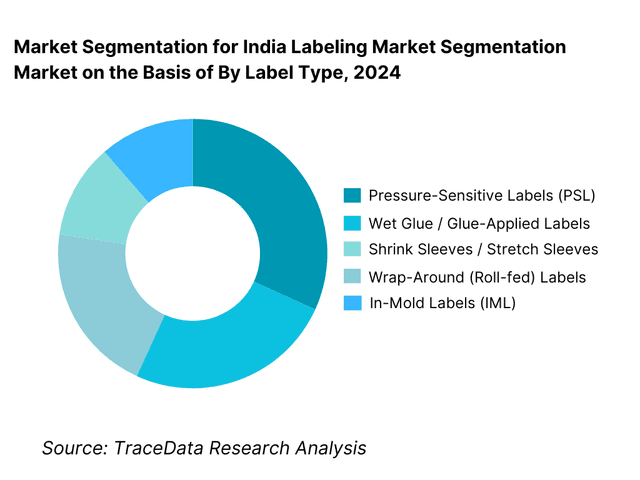
By Label Type: Pressure-Sensitive Labels hold dominance. This is because pressure-sensitive labels offer strong compatibility with automated packaging lines, high print quality, and flexibility across shapes, substrates, and end-use requirements. PSL formats also enable value-added applications such as security features, variable data, and premium finishes, making them preferred for FMCG and pharma packaging. Shrink sleeves and wrap-around labels remain relevant for beverages and select food categories, while wet glue labels persist in cost-sensitive segments.
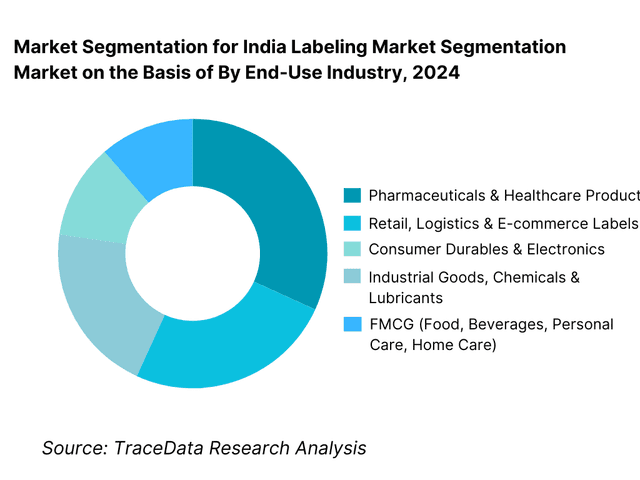
By End-Use Industry: FMCG and Pharmaceuticals dominate the market. FMCG drives scale through high production volumes and large SKU bases across personal care, home care, and packaged foods. Pharmaceuticals and healthcare contribute high compliance intensity and higher-value label requirements. Logistics and retail-driven labeling is expanding steadily, supported by e-commerce fulfillment growth and warehouse labeling needs.
Competitive Landscape in India Labeling Market
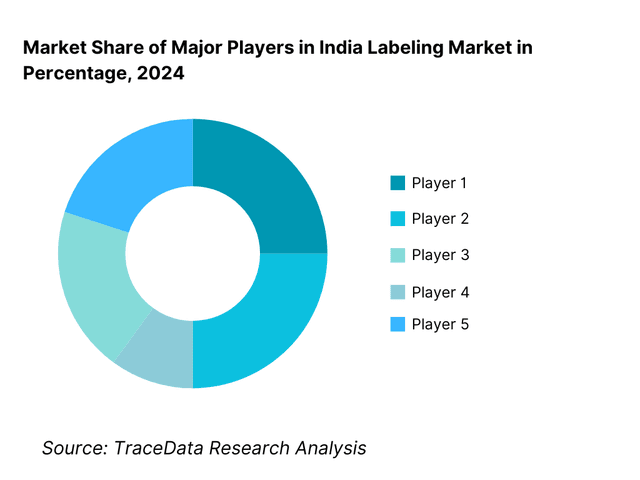
The India labeling market is moderately fragmented, led by a set of organized label converters with multi-plant footprints, process maturity, and capability to serve national FMCG and pharmaceutical accounts, alongside a large base of regional and local converters competing on proximity and price. Competitive advantage is driven by quality consistency, color management, inspection and verification capability, on-time delivery performance, ability to manage SKU complexity, and access to specialized substrates and adhesives. Organized players increasingly differentiate through digital printing, workflow automation, inline inspection systems, and premium finishing capabilities, while smaller players remain concentrated in commodity labels and regional accounts.
| Name | Founding Year | Original Headquarters |
|---|---|---|
| Skanem India | 2001 | India |
| Any Graphics | 1996 | India |
| Interlabels Industries | 1999 | India |
| Paharpur 3P | 1923 (Paharpur Group origin) | India |
| Huhtamaki (Labels & Packaging) | 1920 | Finland |
| Constantia Flexibles (Labels) | 1886 | Austria |
| Printmann Group | 1984 | India |
| Letragraphix | 2002 | India |
| Wintek Flexo | 2005 | India |
| Other regional label converters | ~1990s–2000s | India |
Some of the recent competitor trends and key information about competitors include:
Organized converters are strengthening capability in premium pressure-sensitive labels, filmic substrates, and compliance-heavy labeling for pharma and personal care, supported by investments in inspection, QA systems, and automation.
Regional converters are selectively upgrading equipment to serve growing local FMCG and food manufacturers and to improve speed-to-market through short-run flexibility and faster response cycles.
Smaller players continue to compete in cost-sensitive segments and basic labeling applications, though rising automation and compliance expectations are gradually increasing barriers in higher-value segments.
Technology-led differentiation is becoming more visible through adoption of digital printing, VDP readiness, barcode verification, and workflow systems that reduce error rates across high-SKU portfolios.
What Lies Ahead for India Labeling Market?
The India labeling market is expected to expand steadily by 2035, supported by packaged goods expansion, rising healthcare manufacturing, export-driven compliance intensity, and continued SKU proliferation across FMCG. Growth momentum will be reinforced by the shift from commodity print toward performance-driven and compliance-ready labels, along with increasing sustainability alignment and digitalization of artwork and quality workflows.
Shift toward value-added and compliance-led labeling formats:
Demand will rise for labels with tamper evidence, security features, variable data printing readiness, and high durability. Regulated and premium segments will increasingly favor converters that can demonstrate robust quality processes and error prevention through inspection systems.
Sustainability-driven materials and recycling-aligned label design will accelerate:
Brand owners will push for recyclable-friendly structures and reduced waste formats, including downgauged films, liner optimization, and adhesives aligned with recycling processes. Converters with strong substrate innovation partnerships will be better positioned to capture future demand.
Digital workflows and inspection will become baseline expectations for large brand owners:
Artwork management, automated proofing, traceability of design changes, inline inspection, and barcode verification will increasingly shift from differentiators to minimum requirements, especially for multi-plant FMCG and pharmaceutical accounts.
Supplier consolidation and preferred-partner models will increase:
Brand owners will continue rationalizing supplier bases to reduce operational complexity and quality risks. This will gradually shift share toward organized converters with consistent output across locations, scalable capacity, and mature governance systems.
India Labeling Market Segmentation
By Label Type
• Pressure-Sensitive Labels (PSL)
• Wet Glue / Glue-Applied Labels
• Shrink Sleeves & Stretch Sleeves
• Wrap-Around (Roll-fed) Labels
• In-Mold Labels (IML)
• Security & Specialty Functional Labels
By Printing Technology
• Flexographic Printing
• Digital Printing
• Offset Printing
• Gravure Printing
• Screen Printing (special applications)
By Material & Substrate
• Paper-based Labels
• BOPP / PP Film Labels
• PET Film Labels
• PE Film Labels
• Specialty & Composite Materials
By End-Use Industry
• FMCG (Food, Beverages, Personal Care, Home Care)
• Pharmaceuticals & Healthcare Products
• Retail, Logistics & E-commerce
• Industrial Goods & Chemicals
• Consumer Durables & Electronics
• Others
By Region
• North India
• West India
• South India
• East India
• Central India
Players Mentioned in the Report:
• Skanem India
• Any Graphics
• Interlabels Industries
• Paharpur 3P
• Huhtamaki
• Constantia Flexibles
• Printmann Group
• Letragraphix
• Wintek Flexo
• Other regional and local label converters and specialty printing firms
Key Target Audience
• FMCG brand owners and packaging procurement teams
• Pharmaceutical and healthcare product manufacturers
• Food and beverage processors and exporters
• Label converters and printing companies
• Raw material suppliers (papers, films, adhesives, inks, coatings)
• Packaging machinery and automation companies
• Quality, compliance, and regulatory teams managing labeling governance
• Investors and strategic buyers evaluating packaging and printing ecosystems
Time Period:
• Historical Period: 2019–2024
• Base Year: 2025
• Forecast Period: 2025–2035
Explore Flexible Purchase Options or Have Limited Budget?
Pay only for relevant chapters • Customizable report sections
Table of Contents
Choose individual sections to purchase. Mix and match as you like.
4. 1 Delivery Model Analysis for Labeling Solutions-In-House Label Production, Outsourced Label Converters, Integrated Packaging Suppliers, Digital Labeling Platforms [Margins, Preference, Strength & Weakness]
4. 2 Revenue Streams for India Labeling Market [Label Sales, Contract Manufacturing, Design & Prepress Services, Value-Added & Specialty Labeling Services]
4. 3 Business Model Canvas for India Labeling Market [Key Partners, Key Activities, Value Propositions, Customer Segments, Cost Structure, Revenue Streams]
5. 1 Local Players vs Global Vendors [Indian Label Converters vs Multinational Labeling Companies]
5. 2 Investment Model in India Labeling Market [Capacity Expansion, PE Investments, Strategic Acquisitions, Technology Upgrades]
5. 3 Comparative Analysis of Labeling Adoption in Organized vs Unorganized Packaging Segments [Procurement Models, Use Cases, Cost & Quality Benchmarks]
5. 4 Labeling Spend Allocation by Enterprise Size [Large Enterprises, Medium Enterprises, SMEs]
8. 1 Revenues (Historical Trend)
9. 1 By Market Structure (In-House Labeling vs Outsourced Label Converters)
9. 2 By Label Technology (Pressure-Sensitive Labels, Glue-Applied Labels, Sleeve Labels, In-Mold Labels, Digital Labels)
9. 3 By End-Use Industry Verticals (FMCG, Food & Beverage, Pharmaceuticals, Cosmetics & Personal Care, Chemicals, Logistics)
9. 4 By Enterprise Size (Large Enterprises, Medium Enterprises, SMEs)
9. 5 By Use Case/Function (Branding & Marketing, Regulatory Compliance, Traceability, Anti-Counterfeiting)
9. 6 By Printing Technology (Flexographic, Gravure, Offset, Digital)
9. 7 By Standard vs Customized Labeling Solutions
9. 8 By Region (North India, West India, South India, East India)
10. 1 Brand Owners & Packaging Buyers Landscape and Cohort Analysis
10. 2 Labeling Adoption Drivers & Decision-Making Process
10. 3 Cost Efficiency, Quality Requirements & ROI Analysis
10. 4 Gap Analysis Framework
11. 1 Trends & Developments in India Labeling Market
11. 2 Growth Drivers for India Labeling Market
11. 3 SWOT Analysis for India Labeling Market
11. 4 Issues & Challenges for India Labeling Market
11. 5 Government Regulations for India Labeling Market
12. 1 Market Size and Future Potential for Digital & Smart Labels in India
12. 2 Business Models & Revenue Streams [Smart Labels, Track & Trace Solutions, Compliance-Driven Labeling]
12. 3 Delivery Models & Labeling Applications Offered [Barcode Labels, RFID Labels, QR-Based Smart Labels]
15. 1 Market Share of Key Players in India Labeling Market (By Revenues)
15. 2 Benchmark of Key Competitors [Company Overview, USP, Business Strategies, Business Model, Production Capacity, Revenues, Pricing Models, Technology Used, Key End-Use Clients, Strategic Tie-ups, Marketing Strategy, Recent Developments]
15. 3 Operating Model Analysis Framework
15. 4 Gartner Magic Quadrant for Labeling Solution Providers
15. 5 Bowman’s Strategic Clock for Competitive Advantage
16. 1 Revenues (Projections)
17. 1 By Market Structure (In-House and Outsourced Labeling)
17. 2 By Label Technology (PSL, Glue-Applied, Sleeves, IML, Digital)
17. 3 By End-Use Industry Verticals (FMCG, Food & Beverage, Pharma, Cosmetics, Chemicals, Logistics)
17. 4 By Enterprise Size (Large Enterprises, Medium-Sized Enterprises, SMEs)
17. 5 By Use Case/Function (Branding, Compliance, Traceability, Anti-Counterfeiting)
17. 6 By Printing Technology (Flexo, Gravure, Offset, Digital)
17. 7 By Standard vs Customized Labeling Programs
17. 8 By Region (North, West, South, East India)
Discuss a Customized Research Scope
Custom research scope • Tailored insights • Industry expertise
Research Methodology
Step 1: Ecosystem Creation
• Map the ecosystem and identify all demand-side and supply-side entities within the India Labeling Market. On the demand side, include FMCG manufacturers, food and beverage brands, pharmaceutical and healthcare product companies, personal care and home care brands, industrial goods producers, retailers, logistics operators, and e-commerce fulfillment ecosystems. On the supply side, include organized label converters, regional converters, small print shops, substrate and adhesive suppliers, ink and coating vendors, prepress and plate-making providers, finishing and inspection system vendors, and packaging machinery ecosystems.
• Based on this ecosystem, shortlist leading ~8–12 converters and capability clusters in the country considering technology stack, scale, sector presence, and operational maturity.
• Sourcing for this step is conducted through industry mapping, procurement patterns, capability assessment frameworks, and operational benchmarking logic to establish how value is created and captured.
Step 2: Desk Research
• Engage in an exhaustive desk research process by referencing diverse secondary and proprietary datasets to analyze packaged consumption growth, category output trends, SKU proliferation, labeling compliance expectations, and printing technology adoption patterns.
• Evaluate converter-level capability signals such as press types, finishing capabilities, substrate portfolios, QA systems, and sector focus to develop segmentation logic and competitive structure assumptions.
• Build an initial market model to structure label demand by label type, end-use, and capability tier, supported by application intensity and packaging line automation assumptions.
Step 3: Primary Research
• Initiate in-depth interviews with converter owners, operations heads, quality managers, procurement teams, packaging engineers, and brand packaging managers to validate market hypotheses and segmentation splits.
• Capture insights on pricing logic, run-length trends, artwork change frequency, inspection adoption, sustainability transitions, and supplier selection criteria across key end-use industries.
• Undertake disguised validation as prospective customers to benchmark response time commitments, sampling and approvals flow, SOP maturity, and quality assurance practices.
• Apply a bottom-to-top aggregation approach using category production logic, label consumption intensity, and supplier coverage estimates to triangulate market sizing and segmentation.
Step 4: Sanity Check
• Use bottom-to-top and top-to-bottom reconciliation approaches to ensure internal consistency of market models.
• Conduct sensitivity testing across variables such as packaged goods growth, PSL penetration increase, sustainability adoption pace, and digital printing penetration to develop robust forecast scenarios.
• Finalize assumptions only after alignment is achieved across demand intensity, supplier capacity realities, and observed pricing and operational practices.
See What's Inside the Report
Get a preview of key findings, methodology and report coverage
Frequently Asked Questions
The India labeling market holds strong potential through 2035, supported by continued expansion of packaged FMCG categories, rising healthcare and pharmaceutical production, growing e-commerce fulfillment volumes, and sustained SKU proliferation. The market’s value creation will increasingly shift toward compliance-led and value-added labels, where quality consistency, inspection readiness, and operational reliability drive supplier preference.
The market features a mix of organized national converters and regional players. Key players include Skanem India, Any Graphics, Interlabels Industries, Paharpur 3P, Huhtamaki, Constantia Flexibles, Printmann Group, Letragraphix, Wintek Flexo, and other regional converters serving FMCG and pharma clusters.
Key growth drivers include packaged consumption growth, SKU proliferation, increased regulatory and compliance intensity in healthcare and food categories, adoption of pressure-sensitive labels and sleeves, and rising packaging line automation. Sustainability-led packaging transitions and digitization of artwork and inspection workflows further support expansion of higher-value label formats.
Challenges include intense price competition in commoditized segments, raw material and substrate cost volatility, operational complexity from frequent artwork changes and SKU proliferation, and performance risks during sustainability-driven material transitions. In addition, meeting compliance accuracy and reducing quality incidents across high-speed packaging lines requires investments in inspection systems, workflow discipline, and stronger governance.
License Options
PDF + Excel
Complete report package
$4,000
Excel Only
Data and analytics
$2,500
Custom Sections
Starts from $100
$0