India Perimeter Security Market Outlook to 2035
By Component Type, By End-Use Sector, By Technology, By Deployment Model, and By Region
Report Overview
Report Code
TDR0461
Coverage
Asia
Published
January 2026
Pages
80
Flexible Purchase Options
Select and purchase only the chapters you need for your strategic decisions
On This Page
Report Overview
The report titled “India Perimeter Security Market Outlook to 2035 – By Component Type, By End-Use Sector, By Technology, By Deployment Model, and By Region” provides a comprehensive analysis of the perimeter security industry in India. The report covers an overview and genesis of the market, overall market size in terms of value, detailed market segmentation; trends and developments, regulatory and standards landscape, buyer-level demand profiling, key issues and challenges, and competitive landscape including competition scenario, cross-comparison, opportunities and bottlenecks, and company profiling of major players operating in the India perimeter security market.
Report Coverage
Verified Market Sizing
Multi-layer forecasting with historical data and 5–10 year outlook
Deep-Dive Segmentation
Cross-sectional analysis by product type, end user, application and region
Competitive Benchmarking & Positioning
Market share, operating model, pricing and competition matrices
Actionable Insights & Risk Assessment
High-growth white spaces, underserved segments, technology disruptions and demand inflection points
Review Methodology & Data Structure
Preview report structure, data sources and research framework
Executive Summary
The report titled “India Perimeter Security Market Outlook to 2035 – By Component Type, By End-Use Sector, By Technology, By Deployment Model, and By Region” provides a comprehensive analysis of the perimeter security industry in India. The report covers an overview and genesis of the market, overall market size in terms of value, detailed market segmentation; trends and developments, regulatory and standards landscape, buyer-level demand profiling, key issues and challenges, and competitive landscape including competition scenario, cross-comparison, opportunities and bottlenecks, and company profiling of major players operating in the India perimeter security market.
The report concludes with future market projections based on infrastructure expansion, industrial and logistics park development, urban security modernization, critical infrastructure protection mandates, public-sector procurement programs, regional demand drivers, cause-and-effect relationships, and case-based illustrations highlighting the major opportunities and cautions shaping the India perimeter security market through 2035.
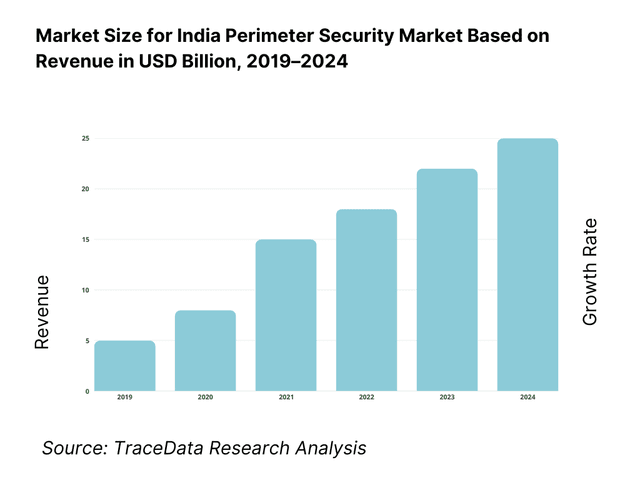
India Perimeter Security Market Overview and Size
The India perimeter security market is valued at approximately ~USD ~ billion, representing the deployment of physical, electronic, and integrated security systems designed to detect, deter, delay, and prevent unauthorized access to secured premises. The market includes fencing systems, barriers, gates, bollards, access control, intrusion detection systems, video surveillance, radar- and sensor-based solutions, command-and-control software, and integrated perimeter security platforms deployed across civilian, industrial, and defense environments.
Perimeter security systems are increasingly adopted across India due to rising concerns around asset protection, infrastructure security, terrorism and sabotage risks, theft and vandalism, and compliance with security norms for sensitive installations. Demand spans greenfield projects as well as retrofit and upgrade of existing facilities, with increasing emphasis on layered security architectures combining physical barriers with intelligent electronic detection and centralized monitoring.
The market is anchored by India’s expanding infrastructure base, rapid industrialization, growth in logistics and warehousing, airport and port modernization, data center investments, smart city programs, and heightened security requirements for defense, borders, and public utilities. Perimeter security solutions benefit from increasing preference for scalable, technology-enabled systems that can be customized based on threat profiles, site conditions, and regulatory requirements while enabling remote monitoring and faster incident response.
Northern and Western India represent the largest demand centers for perimeter security systems. Northern regions drive demand due to border security needs, defense installations, airports, and large public infrastructure projects. Western India leads in industrial, logistics, port, refinery, and data center-led perimeter security deployments. Southern India shows strong demand from IT campuses, manufacturing clusters, and urban infrastructure projects, while Eastern India is witnessing growing adoption driven by mining, power generation, railways, and port-led development. Retrofit demand remains significant across older industrial estates, government facilities, and transportation infrastructure nationwide.
What Factors are Leading to the Growth of the India Perimeter Security Market
Expansion of critical infrastructure, logistics, and industrial facilities strengthens perimeter security demand: India continues to invest heavily in logistics parks, industrial corridors, airports, ports, power plants, refineries, rail networks, and urban infrastructure under national and state-level development programs. These assets require robust perimeter protection to safeguard operations, personnel, and high-value equipment. Warehouses, logistics hubs, industrial plants, and utilities increasingly deploy integrated perimeter security systems combining fencing, access control, intrusion detection, and surveillance to secure large, open sites with multiple access points. The need for standardized yet scalable security solutions across multi-site infrastructure portfolios directly increases demand for perimeter security systems.
Heightened focus on national security, border protection, and public safety accelerates adoption: India’s evolving security environment has led to sustained investment in perimeter security across defense establishments, border areas, airports, seaports, and sensitive government facilities. Advanced perimeter intrusion detection systems, smart fencing, radar-based detection, thermal imaging, and centralized command systems are increasingly adopted to improve situational awareness and response times. These requirements are driving demand for technology-intensive solutions that go beyond conventional fencing, supporting the shift toward integrated and intelligent perimeter security architectures.
Growing preference for technology-enabled, centrally monitored security systems improves market penetration: Buyers across public and private sectors are increasingly prioritizing perimeter security solutions that offer real-time monitoring, analytics, and integration with broader security and facility management systems. Labor availability constraints, the need for continuous surveillance, and rising operating costs are pushing organizations to adopt sensor-based and automated detection systems that reduce reliance on manual guarding. Integrated perimeter security platforms provide earlier threat detection, fewer false alarms, and improved lifecycle cost efficiency, making them attractive to industrial operators, infrastructure developers, and public-sector agencies working under strict security and compliance mandates.
Which Industry Challenges Have Impacted the Growth of the India Perimeter Security Market:
High upfront capital costs and budget sensitivity slow adoption in price-conscious segments: While integrated perimeter security systems offer long-term operational benefits, they often involve significant upfront investment in fencing infrastructure, sensors, surveillance equipment, communication networks, and command-and-control software. For many industrial operators, warehouses, utilities, and state-level public-sector buyers operating under tight capital budgets, these costs can delay procurement decisions or lead to phased deployments rather than comprehensive perimeter coverage. Cost sensitivity is particularly pronounced in retrofit projects, where site constraints, legacy infrastructure, and civil modification requirements further increase total project cost and complicate return-on-investment assessments.
Fragmented implementation and integration challenges reduce system effectiveness: Perimeter security projects in India are frequently executed through multiple vendors covering fencing, electronics, surveillance, access control, and monitoring systems. Limited system integration, inconsistent technology standards, and interoperability challenges can reduce the effectiveness of the overall security architecture. Inadequate integration between physical barriers and electronic detection systems may lead to blind spots, higher false alarm rates, and delayed response times. These challenges increase lifecycle maintenance complexity and can undermine buyer confidence in advanced perimeter security solutions, particularly among first-time adopters.
Operational and maintenance constraints affect long-term system reliability: Perimeter security systems deployed in India often operate in harsh environmental conditions, including high temperatures, dust, humidity, monsoons, and unreliable power supply in certain regions. These factors can impact sensor accuracy, equipment lifespan, and system uptime if not addressed through robust design, protective enclosures, and regular maintenance. Limited availability of trained technical personnel for system calibration, troubleshooting, and software upgrades further exacerbates operational challenges, particularly for installations in remote industrial sites, border regions, and critical infrastructure locations.
What are the Regulations and Initiatives which have Governed the Market:
Security standards and guidelines for critical infrastructure, defense, and public facilities: Perimeter security deployments in India are governed by a combination of sector-specific guidelines, defense standards, and security advisories issued by central and state authorities. Critical infrastructure such as airports, ports, power plants, oil and gas facilities, and government installations must comply with prescribed security norms covering access control, intrusion detection, surveillance coverage, and response protocols. These requirements influence system design, technology selection, redundancy levels, and documentation, often necessitating coordination between security consultants, system integrators, and end-user agencies to ensure compliance.
Smart city, transportation, and infrastructure modernization initiatives shaping adoption: National and state-led infrastructure modernization programs, including smart city initiatives, airport expansion, metro rail projects, and logistics park development, have incorporated perimeter security as a core design requirement. These programs emphasize centralized monitoring, technology-enabled surveillance, and integration with broader command-and-control platforms. While such initiatives create demand opportunities for advanced perimeter security solutions, they also introduce stringent technical specifications, performance benchmarks, and procurement qualification criteria that shape vendor participation and competitive dynamics.
Public procurement frameworks and tendering processes influencing market structure: Perimeter security projects commissioned by government bodies, public-sector undertakings, and infrastructure authorities typically follow formal tendering and procurement frameworks emphasizing technical compliance, financial transparency, and bidder qualification. These processes often require extensive documentation, certifications, field trials, and reference installations, extending procurement timelines and increasing bid preparation costs. While these frameworks aim to ensure accountability and system reliability, they can also favor established players with proven track records, creating entry barriers for smaller or newer solution providers.
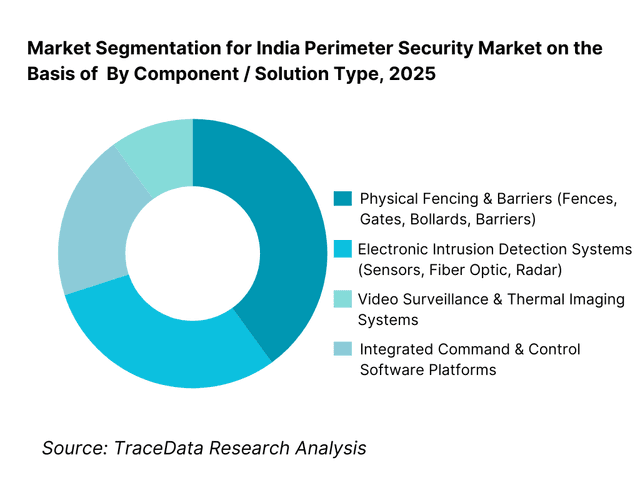
India Perimeter Security Market Segmentation
By Component / Solution Type: The physical fencing and barrier systems segment holds dominance in the India perimeter security market. This is because a large share of perimeter protection demand originates from industrial plants, logistics parks, utilities, mining sites, and public infrastructure where first-line physical deterrence is mandatory. Chain-link fencing, welded mesh, razor wire, concertina coils, crash-rated barriers, and gates remain foundational to most security architectures.
However, growth momentum is increasingly shifting toward electronic and intelligent detection systems, particularly in critical infrastructure, defense installations, airports, data centers, and smart city projects where early threat detection, reduced manpower dependence, and centralized monitoring are prioritized.
By End-Use Sector: Defense, critical infrastructure, and industrial sectors dominate the India perimeter security market. These buyers operate large, open, and high-risk sites requiring layered security, long perimeter coverage, and continuous monitoring. Government-led procurement for borders, airports, ports, power plants, oil & gas facilities, and rail infrastructure accounts for a significant share of overall demand.
Industrial and logistics players follow closely, driven by asset protection needs, theft prevention, insurance compliance, and regulatory security requirements. Commercial and institutional adoption is growing steadily, particularly in IT campuses, large residential communities, and urban infrastructure projects.

Competitive Landscape in India Perimeter Security Market
The India perimeter security market exhibits moderate fragmentation, characterized by a mix of large domestic fencing manufacturers, electronic security solution providers, system integrators, and a limited presence of global technology players. Competition is shaped by project execution capability, compliance with government and defense specifications, local manufacturing strength, integration expertise, after-sales support, and ability to participate in public tenders.
While domestic players dominate physical fencing, barriers, and gates, electronic detection systems and advanced surveillance technologies often involve partnerships with international OEMs or licensed technology providers. System integrators play a critical role in bundling physical, electronic, and software layers into end-to-end perimeter security solutions, especially for government and infrastructure projects.
Key Players Operating in India Perimeter Security Market
Name | Founding Year | Original Headquarters |
Tata Advanced Systems | 2001 | Hyderabad, India |
Larsen & Toubro | 1938 | Mumbai, India |
Godrej Security Solutions | 1897 | Mumbai, India |
CP PLUS | 2007 | Noida, India |
Zicom | 1995 | Mumbai, India |
Honeywell | 1906 | Charlotte, USA |
Bosch Security Systems | 1886 | Gerlingen, Germany |
Hikvision | 2001 | Hangzhou, China |
Some of the Recent Competitor Trends and Key Information About Competitors Include:
Tata Advanced Systems: The company plays a strategic role in high-security and defense-linked perimeter protection projects, particularly where surveillance, command systems, and integration with national security infrastructure are required. Its strength lies in program execution, compliance with defense procurement norms, and system-level integration rather than commodity hardware supply.
Larsen & Toubro: L&T participates primarily as an EPC and system integrator in large infrastructure and public-sector projects. Its competitive advantage stems from the ability to embed perimeter security into broader infrastructure contracts, combining civil works, electronics, automation, and lifecycle maintenance under a single delivery framework.
Godrej Security Solutions: Godrej maintains a strong presence in physical security products such as fencing, barriers, access control, and integrated security offerings for industrial and commercial clients. Its established brand, domestic manufacturing base, and nationwide service network support steady demand across institutional and enterprise segments.
CP PLUS and Zicom: These players are prominent in surveillance-led perimeter security deployments, particularly across commercial campuses, industrial sites, and urban infrastructure. Competitive pricing, local assembly, and wide channel reach allow them to scale volume-driven projects, though margins remain sensitive to price competition.
Global Technology Providers (Honeywell, Bosch, Hikvision): International players remain influential in high-spec installations requiring advanced analytics, thermal imaging, radar-based detection, and integrated security management platforms. Their participation is often routed through Indian system integrators or local partners, with adoption influenced by compliance requirements, cybersecurity considerations, and government procurement policies.

What Lies Ahead for India Perimeter Security Market?
The India perimeter security market is expected to expand steadily through 2035, supported by sustained investment in critical infrastructure, border management, industrial expansion, logistics parks, urban security modernization, and heightened focus on asset protection across public and private sectors. Growth momentum is reinforced by government-led infrastructure programs, rising security awareness among industrial operators, and increasing adoption of technology-enabled security architectures that reduce dependence on manual guarding. As facilities become larger, more distributed, and operationally complex, perimeter security will remain a foundational layer of India’s physical and electronic security ecosystem.
Shift Toward Integrated and Layered Perimeter Security Architectures: The future of the India perimeter security market will increasingly move away from standalone fencing or surveillance toward layered security designs combining physical barriers, intrusion detection, video analytics, and centralized command platforms. High-risk and high-value installations such as airports, ports, power plants, data centers, and defense facilities require early detection, threat classification, and coordinated response. Vendors and system integrators capable of delivering end-to-end perimeter solutions—rather than discrete products—will capture higher-value projects and long-term service contracts.
Rising Demand for Technology-Enabled and Low-Manpower Security Solutions: Labor availability constraints, rising guard costs, and the need for 24×7 monitoring are pushing buyers toward automated detection systems such as fiber-optic sensors, radar, thermal cameras, and AI-enabled video analytics. These technologies improve detection accuracy, reduce false alarms, and support centralized monitoring across multiple sites. Through 2035, demand will increasingly favor solutions that offer measurable reductions in operating costs and improved security outcomes, particularly in industrial and infrastructure-led deployments.
Expansion of Infrastructure, Logistics, and Industrial Footprints Driving Volume Demand: India’s continued expansion of logistics hubs, industrial corridors, manufacturing parks, and utilities will drive large-scale perimeter security deployments. These sites typically require long perimeter coverage, multiple access points, and scalable designs that can be expanded over time. Standardized perimeter security specifications across multi-site programs will benefit suppliers with strong execution capability, local manufacturing, and nationwide service networks.
Growing Role of Software, Analytics, and Centralized Command Systems:
Beyond hardware, the perimeter security market will see increased emphasis on software platforms that enable centralized command-and-control, incident management, and integration with access control, emergency response, and facility management systems. Buyers will increasingly evaluate perimeter security investments based on data visibility, response time improvement, and system interoperability rather than hardware cost alone. Vendors offering modular, upgradeable platforms will be better positioned to serve long-term customer needs.

India Perimeter Security Market Segmentation
By Component / Solution Type
• Physical Fencing & Barriers (Chain-Link, Welded Mesh, Razor Wire, Gates, Bollards)
• Electronic Intrusion Detection Systems (Fiber Optic, Microwave, Radar, Sensors)
• Video Surveillance & Thermal Imaging Systems
• Integrated Command & Control and Security Management Software
By Technology
• Conventional Physical Security Systems
• Sensor-Based Intrusion Detection
• Video Analytics and AI-Based Surveillance
• Radar and Thermal Detection Technologies
• Integrated and Networked Security Platforms
By Deployment Model
• Standalone Physical Security Installations
• Integrated Physical + Electronic Security Systems
• Centralized Command-and-Control Deployments
• Managed Security and AMC-Based Models
By End-Use Sector
• Defense & Border Security
• Critical Infrastructure (Airports, Ports, Power, Oil & Gas, Railways)
• Industrial & Logistics (Manufacturing, Warehousing, Mining, SEZs)
• Commercial & Institutional (IT Parks, Campuses, Real Estate)
• Others (Utilities, Agriculture, Niche Applications)
By Region
• North India
• West India
• South India
• East India
Players Mentioned in the Report:
• Domestic fencing and barrier manufacturers
• Electronic security solution providers
• Surveillance and video analytics companies
• Defense and infrastructure system integrators
• Global security technology OEMs with Indian presence
• Regional system integrators and EPC contractors
Key Target Audience
• Perimeter security manufacturers and component suppliers
• Electronic security and surveillance solution providers
• System integrators and EPC contractors
• Defense and homeland security agencies
• Airport, port, and transportation authorities
• Industrial and logistics park developers
• Power, oil & gas, and utility operators
• Smart city and urban infrastructure authorities
• Private equity and infrastructure-focused investors
Time Period:
Historical Period: 2019–2024
Base Year: 2025
Forecast Period: 2025–2035
Explore Flexible Purchase Options or Have Limited Budget?
Pay only for relevant chapters • Customizable report sections
Table of Contents
Choose individual sections to purchase. Mix and match as you like.
4. 1 Delivery Model Analysis for Perimeter Security Solutions-Physical Security, Electronic Security, Integrated Systems, Managed Security [Margins, Preference, Strength & Weakness]
4. 2 Revenue Streams for India Perimeter Security Market [Hardware Sales, System Integration, Software Licensing, AMC & Managed Services]
4. 3 Business Model Canvas for India Perimeter Security Market [Key Partners, Key Activities, Value Propositions, Customer Segments, Cost Structure, Revenue Streams]
5. 1 Local Players vs Global Vendors [Domestic Integrators vs Global Security OEMs etc.]
5. 2 Investment Model in India Perimeter Security Market [Government Spending, Infrastructure Capex, Private Investments, PPP Models]
5. 3 Comparative Analysis of Perimeter Security Adoption in Public vs Private Organizations [Procurement Models, Threat Profiles, ROI Benchmarks]
5. 4 Perimeter Security Budget Allocation by Organization Size [Large Enterprises, Mid-Sized Enterprises, SMEs]
8. 1 Revenues (Historical Trend)
9. 1 By Market Structure (Standalone Security vs Integrated Security Systems)
9. 2 By Technology (Physical Barriers, Sensors & Intrusion Detection, Video Surveillance & Analytics, Radar & Thermal Systems)
9. 3 By End-Use Verticals (Defense, Critical Infrastructure, Industrial & Logistics, Commercial, Public Sector)
9. 4 By Organization Size (Large Enterprises, Medium Enterprises, SMEs)
9. 5 By Application / Use Case (Border Security, Industrial Asset Protection, Critical Infrastructure Protection, Campus Security)
9. 6 By Deployment Mode (On-Premise, Centralized Command & Control, Hybrid Deployments)
9. 7 By Standard vs Customized Security Solutions
9. 8 By Region (North India, West India, South India, East India)
10. 1 Client Landscape and Cohort Analysis (Defense, Infrastructure, Industrial, Commercial)
10. 2 Perimeter Security Adoption Drivers & Decision-Making Process
10. 3 Security Effectiveness & ROI Analysis
10. 4 Gap Analysis Framework
11. 1 Trends & Developments in India Perimeter Security Market
11. 2 Growth Drivers for India Perimeter Security Market
11. 3 SWOT Analysis for India Perimeter Security Market
11. 4 Issues & Challenges for India Perimeter Security Market
11. 5 Government Regulations for India Perimeter Security Market
12. 1 Market Size and Future Potential for Technology-Enabled Perimeter Security in India
12. 2 Business Models & Revenue Streams [Hardware + Software, Security-as-a-Service, AMC-Based Models]
12. 3 Delivery Models & Applications Offered [Integrated Security Platforms, Surveillance Analytics, Intrusion Detection Systems]
15. 1 Market Share of Key Players in India Perimeter Security Market (By Revenues)
15. 2 Benchmark of Key Competitors [Company Overview, USP, Business Strategies, Business Model, Project Portfolio, Revenues, Pricing Models, Technology Used, Key Solutions, Major Clients, Strategic Tie-ups, Marketing Strategy, Recent Developments]
15. 3 Operating Model Analysis Framework
15. 4 Gartner Magic Quadrant for Security & Surveillance Providers
15. 5 Bowman’s Strategic Clock for Competitive Advantage
16. 1 Revenues (Projections)
17. 1 By Market Structure (Standalone and Integrated Security Systems)
17. 2 By Technology (Physical, Electronic, Intelligent & AI-Enabled Systems)
17. 3 By End-Use Verticals (Defense, Infrastructure, Industrial, Commercial, Public Sector)
17. 4 By Organization Size (Large Enterprises, Medium-Sized Enterprises, SMEs)
17. 5 By Application / Use Case (Border, Infrastructure, Industrial, Campus Security)
17. 6 By Deployment Mode (On-Premise, Centralized, Hybrid)
17. 7 By Standard vs Customized Solutions
17. 8 By Region (North, West, South, East India)
Discuss a Customized Research Scope
Custom research scope • Tailored insights • Industry expertise
Research Methodology
Step 1: Ecosystem Creation
We begin by mapping the complete ecosystem of the India Perimeter Security Market across demand-side and supply-side entities. On the demand side, entities include defense and border security agencies, airport and port authorities, power and utility operators, oil & gas companies, rail and metro authorities, industrial park developers, logistics and warehouse operators, mining companies, data center developers, IT campuses, and large institutional facilities. Demand is further segmented by site type (greenfield vs retrofit), threat profile (low, medium, high security), perimeter length and complexity, and procurement model (direct purchase, EPC-led delivery, public tender, managed security contracts).
On the supply side, the ecosystem includes physical fencing and barrier manufacturers, electronic intrusion detection solution providers, surveillance and thermal imaging OEMs, software and command-and-control platform providers, system integrators, EPC contractors, civil contractors, network and power infrastructure partners, and operations & maintenance service providers. From this mapped ecosystem, we shortlist 8–12 key solution providers and system integrators based on project execution capability, compliance with government and defense specifications, technology portfolio, geographic reach, and reference installations across infrastructure and industrial segments. This step establishes how value is created and captured across design, supply, installation, integration, monitoring, and lifecycle maintenance.
Step 2: Desk Research
An exhaustive desk research process is undertaken to analyze the India perimeter security market structure, demand drivers, and segment behavior. This includes reviewing national and state-level infrastructure programs, border and homeland security initiatives, airport and port expansion plans, industrial corridor development, logistics park pipelines, and smart city projects. We assess buyer preferences around deterrence strength, detection accuracy, response time, manpower reduction, and total cost of ownership.
Company-level analysis includes review of product portfolios, technology partnerships, manufacturing or assembly presence, system integration capabilities, AMC models, and typical deployment scenarios. We also examine regulatory and standards dynamics shaping demand, including security guidelines for critical infrastructure, public procurement norms, cybersecurity considerations, and localization requirements. The outcome of this stage is a robust industry foundation that defines segmentation logic and establishes assumptions required for market sizing and long-term outlook development.
Step 3: Primary Research
We conduct structured interviews with perimeter security solution providers, fencing manufacturers, electronic security OEMs, system integrators, EPC contractors, infrastructure developers, facility security heads, and government-linked buyers. The objectives are threefold:
(a) validate assumptions around demand concentration, procurement models, and technology adoption trends,
(b) authenticate segment splits by component type, end-use sector, and deployment model, and
(c) gather qualitative insights on pricing structures, installation challenges, false alarm rates, maintenance requirements, and buyer expectations around reliability and service support.
A bottom-to-top approach is applied by estimating project counts, average perimeter lengths, and solution cost by end-use segment and region, which are aggregated to develop the overall market view. In selected cases, disguised buyer-style interactions are conducted with integrators and suppliers to validate field-level realities such as tender qualification criteria, execution timelines, integration challenges, and common gaps between specification and on-ground performance.
Step 4: Sanity Check
The final stage integrates bottom-to-top and top-to-down approaches to cross-validate the market view, segmentation splits, and forecast assumptions. Demand estimates are reconciled with macro indicators such as infrastructure capex trends, industrial output growth, logistics footprint expansion, and public-sector security budgets. Assumptions around technology penetration, manpower substitution, and retrofit acceleration are stress-tested to understand their impact on adoption rates. Sensitivity analysis is conducted across variables including infrastructure rollout pace, security threat perception, budget allocations, and system integration maturity. Market models are refined until alignment is achieved between supplier capacity, integrator throughput, and buyer project pipelines, ensuring internal consistency and robust directional forecasting through 2035.
See What's Inside the Report
Get a preview of key findings, methodology and report coverage
Frequently Asked Questions
The India perimeter security market holds strong long-term potential, supported by sustained investment in critical infrastructure, border management, industrial expansion, logistics development, and urban security modernization. Increasing emphasis on asset protection, threat detection, and reduction of manual guarding is driving adoption of integrated and technology-enabled perimeter security solutions. As infrastructure footprints expand and security requirements become more stringent, perimeter security will remain a foundational investment area through 2035.
The market features a mix of domestic physical security manufacturers, electronic security solution providers, large system integrators, and global technology OEMs operating through Indian partners. Competition is shaped by compliance capability, system integration expertise, execution track record, service coverage, and ability to participate in public-sector tenders. System integrators play a central role in bundling physical, electronic, and software layers into end-to-end solutions.
Key growth drivers include expansion of airports, ports, rail and metro networks, industrial corridors, logistics parks, and utilities, along with heightened focus on national security and critical infrastructure protection. Additional momentum comes from rising adoption of sensor-based detection, video analytics, centralized command platforms, and retrofit-driven upgrades of aging facilities. The need to improve detection accuracy while controlling operating costs continues to reinforce market growth.
Challenges include high upfront system costs, fragmented implementation across multiple vendors, integration complexity, and maintenance constraints in harsh operating environments. Public procurement processes can extend project timelines, while limited availability of skilled integration and maintenance personnel affects long-term system performance. In certain segments, budget sensitivity and lack of standardized specifications also slow adoption of advanced solutions.
License Options
PDF + Excel
Complete report package
$4,000
Excel Only
Data and analytics
$2,500
Custom Sections
Starts from $100
$0