India Rare Earth Material Market Outlook to 2030
By Element/Group, By Product Form, By Processing Stage, By Application, and By Region
Report Overview
Report Code
TDR0245
Coverage
Asia
Published
August 2025
Pages
80
Flexible Purchase Options
Select and purchase only the chapters you need for your strategic decisions
On This Page
Report Overview
The report titled “India Rare Earth Material Market Outlook to 2030 – By Element/Group, By Product Form, By Processing Stage, By Application, and By Region” provides a comprehensive analysis of India’s rare earth industry. The report covers the overview and genesis of the sector, overall market size in terms of revenue, detailed segmentation, trends and developments, regulatory and licensing landscape (DAE/AERB/AMCR), end-use profiling across priority industries, issues and challenges, and a competitive landscape including competition scenario, cross-comparison parameters, opportunities and bottlenecks, and company profiles of major domestic and global players active in India.
Report Coverage
Verified Market Sizing
Multi-layer forecasting with historical data and 5–10 year outlook
Deep-Dive Segmentation
Cross-sectional analysis by product type, end user, application and region
Competitive Benchmarking & Positioning
Market share, operating model, pricing and competition matrices
Actionable Insights & Risk Assessment
High-growth white spaces, underserved segments, technology disruptions and demand inflection points
Review Methodology & Data Structure
Preview report structure, data sources and research framework
Executive Summary
The report titled “India Rare Earth Material Market Outlook to 2030 – By Element/Group, By Product Form, By Processing Stage, By Application, and By Region” provides a comprehensive analysis of India’s rare earth industry. The report covers the overview and genesis of the sector, overall market size in terms of revenue, detailed segmentation, trends and developments, regulatory and licensing landscape (DAE/AERB/AMCR), end-use profiling across priority industries, issues and challenges, and a competitive landscape including competition scenario, cross-comparison parameters, opportunities and bottlenecks, and company profiles of major domestic and global players active in India. The study concludes with future market projections based on oxide/magnet volumes, product forms, applications, regions, cause-and-effect relationships across the value chain, and success case studies highlighting major opportunities and cautions for investors and operators.
India Rare Earth Material Market Overview and Size
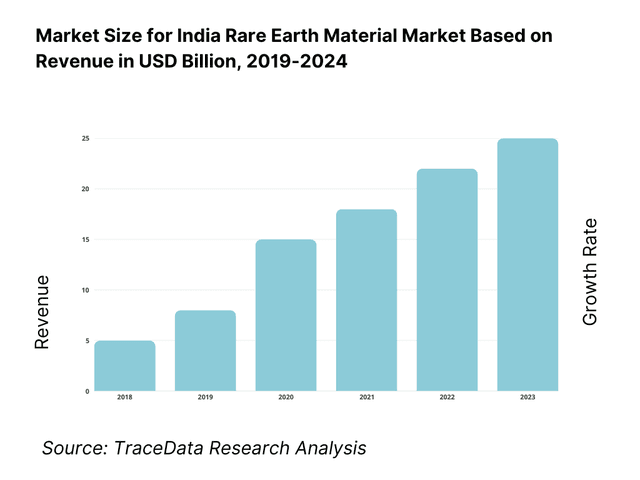
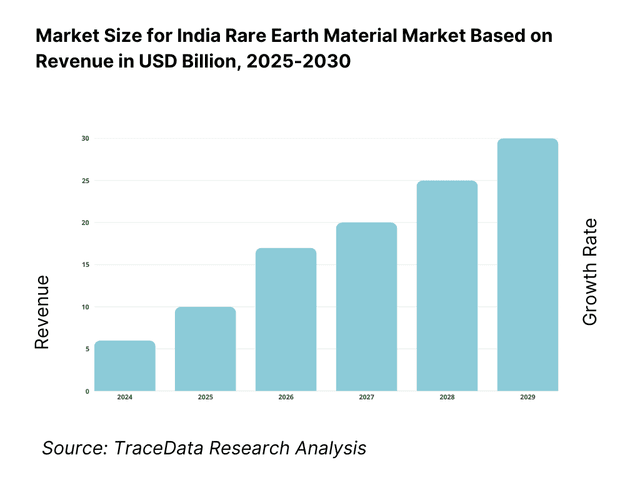
The India Rare Earth Elements market is valued at USD 8.32 billion, based on the five‑year historical data culminating in USD 9.03 billion, reflecting recent demand traction. This market value stems from robust consumption across electronics, electric vehicle motor magnets, renewable energy turbines, and defense-grade alloys. It is underpinned by government‑driven magnet production incentives and rising domestic demand for clean‑technology applications.
Kerala, Odisha, and Visakhapatnam anchor India's rare earth ecosystem due to their integrated resource-to‑processing capabilities. Kerala hosts established monazite refining infrastructure (Aluva), Odisha commands rich beach‑sand monazite deposits, and Visakhapatnam is emerging as a hub for domestic magnet production—each bolstered by state alignment and support through entities like IREL and allied development bodies.
What Factors are Leading to the Growth of the India Rare Earth Material Market:
EV and e-mobility demand creating magnet pull-through: India’s EV adoption is directly expanding demand for NdFeB traction-motor magnets. Government data records 1,950,490 EV registrations on VAHAN for the calendar year and 26,207,453 total vehicle registrations—establishing a large addressable base for REE-intensive motors across two-, three- and four-wheelers. Defence-linked mobility and public transport electrification add to the pull, with a capital acquisition outlay of ₹1.72 lakh crore inside an overall defence allocation of ₹6.22 lakh crore that prioritises domestic sourcing of high-performance materials. Together, these numbers signal sustained magnet intensity in automotive and defence equipment, underpinning the rare earth materials value chain from oxide separation to finished magnets.
Wind power pipeline reinforcing generator-grade magnet demand: Wind turbine fleets require high-coercivity REE magnets for direct-drive and hybrid generators. The renewable dashboard shows recent wind additions of 2,275.55 MW and 3,253.38 MW in successive years, taking cumulative wind capacity to 52,140.10 MW. Even partial substitution with ferrites cannot displace NdPr-Dy demand for compact, high-torque designs that OEMs prefer for lower maintenance in India’s coastal and arid wind corridors. As auctions scale and grid upgrades proceed, the physical additions (in MW, not modelled projections) translate into repeat requirements for magnets and auxiliary REE uses (sensors, pitch/ yaw systems), locking-in upstream offtake for oxide, metal and alloy suppliers.
Electronics manufacturing scale sustaining REE use in polishing, sensors and micro-motors: Electronics production deepens domestic consumption of ceria-based polishing powders, specialty glass additives and miniature motors using REE magnets. Official data notes mobile-phone manufacturing value at ₹4,22,000 crore in the last financial year, with exports crossing ₹1,29,000 crore, and more than 300 manufacturing units producing 325–330 million phones annually. This hard, audited output base—alongside sanctioned semiconductor/OSAT projects like ₹91,526 crore fab and ₹27,120 crore OSAT—anchors recurring REE demand in polishing, sensors, haptics and speakers, supporting steady off-take for cerium/lanthanum as well as NdPr-rich magnet streams.
Which Industry Challenges Have Impacted the Growth of the India Rare Earth Material Market:
Import concentration in permanent magnets and magnet inputs: Official trade data tabled in Parliament shows heavy reliance on imports for magnet categories. Under HS 85051190, India imported US$ 124.77 million (world) with US$ 90.80 million sourced from China in value, and 1,91,65,153 kg (world) versus 1,70,17,844 kg (China) in quantity. For HS 85051900, the split is US$ 70.11 million (world) versus US$ 44.14 million (China), and 2,42,26,205 kg (world) versus 2,12,59,867 kg (China). Such concentration exposes Indian buyers to logistics, policy and FX shocks, constraining predictable sourcing for EV, wind and electronics OEMs.
Radiation, tailings and occupational safety compliance costs: Processing monazite/xenotime requires strict dose management, tailings control and monitoring. AERB codifies occupational whole-body dose limits at 20 mSv/year averaged over five years and 30 mSv in any single year, with a public exposure cap of 1 mSv/year. Engineering to these numeric thresholds—plus area classification, shielding and effluent stewardship—adds real operating steps (dosimetry, PPE, waste handling, stack & liquid discharges) and timelines for licensing. Meeting these quantified limits across multi-stage SX circuits increases capex/opex for separators, particularly where beach-sand monazite and red-mud residues co-exist with thorium/uranium traces.
Exploration and conversion of resources into shovel-ready capacity: While India’s geological base is promising, operational conversion is paced by exploration and permitting. The Geological Survey of India took up 195 critical-mineral exploration projects in FY 2024-25, rising to 227 in FY 2025-26. AMD reporting identifies hard-rock REE resources such as 1,120,200 t REO in a single deposit class, and beach/placer monazite inventories noted in recent government communications. The step-up in project count is positive but also reflects pipeline depth still in evaluation, implying a staggered ramp from reconnaissance to production leases before separation and magnet capacities can reliably feed downstream clusters.
What are the Regulations and Initiatives which have Governed the Market:
Atomic Minerals Concession Rules (AMCR) thresholds and lease conditions: REE-bearing monazite in beach-sand minerals is regulated under atomic thresholds. AMCR specifies monazite at 0.75% in Total Heavy Minerals as a trigger, with associated clauses for 60 ppm U₃O₈ and 250 ppm ThO₂ in specified ores/placer contexts. Where grades are equal to or above thresholds, mining leases progress only under Central prescriptions, reinforcing federal oversight of atomic-mineral value chains that encompass monazite and REE recovery. These numeric cut-offs inform reconnaissance, beneficiation plans and environmental submissions, shaping deposit selection and private participation structures.
Offshore Areas Mineral regime—uniform lease periods and operating rights: India has modernised offshore mineral rules to create auctionable offshore blocks with clear tenure. The government notified that the amended regime provides a uniform 50-year lease period, composite licences, and area limits for operating rights; related rule-sets (Operating Right, Auction, Trust and Conservation rules) provide procedures for execution and oversight. Earlier texts capped production leases at 30 years; the new tenure improves bankability for marine placers and related REE-bearing prospects, aligning financing horizons with complex separation plant paybacks and mid-life debottlenecking.
AERB radiation dose limits embedded in licensing and operations: Licensing for monazite processing and REE separation integrates numeric radiation dose constraints from AERB. Occupational effective dose is limited to 20 mSv/year averaged over 5 years, with an upper bound of 30 mSv in any single year; public exposure is capped at 1 mSv/year. These quantified limits govern plant design (containment, shielding), monitoring (TLD/area), and waste systems (tailings, effluents), and they define compliance gates during commissioning and renewal, directly influencing timelines and costed risk in project financial closures.
India Rare Earth Material Market Segmentation
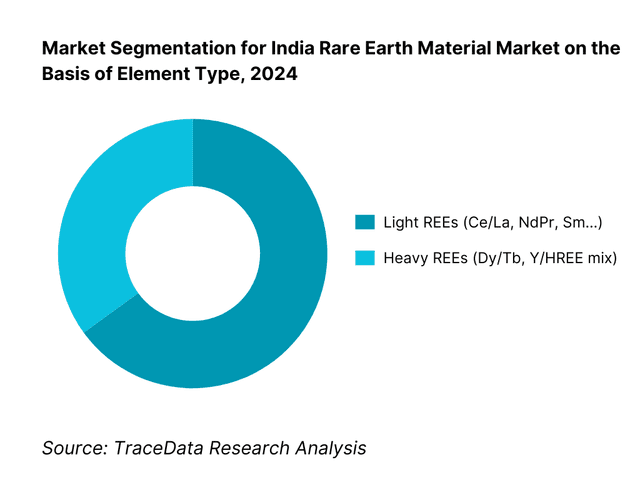
By Element Type: Light REEs dominate, owing to India’s abundance of monazite sand rich in cerium and lanthanum along with integrated refining capacities around Neodymium–Praseodymium extraction, key for domestic magnet manufacturing. Processing facilities in Kerala and Odisha are optimized for LREE recovery, supplying strong in-country demand for motor and turbine magnets. Heavy REEs lag due to limited domestic reserves and reliance on imports for ultrahigh-performance magnet alloys used in aerospace/defense applications.
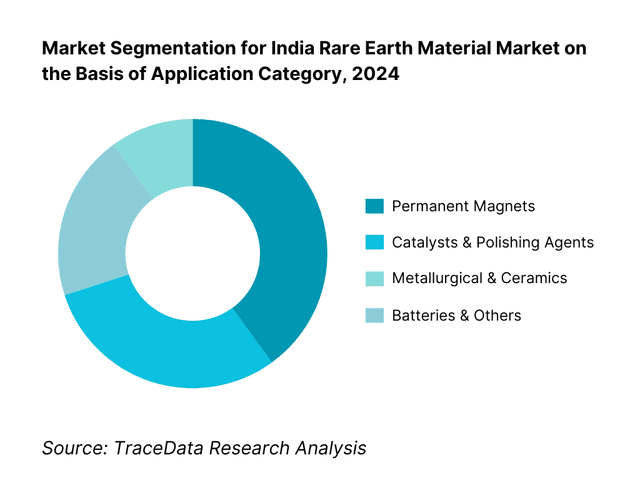
By Application Category: Permanent Magnets lead, courtesy of surging demand from EV traction motor manufacturing, wind turbine installations, and industrial servo systems. Visakhapatnam’s nascent magnet hub and strategic production schemes are ramping domestic supply, reducing import dependency. Catalysts and polishing agents hold significant share due to industrial polishing and auto-catalytic converter use. Metallurgical additives and ceramics follow as mid-tier segments with growing demand in alloys and refractory uses.
Competitive Landscape in India Rare Earth Material Market
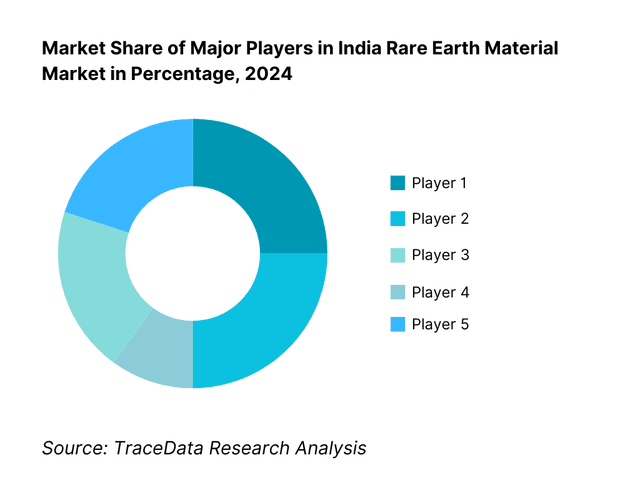
India's rare earth market is shaped by a mix of state-owned, quasi-governmental, and private-sector players. The ecosystem remains relatively consolidated, with key players steering the integrated value chain from mining through separation to magnet production. This consolidation reinforces the dominance of these players in shaping domestic supply dynamics and policy-influenced development.
Name | Founding Year | Original Headquarters |
IREL (India) Limited | 1950 | Mumbai, India |
Toyotsu Rare Earths India (TREI) | 2012 | Andhra Pradesh, India |
GMDC (Ambadungar REE Project) | 1963 | Ahmedabad, India |
Vedanta Aluminium (REE recovery) | 2001 | Odisha, India |
NALCO (REE initiatives) | 1981 | Bhubaneswar, India |
Midwest Advanced Materials | 2010 | Hyderabad, India |
Sona Comstar (Sona BLW) | 1995 | Gurugram, India |
Uno Minda | 1958 | Gurugram, India |
Mahindra & Mahindra | 1945 | Mumbai, India |
Permanent Magnets Limited | 1960 | Mumbai, India |
Lynas Rare Earths | 1983 | Perth, Australia |
MP Materials | 2017 | Las Vegas, USA |
Iluka Resources | 1954 | Perth, Australia |
Neo Performance Materials | 2016 | Toronto, Canada |
China Northern Rare Earth High-Tech Co. | 1997 | Baotou, China |
Some of the Recent Competitor Trends and Key Information About Competitors Include:
IREL (India) Limited: As the flagship public sector undertaking in rare earths, IREL expanded its refining capacity at the Aluva and Odisha plants in 2024, boosting Neodymium–Praseodymium (NdPr) oxide output to meet rising demand from EV motor manufacturers and defense-grade applications. The company is also piloting magnet production as part of India’s strategic indigenization drive.
Toyotsu Rare Earths India (TREI): Operating as a joint venture between Toyota Tsusho and Indian partners, TREI strengthened its separation technologies in 2024, focusing on solvent extraction of Light Rare Earth Elements (LREEs). The company aligned its output with India’s growing automotive and electronics demand, while maintaining strong technical partnerships with Japanese magnet producers.
GMDC (Ambadungar REE Project): Gujarat Mineral Development Corporation advanced its Ambadungar carbonatite project in 2024, positioning it as India’s first large-scale inland REE mine. GMDC signed early-stage technology MoUs with global separation specialists to fast-track commercialization and reduce reliance on imported oxides.
Vedanta Aluminium: Known for its integrated bauxite-alumina operations, Vedanta ramped up red-mud recovery pilots in 2024 for scandium and associated REEs. This initiative leverages existing alumina refinery by-products and aligns with circular economy goals, while also creating potential new revenue streams from high-value alloys.
Midwest Advanced Materials: As an emerging private manufacturer, Midwest established India’s first NdFeB magnet production line in Hyderabad in 2024. The company reported rising off-take agreements with Tier-1 auto suppliers, signaling India’s gradual move towards backward integration in EV motor magnet supply chains.
What Lies Ahead for India Rare Earth Material Market?
The India rare earth material market is set to expand steadily by 2030, supported by rising demand from electric mobility, renewable energy, and electronics manufacturing. Growth will be driven by government-backed initiatives for indigenizing magnet production, development of separation and recycling capacity, and strong alignment with defense and strategic sectors. With India already progressing in mineral exploration and magnet technology adoption, the market will increasingly transform into a globally competitive hub in the REE value chain.
Expansion of Magnet Manufacturing Hubs: India is expected to see large-scale development of magnet manufacturing clusters in regions like Visakhapatnam, Gujarat, and Tamil Nadu. These hubs will cater to demand from EV makers, wind energy developers, and electronics firms while reducing reliance on imports.
Focus on Strategic Resource Security: With geopolitical supply risks around China dominating REE trade, India will emphasize domestic separation capacity and overseas mining partnerships. Strategic reserves and joint ventures through entities like KABIL will be critical in ensuring long-term supply security.
Growth of Recycling and Circular Economy Models: Magnet-to-magnet recycling and REE recovery from red mud and industrial residues are likely to gain traction. This will not only provide additional supply channels but also align with environmental compliance and sustainable industry policies.
Integration of Technology and R&D: Greater emphasis will be placed on R&D in high-performance magnets, solvent extraction efficiency, and alloying techniques. Collaboration with international technology providers and indigenous research bodies will enable India to build advanced processing and application capabilities.
India Rare Earth Material Market Segmentation
By Element / Group
Light REEs (LREE)
Heavy REEs (HREE)
By Product Form
Oxides
Carbonates / Concentrates:
Metals & Alloys
Finished Functional Materials
By Processing Stage
Upstream
Midstream
Downstream
Secondary
By Application / End-Use
Mobility & Energy
Electronics & Electricals
Industrial & Automation
Defense & Aerospace
Glass/Ceramics/Chemicals
By Resource / Deposit Type
Beach Placer Monazite & Associated THMs
Hard-Rock / Alkaline–Carbonatite Complexes
Industrial Residues / Secondary Sources
By Region (India) (In Value %)
Coastal Mineral Belts
Western & Central Clusters
Northern & North-East Prospects
Manufacturing Hubs
Players Mentioned in the Report:
IREL (India) Limited
Toyotsu Rare Earths India Pvt. Ltd. (TREI)
GMDC (Ambadungar REE Project)
Vedanta Aluminium (red‑mud REE recovery)
NALCO (red‑mud/REE initiatives)
Midwest Advanced Materials (magnet manufacturing)
Sona Comstar (magnet production plans)
Uno Minda (magnet potential)
Mahindra & Mahindra (OEM magnet integration)
Permanent Magnets Limited
Lynas Rare Earths
MP Materials
Iluka Resources
Neo Performance Materials
China Northern Rare Earth / Shenghe Resources
Key Target Audience
Procurement leads at EV OEMs and Motor Manufacturers
Strategic Planning Heads at Wind Turbine OEMs
Metals & Materials R&D Directors in Defense PSUs
Investments and Venture Capitalist Firms
State Mineral Development Authorities (e.g., GMDC, Kerala Minerals)
Central Government Regulatory Bodies
Infrastructure Funding Agencies (e.g., Power Finance Corporation)
Strategic Commodity Fund Managers / Sovereign Wealth Funds
Time Period:
Historical Period: 2019-2024
Base Year: 2025
- Forecast Period: 2025-2030
Explore Flexible Purchase Options or Have Limited Budget?
Pay only for relevant chapters • Customizable report sections
Table of Contents
Choose individual sections to purchase. Mix and match as you like.
4.1. Mining & Beneficiation [Beach Sands, Carbonatites, Red Mud Recovery]
4.2. Separation & Refining [Solvent Extraction, Ion Exchange, SX Circuit Efficiency]
4.3. Metals & Alloys [Reduction, Electrolytic Processing, Alloy Production]
4.4. Magnet Manufacturing [Sintered NdFeB, Bonded Magnets, SmCo Pathways]
4.5. Recycling & Secondary Sources [Magnet-to-Magnet Recycling, Red Mud/Phosphogypsum]
4.6. Value Capture & Margins at Each Stage
5.1. Public Sector vs. Private Sector Participation [IREL vs. Global Entrants]
5.2. Investment Models [JV, Technology Transfer, Licensing, PPP Initiatives]
5.3. Comparative Analysis of Processing Flow [Domestic vs. International Supply Chains]
5.4. Budget Allocation of End-Use Industries [EV, Wind, Defense, Electronics]
6.1. Resource Potential by Deposit Type
6.2. Import Substitution & Strategic Security Needs
6.3. Export Potential & Global Trade Dependencies
6.4. Opportunity Mapping by Application
7.1. Domestic REE Supply vs. Consumption in Magnets & Catalysts
7.2. Import Dependency on Separated Oxides & Magnets
7.3. Strategic Reserve Needs
7.4. Projected Shortfalls & Mitigation Pathways
8.1. Revenues (In INR Cr / USD Bn)
8.2. Installed Separation & Magnet Capacity (tpa)
8.3. Import-“Export Value (HS 2846, HS 8505)
9.1. By Market Structure (Mining, Separation, Magnet Manufacturing)
9.2. By Element Type (NdPr, Dy/Tb, Ce/La, Sm/Gd, Y/HREE Mix)
9.3. By Industry Verticals (EV, Wind, Electronics, Defense, Glass/Ceramics/Polishing)
9.3.1. EV Sector Breakdown [Magnet Intensity per EV, Projected Demand]
9.3.2. Wind Power Breakdown [NdFeB Loadings per MW, Offshore vs. Onshore]
9.3.3. Defense & Aerospace Breakdown [Sonar, Avionics, Missiles, Radars]
9.3.4. Electronics Breakdown [Smartphones, Laptops, HDDs, IoT Devices]
9.4. By Company Size (PSUs, Large Industrial Houses, SMEs)
9.5. By Processing Stage (Mining, Separation, Metallization, Magnets)
9.6. By Mode of Supply (Domestic Production vs. Imports)
9.7. By Program Type (Strategic vs. Commercial Projects)
9.8. By Region (Odisha, Kerala, Tamil Nadu, Andhra Pradesh, Gujarat, Rajasthan, North-East)
10.1. End-User Landscape & Cohort Analysis [OEMs, Tier-1s, Defense, Electronics]
10.2. Procurement & Decision-Making Process in End-Use Industries
10.3. ROI Analysis of Localization [EV OEMs, Wind Turbines]
10.4. Gap Analysis Framework
11.1. Trends & Developments [Magnet Localization, Recycling, JV Formation]
11.2. Growth Drivers [EV Push, Wind Installations, Defense Indigenization, Import Substitution]
11.3. SWOT Analysis [Strength, Weakness, Opportunities, Threats]
11.4. Issues & Challenges [Policy Restrictions, Price Volatility, Technology Access]
11.5. Government Regulations [Atomic Minerals Concession Rules, Monazite Threshold, AERB Norms]
12.1. Market Size & Future Potential of NdFeB/SmCo Magnets in India
12.2. Business Model & Revenue Streams of Magnet Producers
12.3. Technology Landscape [Sintered vs. Bonded Magnets, Recycling Pathways]
12.4. Cross-Comparison of Leading Magnet Companies [Company Overview, Capacity, Revenues, Technology Partners, Client Base, Pricing, Strategic Tie-Ups, Recent Developments]
15.1. Market Share of Key Players [Basis Revenues & Capacity]
15.2. Benchmark of 15 Competitors (IREL, TREI, GMDC, Vedanta, NALCO, Midwest, Sona Comstar, Uno Minda, Mahindra, Permanent Magnets Ltd, Lynas, MP Materials, Iluka Resources, Neo Performance, China Northern Rare Earth/Shenghe)
15.3. Operating Model Analysis Framework
15.4. Gartner Magic Quadrant (Adapted for REE Value Chain Players)
15.5. Bowmans Strategic Clock for Competitive Advantage
16.1. Revenues (Projected)
16.2. Capacity Additions (Separation Plants, Magnet Units)
17.1. By Market Structure (Mining, Separation, Magnet Manufacturing)
17.2. By Element Type (NdPr, Dy/Tb, Ce/La, Sm/Gd, Y/HREE Mix)
17.3. By Industry Verticals (EV, Wind, Electronics, Defense, Glass/Ceramics/Polishing)
17.3.1. EV Sector Projections
17.3.2. Wind Power Projections
17.3.3. Defense & Aerospace Projections
17.3.4. Electronics Projections
17.4. By Company Size (PSUs, Large Enterprises, SMEs)
17.5. By Processing Stage (Mining †’ Magnetization Chain)
17.6. By Mode of Supply (Domestic vs. Imports)
17.7. By Program Type (Strategic vs. Commercial)
17.8. By Region (Odisha, Kerala, Tamil Nadu, Andhra Pradesh, Gujarat, Rajasthan, North-East)
Discuss a Customized Research Scope
Custom research scope • Tailored insights • Industry expertise
Research Methodology
Step 1: Ecosystem Creation
Map the full India Rare Earth Material Market ecosystem and identify demand-side entities—EV OEMs (two/three/four-wheelers), traction-motor and servo manufacturers, wind turbine OEMs and generator suppliers, electronics/EMS & glass-polishing clusters, and defense/aerospace PSUs—and supply-side entities—beach-sand miners, carbonatite developers, separators (SX/IX), metallization/alloying units, NdFeB/SmCo magnet makers, recyclers, logistics/ports, test labs, and regulators (DAE/AERB/AMD/MoM). From this map, shortlist 5–6 leading producers/separators/magnet makers on objective signals: installed REO/NdPr capacity (tpa), plant locations and AERB clearances, feedstock security (lease/MoU/long-term contracts), downstream integration (oxide→metal→magnet), export linkages, customer offtake depth (EV/wind/defense), and recent commissioning or debottlenecking events.
Step 2: Desk Research
Run an exhaustive secondary review using government releases, parliamentary answers, and statutory filings to build a foundational market book. Aggregate: (a) industry-level variables—REE trade flows by HS 2846/8505 (value/quantity, monthly), domestic capacities by stage (mining → separation → metal/alloy → magnets), plant commissioning timelines, equipment footprints (SX trains, furnaces, strip-casting, HDDR), yield norms and scrap loops; (b) demand-side variables—EV registrations (unit counts), wind additions (MW), electronics output (units/value), defense capex line-items relevant to indigenization; (c) company-level variables—asset lists, stage coverage, customers, revenue mix proxies from schedules/notes, offtake/MoU announcements, site EHS/radiation stewardship artefacts. Normalize units (t, kg, MW, units), harmonize geographies (state/district/port), and build cross-walks for oxide→metal→magnet conversion with loss factors. Output is a reconciled dataset and a sources log with document IDs and retrieval dates.
Step 3: Primary Research
Conduct in-depth interviews with C-suite/plant heads at separators, metallizers, and magnet makers; procurement heads at EV/wind/electronics OEMs; program managers at defense PSUs; state mineral PSUs; and regulatory engineers (licensing/compliance). Objectives: validate capacity and utilization narratives, confirm material balances (throughput, yields, downtime), cross-check import dependencies and lead times, and capture commercial terms (contract tenor, indexation, penalties, logistics nodes). Use a bottom-to-top approach to attribute revenues/throughputs by player and aggregate to market totals; complement with mystery-buyer style validations (request for quotation, sample specs) to corroborate pricing basis, MOQ, magnet grades (N-ratings, Dy/Tb content), and service SLAs. Where feasible, schedule site walks to review SX trains, filtration, waste/tailings handling, dosimetry protocols, and QA labs; collect photographic and batch-sheet evidence with consent.
Step 4: Sanity Check
Run top-down vs bottom-up triangulation. Top-down: translate EV unit counts, wind MW additions, electronics output, and defense program deliveries into magnet/oxide needs using verified intensity coefficients (kg NdFeB per EV motor, kg/MW wind generator, ceria kg per glass-polish line). Bottom-up: sum domestic stage-wise capacities and realized throughputs, adjust for yields, scrap recovery, and inventory swings. Reconcile both with observed trade (HS 2846/8505 value & kg) and known commissioning dates to ensure flows balance within tolerance bands. Stress-test with scenario levers (import disruption, Dy/Tb availability, acid/energy constraints). Produce: a) reconciled market model with versioned assumptions, b) an assumptions register (with source citations), c) a replicability pack (calculation chains, unit maps), and d) a findings memo flagging data gaps and priority follow-ups for the next research sprint.
See What's Inside the Report
Get a preview of key findings, methodology and report coverage
Frequently Asked Questions
The India Rare Earth Material Market has strong multi-year potential as the country localizes critical inputs for electric mobility, wind power, electronics, and defense. Momentum is anchored by resource endowments (beach-sand monazite and carbonatite deposits), expanding separation and metallization capacity, and an emerging domestic magnet ecosystem. Strategic initiatives—spanning import substitution, recycling, and overseas offtake partnerships—further bolster the outlook. Together, these factors position India to move up the value chain from oxides to alloys and high-performance NdFeB/SmCo magnets, creating durable demand visibility and investment appetite across the REE lifecycle.
Key players include IREL (India) Limited; Toyotsu Rare Earths India (TREI); Gujarat Mineral Development Corporation (Ambadungar project); Vedanta (red-mud recovery initiatives); NALCO; Midwest Advanced Materials (NdFeB magnets); Permanent Magnets Limited; Sona BLW (Sona Comstar), Uno Minda and Mahindra (downstream magnet/OEM integration initiatives); plus global suppliers active in India’s supply chain such as Lynas Rare Earths, MP Materials, Iluka Resources, Neo Performance Materials, and China Northern Rare Earth/Shenghe Resources. These companies shape mining, separation, metals/alloys, and magnet manufacturing, underpinned by technology partnerships and strategic offtakes.
Growth is driven by fast-rising demand for traction-motor and generator magnets in EVs and wind turbines; deepening electronics manufacturing (smartphones, wearables, appliances) that consumes ceria for polishing and NdPr for micro-motors/sensors; and defense/space indigenization requiring high-spec alloys and magnets. Policy support for critical minerals, magnet manufacturing clusters, and recycling (magnet-to-magnet, red-mud recovery) accelerates domestic capacity build-out. Parallel exploration and overseas asset tie-ups enhance feedstock security, while OEM backward integration and long-term offtake contracts improve bankability across oxide-to-magnet value chains.
Challenges include import concentration in separated oxides and finished magnets, exposing manufacturers to supply disruptions and policy shocks; regulatory complexity and licensing for atomic-mineral-bearing feedstocks, which lengthen timelines for mining and separation projects; and environmental/radiological compliance requirements that raise capex/opex for solvent-extraction circuits and tailings handling. In addition, access to advanced magnet IP/process know-how (sintering, grain-boundary diffusion, Dy/Tb optimization) and consistent downstream demand aggregation remain hurdles for rapid scale-up from pilot capacities to globally competitive, integrated production.
License Options
PDF + Excel
Complete report package
$4,000
Excel Only
Data and analytics
$2,500
Custom Sections
Starts from $100
$0