Indonesia Alcoholic Drinks Market Outlook to 2029
By Market Structure, By Product Types (Beer, Wine, Spirits, Others), By Consumer Demographics, By Distribution Channels (On-trade, Off-trade), and By Region
Report Overview
Report Code
TDR0059
Coverage
Asia
Published
November 2024
Pages
80-100
Flexible Purchase Options
Select and purchase only the chapters you need for your strategic decisions
On This Page
Report Overview
The report titled “Indonesia Alcoholic Drinks Market Outlook to 2029 - By Market Structure, By Product Types (Beer, Wine, Spirits, Others), By Consumer Demographics, By Distribution Channels (On-trade, Off-trade), and By Region.” provides a comprehensive analysis of the alcoholic drinks market in Indonesia. The report covers an overview and genesis of the industry, overall market size in terms of revenue, market segmentation; trends and developments, regulatory landscape, customer profiling, issues and challenges, and competitive landscape.
Report Coverage
Verified Market Sizing
Multi-layer forecasting with historical data and 5–10 year outlook
Deep-Dive Segmentation
Cross-sectional analysis by product type, end user, application and region
Competitive Benchmarking & Positioning
Market share, operating model, pricing and competition matrices
Actionable Insights & Risk Assessment
High-growth white spaces, underserved segments, technology disruptions and demand inflection points
Review Methodology & Data Structure
Preview report structure, data sources and research framework
Executive Summary
The report titled “Indonesia Alcoholic Drinks Market Outlook to 2029 - By Market Structure, By Product Types (Beer, Wine, Spirits, Others), By Consumer Demographics, By Distribution Channels (On-trade, Off-trade), and By Region.” provides a comprehensive analysis of the alcoholic drinks market in Indonesia. The report covers an overview and genesis of the industry, overall market size in terms of revenue, market segmentation; trends and developments, regulatory landscape, customer profiling, issues and challenges, and competitive landscape. The report concludes with future market projections based on sales revenue, by market, product types, region, cause and effect relationship, and success case studies highlighting major opportunities and cautions.
Indonesia Alcoholic Drinks Market Overview and Size
The Indonesia alcoholic drinks market reached a valuation of IDR 80 Trillion in 2023, driven by a growing urban population, changing consumer preferences, and a gradual shift towards higher alcohol consumption due to lifestyle changes. The market is characterized by key players such as Multi Bintang Indonesia, Heineken, PT. Dima Indonesia, and PT. Delta Djakarta. These companies are recognized for their strong distribution networks, premium product offerings, and innovative marketing strategies.
In 2023, PT. Multi Bintang Indonesia launched a new range of craft beer targeting millennial consumers, which reflects the increasing interest in premium alcoholic beverages in the urban centers of Indonesia such as Jakarta, Surabaya, and Bali.
Market Size for Indonesia Alcoholic Beverage Industry on the Basis of Revenue in USD Billion, 2018-2024
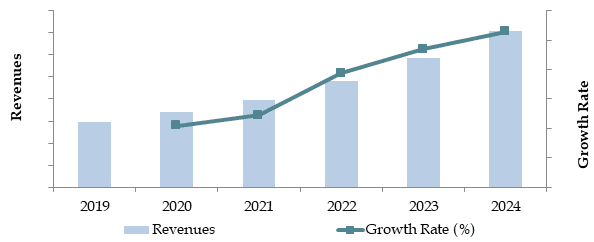
Source: TraceData Research Analysis
Factors Leading to the Growth of Indonesia Alcoholic Drinks Market
Changing Lifestyles: The rise of urbanization and changing social norms have played a significant role in the growing acceptance of alcoholic beverages in Indonesia. In 2023, beer accounted for approximately 60% of total alcohol sales, driven by its affordability and social acceptance. The millennial population, in particular, is showing a preference for alcoholic drinks at social gatherings and leisure activities.
Rising Disposable Income: The increase in disposable income, particularly among middle-class consumers, has led to a greater demand for premium alcoholic beverages, including imported spirits and wines. In the past five years, the middle-income group in Indonesia has grown by 10%, which has expanded the market for higher-end products.
Tourism and Hospitality Sector: The robust tourism sector in Bali, Jakarta, and other popular destinations has contributed significantly to alcohol consumption, especially in bars, restaurants, and hotels. In 2023, the on-trade sales channel accounted for nearly 45% of total alcoholic drink sales in Indonesia.
Which Industry Challenges Have Impacted the Growth for Indonesia Alcoholic Drinks Market
Regulatory Restrictions: Indonesia has strict regulations regarding the sale and distribution of alcoholic beverages, particularly in regions with a predominantly Muslim population. Government policies, such as limiting the hours of alcohol sales, banning sales in certain areas, and high taxes, have significantly constrained market growth. In 2023, approximately 30% of potential alcohol sales were impacted by these regulatory hurdles, especially in rural areas.
Cultural and Religious Sensitivity: Alcohol consumption is often viewed negatively in conservative parts of Indonesia due to religious beliefs. This cultural aversion limits demand in certain regions, particularly outside urban areas like Jakarta and Bali. Surveys conducted in 2023 revealed that nearly 40% of respondents abstained from consuming alcohol for religious reasons, which affects the overall market expansion.
High Import Duties and Taxes: The Indonesian government imposes high import duties and excise taxes on alcoholic beverages, making imported products significantly more expensive. This limits the accessibility of premium international brands to price-sensitive consumers. In 2023, import duties accounted for as much as 150% of the retail price of certain products, deterring many middle-class consumers from purchasing imported alcohol.
What are the Regulations and Initiatives which have Governed the Indonesia Alcoholic Drinks Market:
Alcohol Sales Restrictions: The Indonesian government enforces strict regulations on the sale of alcoholic beverages, particularly in relation to where and when alcohol can be sold. Sales are often restricted in convenience stores and traditional markets, with alcohol only allowed in licensed outlets, bars, and hotels. In 2023, it was reported that about 35% of sales venues in urban areas complied with these restrictions, ensuring controlled distribution.
Excise Taxes on Alcohol: Indonesia imposes high excise taxes on alcoholic beverages, which significantly raises their retail prices. These taxes are applied based on alcohol content, with stronger drinks like spirits facing higher taxes than beer and wine. In 2023, the excise tax on spirits was increased by 10%, further influencing the pricing strategies of both local and imported brands.
Advertising Restrictions: The promotion of alcoholic drinks in Indonesia is subject to stringent advertising rules. Alcohol brands are prohibited from advertising on mainstream media such as television, radio, and print outlets. However, some brands have turned to digital platforms and events to circumvent these restrictions. In 2023, approximately 25% of alcohol marketing budgets were directed toward digital campaigns and sponsorships, especially in urban areas.
Indonesia Alcoholic Drinks Market Segmentation
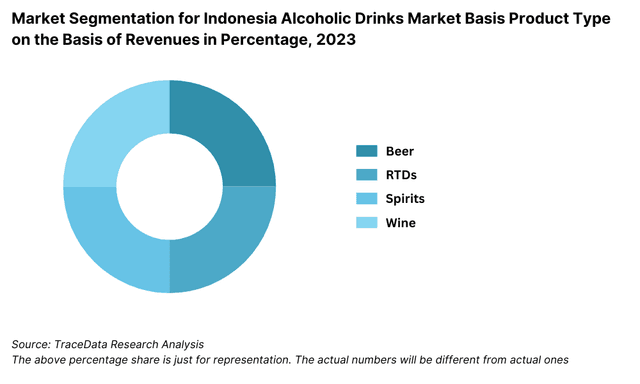
By Product Type: Beer dominates the alcoholic drinks market in Indonesia due to its affordability, wide availability, and lower alcohol content, which aligns with regulatory constraints. Beer brands such as Bintang and Anker have established strong market positions, particularly in urban centers and tourist regions like Bali. Spirits, including whiskey and vodka, follow closely, driven by demand from higher-income consumers and expatriates. Wine holds a smaller share of the market but has been growing in popularity due to the increasing middle-class population seeking premium lifestyle experiences.
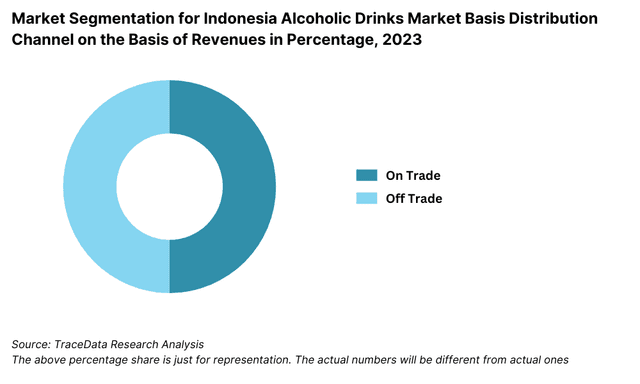
By Sales Channel: The off-trade channel, which includes retail stores such as supermarkets, hypermarkets, and licensed bottle shops, represents the largest share of alcohol sales in Indonesia. However, the on-trade segment, including bars, clubs, and restaurants, is seeing robust growth, especially in tourist areas. In 2023, on-trade sales grew by 12%, driven by the recovery of the hospitality sector post-pandemic.
By Consumer Demographics: Young urban professionals, aged 25-40, form the largest consumer base for alcoholic beverages, particularly in metropolitan areas such as Jakarta and Bali. This demographic group is increasingly opting for premium beer and craft spirits, influenced by global trends and higher disposable income. Meanwhile, middle-aged consumers tend to prefer traditional spirits such as arak and locally brewed beer.
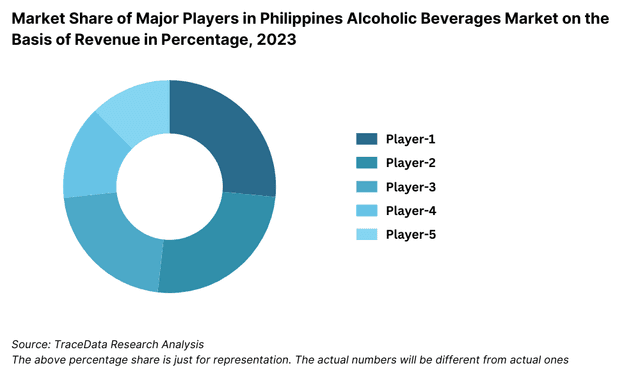
Competitive Landscape in Indonesia Alcoholic Drinks Market
The Indonesia alcoholic drinks market is relatively concentrated, with several key players dominating the space. However, the market is becoming more dynamic with the entry of new craft beer producers and the increasing popularity of premium spirits. Major players such as Multi Bintang Indonesia, Heineken, PT. Dima Indonesia, and PT. Delta Djakarta continue to hold significant market shares, but emerging local brands and innovative products are diversifying consumer choices.
Company Name | Establishment Year | Headquarters |
|---|---|---|
San Miguel Brewery Inc. | 1890 | Manila, Philippines |
Tanduay Distillers, Inc. | 1854 | Manila, Philippines |
Ginebra San Miguel | 1834 | Manila, Philippines |
Don Papa Rum | 2011 | Negros, Philippines |
Red Horse Beer (San Miguel) | 1982 | Manila, Philippines |
Emperador Inc. | 1979 | Quezon City, Philippines |
Asia Brewery, Inc. | 1982 | Makati, Philippines |
Heineken Philippines | 1864 | Amsterdam, Netherlands |
Pernod Ricard Philippines | 1975 | Paris, France |
Bacardi Philippines | 1862 | Hamilton, Bermuda |
Some of the recent competitor trends and key information about competitors include:
Multi Bintang Indonesia: As the leading player in Indonesia's beer market, Multi Bintang recorded a 15% increase in sales in 2023, driven by the growing demand for its flagship Bintang Beer and the rising popularity of its newly launched craft beer line. The company's robust distribution network across urban and tourist regions like Bali and Jakarta has helped solidify its market dominance.
Heineken: Heineken continues to maintain a strong presence in Indonesia, focusing on premium beer offerings and expanding its craft beer range. In 2023, the brand introduced a new digital marketing campaign aimed at millennial consumers, resulting in a 10% growth in brand engagement and a 7% rise in overall sales.
PT. Dima Indonesia: Known for distributing major international spirit brands such as Guinness and Smirnoff, PT. Dima Indonesia reported a 20% increase in spirits sales in 2023. The company has benefited from the rising demand for premium spirits among affluent consumers in urban areas, particularly in high-end restaurants and bars.
PT. Delta Djakarta: The producer of Anker Beer and Carlsberg, PT. Delta Djakarta witnessed an 8% rise in sales volume in 2023, with significant growth in its premium beer segment. The company's investment in enhancing its production facilities and distribution channels has contributed to its continued market expansion.
Stark Craft Beer: As a relatively new entrant in the market, Stark Craft Beer has been gaining popularity among young urbanites and expatriates in Bali. The company reported a 30% increase in sales in 2023, driven by the growing trend of craft beer consumption and its focus on locally sourced ingredients. Stark's innovative flavors and premium positioning have made it a notable competitor in the Indonesian market.
What Lies Ahead for Indonesia Alcoholic Drinks Market?
The Indonesia alcoholic drinks market is expected to grow steadily through 2029, supported by factors such as increasing urbanization, rising disposable income, and evolving consumer preferences towards premium and craft beverages. The market is projected to exhibit a respectable CAGR over the forecast period.
Rising Demand for Premium and Craft Beverages: With a growing middle class and the rise of urban professionals, demand for premium and craft alcoholic drinks is expected to increase significantly. Local breweries and distilleries are likely to expand their offerings in response to this trend, catering to a more discerning consumer base seeking quality and unique experiences.
Growth in Alcohol-Free Alternatives: The market for alcohol-free and low-alcohol beverages is projected to grow as health-conscious consumers seek alternatives to traditional alcoholic drinks. Major players are expected to introduce new alcohol-free products to capture this segment, supported by global trends toward healthier lifestyles.
Digital Sales Channels Expansion: The adoption of e-commerce platforms and delivery services for alcoholic drinks is expected to rise, particularly in urban centers. This shift is driven by changing consumer preferences for convenience and the growth of digital platforms. In 2023, online alcohol sales accounted for approximately 10% of the total market, a figure anticipated to grow as more players invest in digital infrastructure.
Government Initiatives on Local Production: The Indonesian government's support for the local production of alcoholic beverages, especially in regions like Bali and North Sulawesi, will likely spur the growth of domestic brands. These initiatives include providing subsidies and simplifying licensing for local producers, which is expected to drive innovation in the craft beer and traditional spirits sectors.
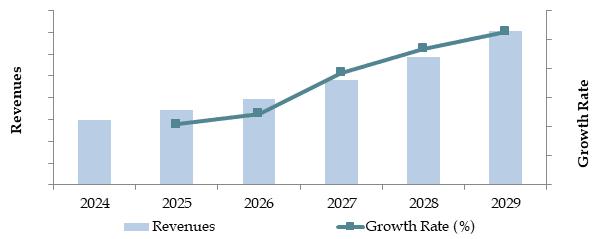
Future Outlook and Projections for Philippines Alcoholic Beverages Market on the Basis of Revenues in USD Billion, 2024-2029
Indonesia Alcoholic Drinks Market Segmentation
- By Alcohol Type:
- Beer
- Spirits (Whiskey, Vodka, Rum)
- Wine (Red, White, Sparkling)
- Cider
- Ready-to-Drink (RTD) Cocktails
- By Beer
- Lager
- Dark Beer and others
- By Beer
- Craft
- Standard Beer
- By RTDs
- Malt based RTDs
- Spirit Based RTDs
- Wine Based RTDs
- Non-Alcoholic RTDs and others
- By Spirits
- Brandy
- Dark Rum
- White Rum
- Whiskies
- Gin
- Vodka and others
- By Vodka
- Flavoured
- Non-Flavoured Vodka
- By Wine
- Fortified Wine
- Champagne
- Other Sparkling Wine
- Red Wine
- White Wine and others
- By Distribution Channel:
- On-Trade (Bars, Restaurants, Hotels)
- Off-Trade (Supermarkets, Hypermarkets, Convenience Stores)
- By Price Segment:
- Economy
- Mid-Range
- Premium
- Super Premium
- By Consumer Age:
- 18-24
- 25-34
- 35-54
55+
By Region:
Java
Bali
Sumatra
Kalimantan
Sulawesi
Players Mentioned in the Report:
San Miguel Brewery
Ginebra San Miguel
Tanduay Distillers
Emperador Distillers
Asia Brewery
Diageo Philippines
Pernod Ricard
William Grant & Sons
Key Target Audience:
Alcoholic Beverage Manufacturers
On-trade Businesses (Restaurants, Bars, Clubs)
Retailers (Supermarkets, Hypermarkets)
Distributors and Importers of Alcoholic Drinks
Government Regulatory Bodies (e.g., Ministry of Trade)
Research and Development Institutions
Time Period:
Historical Period: 2018-2023
Base Year: 2024
Forecast Period: 2024-2029
Explore Flexible Purchase Options or Have Limited Budget?
Pay only for relevant chapters • Customizable report sections
Table of Contents
Choose individual sections to purchase. Mix and match as you like.
4.1. Value Chain Process-Role of Entities, Stakeholders, Gross Margins, and Challenges they Face
4.2. Business Model Canvas for Indonesia Alcoholic Drinks Market
4.3. Consumer Buying Decision Process
5.1. Market Overview and Genesis
5.2. Number of Breweries and Microbreweries, as on Date
8.1. Revenues, 2018-2024
8.2. Sales Volume, 2018-2024
9.1. By Type (Beer, Cider, RTDs, Spirits and Wine), 2018-2023
9.1.1. By Beer (Lager, Dark Beer and others), 2018-2023
9.1.1.1. By Lager (Domestic Premium and Imported Premium), 2018-2023
9.1.1.2. By Craft and Standard Beer, 2018-2023
9.1.1.3. By Price (Super Premium, Premium, Standard and Economy), 2018-2023
9.1.2. By RTDs (Malt based RTDs, Spirit Based RTDs, Wine Based RTDs, Non-Alcoholic RTDs and others), 2018-2023
9.1.2.1. By Price (Super Premium, Premium, Standard and Economy), 2018-2023
9.1.3. By Spirits (Brandy, Dark Rum, White Rum, Whiskies, Gin, Vodka and others), 2018-2023
9.1.3.1. By Price (Super Premium, Premium, Standard and Economy), 2018-2023
9.1.3.2. By Flavoured and Non-Flavoured Vodka, 2018-2023
9.1.4. By Wine (Fortified Wine, Champagne, Other Sparkling Wine, Red Wine, White Wine and others), 2018-2023
9.1.4.1. By Price (Super Premium, Premium, Standard and Economy), 2018-2023
9.2. By Off Trade and On Trade for Each Type of Alcoholic Beverages, 2023
9.2.1. By Distribution Channel for Off Trade, 2023
9.3. By Region, 2023-2024P
10.1. Customer Landscape and Segment Analysis
10.2. Customer Journey and Decision-Making Process
10.3. Consumer Needs, Preferences, and Pain Points
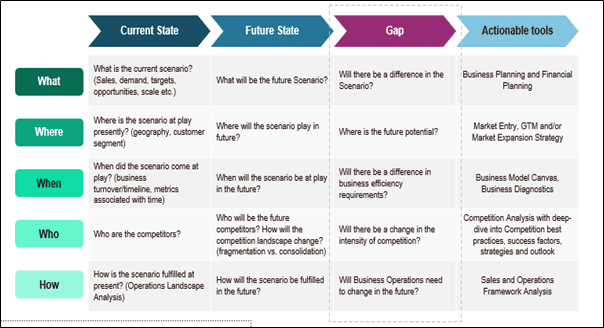
10.4. Gap Analysis Framework
11.1. Trends and Developments in Indonesia Alcoholic Drinks Market
11.2. Growth Drivers for Indonesia Alcoholic Drinks Market
11.3. SWOT Analysis for Indonesia Alcoholic Drinks Market
11.4. Issues and Challenges for Indonesia Alcoholic Drinks Market
11.5. Government Regulations for Indonesia Alcoholic Drinks Market
14.1. Market Share of Key Players in Alcoholic Beverages Market, 2023
14.2. Market Share of Key Players in Beer Market, 2023
14.3. Market Share of Key Players in Wine Market, 2023
14.4. Market Share of Key Players in Spirits Market, 2023
14.5. Market Share of Key Players in RTDs Market, 2023
14.6. Benchmark of Key Competitors in Indonesia Alcoholic Drinks Market Basis 15-20 Operational and Financial Parameters
14.7. Strength and Weakness of Key Competitors
14.8. Operating Model Analysis Framework
14.9. Gartner Magic Quadrant for Market Positioning
14.10. Bowmans Strategic Clock for Competitive Advantage
15.1. Revenues, 2025-2029
15.2. Sales Volume, 2025-2029
16.1. By Type (Beer, Cider, RTDs, Spirits and Wine), 2025-2029
16.1.1. By Beer (Lager, Dark Beer and others), 2025-2029
16.1.1.1. By Lager (Domestic Premium and Imported Premium), 2025-2029
16.1.1.2. By Craft and Standard Beer, 2025-2029
16.1.1.3. By Price (Super Premium, Premium, Standard and Economy), 2025-2029
16.1.2. By RTDs (Malt based RTDs, Spirit Based RTDs, Wine Based RTDs, Non-Alcoholic RTDs and others), 2025-2029
16.1.2.1. By Price (Super Premium, Premium, Standard and Economy), 2025-2029
16.1.3. By Spirits (Brandy, Dark Rum, White Rum, Whiskies, Gin, Vodka and others), 2025-2029
16.1.3.1. By Price (Super Premium, Premium, Standard and Economy), 2025-2029
16.1.3.2. By Flavoured and Non-Flavoured Vodka, 2025-2029
16.1.4. By Wine (Fortified Wine, Champagne, Other Sparkling Wine, Red Wine, White Wine and others), 2025-2029
16.1.4.1. By Price (Super Premium, Premium, Standard and Economy), 2025-2029
16.2. By Off Trade and On Trade for Each Type of Alcoholic Beverages, 2025-2029
16.2.1. By Distribution Channel for Off Trade, 2025-2029
16.3. By Region, 2025-2029
17.1. Strategic Recommendation
17.2. Opportunity Identification
Discuss a Customized Research Scope
Custom research scope • Tailored insights • Industry expertise
Research Methodology
Step 1: Ecosystem Creation
Mapping the Ecosystem: We begin by mapping the entire ecosystem and identifying all demand and supply-side entities within the Indonesia Alcoholic Drinks Market. This includes alcoholic beverage manufacturers, distributors, retailers, and consumer segments. Based on this mapping, we shortlist the top 5-6 market leaders based on financial performance, production capacity, and volume of sales.
Sourcing: We gather data through a combination of industry articles, government reports, and secondary proprietary databases to build a foundational understanding of the market. This desk research helps in compiling industry-level data on sales, production, and consumption trends.
Step 2: Desk Research
Comprehensive Desk Research: Through an exhaustive process, we refer to secondary sources and proprietary databases to gather detailed market insights. This phase focuses on analyzing revenue data, identifying key market players, evaluating price trends, and understanding supply-demand dynamics. We incorporate data from company press releases, annual reports, and financial statements to analyze both market-level and company-level performance. This step helps establish a baseline understanding of the market's structure and competitive landscape.
Step 3: Primary Research
In-depth Interviews: We conduct in-depth interviews with key stakeholders, including C-level executives and other industry leaders from Indonesia’s alcoholic drinks market. This helps validate market hypotheses, cross-check statistical data, and extract deeper insights on operational processes and financial performance. The interviews also provide a first-hand understanding of trends, challenges, and future opportunities in the market.
Disguised Interviews: To further verify the data collected from company executives, we engage in disguised interviews by posing as potential customers. This approach provides an additional layer of validation for both financial and operational data. It also gives us detailed insights into value chains, pricing mechanisms, and other important market dynamics.
Step 4: Sanity Check
- Market Size Modeling: A sanity check is performed using both bottom-to-top and top-to-bottom approaches. This process involves building and cross-referencing market size models to ensure accuracy and consistency. The modeling process helps confirm that our data on market volumes, growth rates, and projections are reliable and grounded in industry realities.
See What's Inside the Report
Get a preview of key findings, methodology and report coverage
Frequently Asked Questions
The Indonesia alcoholic drinks market is set to experience substantial growth, reaching an estimated valuation of IDR 100 trillion by 2029. This growth is driven by factors such as rising disposable incomes, increasing urbanization, and evolving consumer preferences for premium and craft alcoholic beverages. The expansion of e-commerce and digital platforms, as well as the recovery of the hospitality industry, are expected to further support market potential.
Key players in the Indonesia alcoholic drinks market include Multi Bintang Indonesia, Heineken, PT. Dima Indonesia, and PT. Delta Djakarta. These companies hold significant market shares due to their strong distribution networks, established brand presence, and diverse product portfolios. Emerging brands like Stark Craft Beer and Hatten Wines are also gaining recognition, particularly in the premium and craft beverage segments.
Major growth drivers for the Indonesia alcoholic drinks market include increasing consumer demand for premium products, growth in urban centers, and a shift toward social drinking culture among younger consumers. The recovery of the tourism industry, especially in regions like Bali, is also expected to boost sales of alcoholic beverages. Additionally, government initiatives to support local production and relaxed alcohol regulations in certain regions contribute to the market’s expansion.
The Indonesia alcoholic drinks market faces several challenges, including stringent government regulations on the sale and advertising of alcohol, high taxes and import duties, and cultural restrictions in Muslim-majority areas. Distribution limitations, particularly outside major urban areas, and competition from non-alcoholic beverages also present hurdles to market growth.
License Options
PDF + Excel
Complete report package
$4,000
Excel Only
Data and analytics
$2,500
Custom Sections
Starts from $100
$0