Indonesia Cold Chain Market Outlook to 2029
By Market Segments (Cold Storage and Cold Transportation), By End-User Industries, By Type of Storage, and By Region
Report Overview
Report Code
TDR0281
Coverage
Asia
Published
September 2025
Pages
80
Flexible Purchase Options
Select and purchase only the chapters you need for your strategic decisions
On This Page
Report Overview
The report titled “Indonesia Cold Chain Market Outlook to 2029 – By Market Segments (Cold Storage and Cold Transportation), By End-User Industries, By Type of Storage, and By Region” provides a comprehensive analysis of the cold chain sector in Indonesia. The report covers an overview and genesis of the industry, overall market size in terms of revenue, market segmentation, trends and developments, regulatory landscape, customer level profiling, issues and challenges, and comparative landscape including competition scenario, cross comparison, opportunities and bottlenecks, and company profiling of major players in the Indonesian cold chain market.
Report Coverage
Verified Market Sizing
Multi-layer forecasting with historical data and 5–10 year outlook
Deep-Dive Segmentation
Cross-sectional analysis by product type, end user, application and region
Competitive Benchmarking & Positioning
Market share, operating model, pricing and competition matrices
Actionable Insights & Risk Assessment
High-growth white spaces, underserved segments, technology disruptions and demand inflection points
Review Methodology & Data Structure
Preview report structure, data sources and research framework
Executive Summary
The report titled “Indonesia Cold Chain Market Outlook to 2029 – By Market Segments (Cold Storage and Cold Transportation), By End-User Industries, By Type of Storage, and By Region” provides a comprehensive analysis of the cold chain sector in Indonesia. The report covers an overview and genesis of the industry, overall market size in terms of revenue, market segmentation, trends and developments, regulatory landscape, customer level profiling, issues and challenges, and comparative landscape including competition scenario, cross comparison, opportunities and bottlenecks, and company profiling of major players in the Indonesian cold chain market. The report concludes with future market projections based on industry revenue, by segment, transport mode, region, and success case studies highlighting major opportunities and key risks.
Indonesia Cold Chain Market Overview and Size
The Indonesia cold chain market was valued at IDR 42 Trillion in 2023, driven by growing demand for perishable goods transportation, processed food consumption, and pharmaceutical distribution. The expansion of organized retail, meal delivery platforms, and rising health awareness have further fueled the cold chain market demand. Key players such as DHL Supply Chain Indonesia, GAC Samudera Logistics, Wahana Cold Chain, and PT Diamond Cold Storage dominate the market with extensive infrastructure, integrated temperature control solutions, and innovation in tracking and monitoring systems.
In 2023, Wahana Cold Chain expanded its warehouse space in Greater Jakarta and Surabaya to cater to growing demand from the foodservice and vaccine distribution segments. Jakarta, East Java, and North Sumatra emerged as high-demand zones due to their population density, port connectivity, and agri-processing base.
%252C%25202019-2024.png&w=640&q=75)
What Factors are Leading to the Growth of Indonesia Cold Chain Market:
Rising Processed Food Consumption: Rapid urbanization and shifting dietary preferences have increased the demand for frozen and packaged food products, leading to the expansion of cold storage facilities across major urban centers.
E-Commerce and Q-Commerce Growth: The surge in online grocery shopping and instant delivery platforms such as Tokopedia, Bukalapak, and GrabMart is driving the need for reliable last-mile cold transportation and temperature-controlled micro-fulfillment centers.
Healthcare and Pharmaceutical Logistics: Increasing demand for temperature-sensitive pharmaceuticals, including vaccines and biologics, is compelling healthcare logistics providers to invest in advanced cold chain infrastructure.
Which Industry Challenges Have Impacted the Growth for Indonesia Cold Chain Market
Lack of Integrated Infrastructure and Fragmentation: Indonesia’s cold chain sector remains fragmented, especially across its archipelagic geography. More than 65% of cold chain operators in 2023 operated on a small or regional scale, lacking integrated warehousing and transport systems. This has led to inconsistent temperature control and a spoilage rate of nearly 20% for perishables during transit.
Limited Skilled Workforce in Cold Chain Operations: Cold chain logistics require technical expertise in temperature monitoring, product handling, and fleet management. However, a persistent shortage of trained personnel has hindered operational efficiency, with 30% of service providers in 2023 citing challenges in finding skilled staff for critical cold chain roles.
High Operating Costs and Energy Dependency: Cold storage facilities in Indonesia face high energy costs, accounting for up to 40% of operational expenses. Dependence on diesel-powered refrigeration and unreliable electricity supply in outer regions further increase operational risks and limit scalability.
What are the Regulations and Initiatives which have Governed the Market
National Logistics Ecosystem (NLE) Program: Launched by the Indonesian government to improve coordination between ports, customs, and logistics providers, the NLE aims to enhance transparency, reduce dwell times, and streamline documentation. As of 2023, the NLE integration at Jakarta’s Tanjung Priok Port reduced average cargo clearance time by 27%.
Cold Chain Infrastructure Development Support (2022–2026): The Ministry of Maritime Affairs and Investment has partnered with both public and private players to establish cold storage hubs across major fishery zones. In 2023, over IDR 1.5 Trillion was allocated for cold storage development in Eastern Indonesia, targeting key seafood export provinces.
Halal Assurance and Food Safety Compliance Laws: With rising export of halal food and pharmaceuticals, regulatory bodies have introduced stricter protocols for cold chain certifications. As of 2023, over 80% of large-scale cold storage operators were required to obtain Halal Cold Chain Logistics certification under the new BPJPH regulations.
Indonesia Cold Chain Market Segmentation
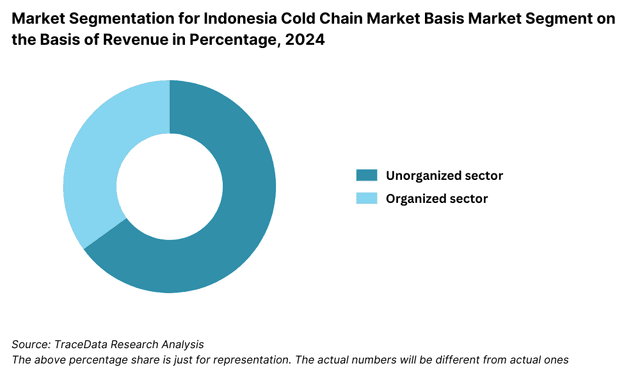
By Market Structure: The Indonesian cold chain market is predominantly composed of small and mid-sized logistics firms operating regionally, particularly around Java and Sumatra. These players cater to local food processors and retailers who value cost efficiency and agility. However, the share of organized 3PL cold chain providers like DHL Supply Chain Indonesia, GAC Samudera, and Wahana Cold Chain has been expanding. These firms offer end-to-end solutions including cold warehousing, reefer transport, and real-time temperature monitoring, making them preferred partners for pharmaceuticals, high-value perishables, and export-driven businesses.
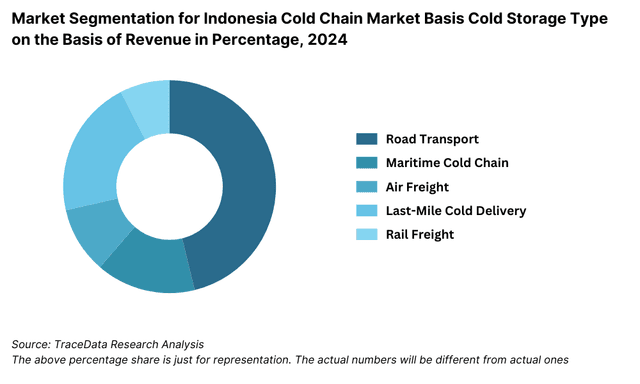
By Mode of Transport:Refrigerated road transport is the most commonly used mode across major islands, particularly Java, due to its ability to offer point-to-point delivery. However, maritime cold chain logistics is vital for inter-island movement, especially for seafood and frozen foods exported from Sulawesi, Maluku, and Papua. Air freight remains a small but growing segment, especially for time-sensitive pharma and high-end frozen foods, primarily between Jakarta, Surabaya, and regional hubs like Medan.
By End-User Industry: The food processing and seafood industries remain the largest consumers of cold chain services, given Indonesia’s strong domestic consumption and export orientation. Retail and modern trade (e.g., Alfamart, Indomaret, and Carrefour) are increasing their cold logistics demand due to the expansion of frozen and dairy product categories. The pharmaceutical sector has emerged as a fast-growing user, with the rise of specialty drugs, vaccines, and insulin products. The dairy and meat sectors are also pushing cold chain infrastructure expansion in peri-urban and rural zones.
Competitive Landscape in Indonesia Cold Chain Market
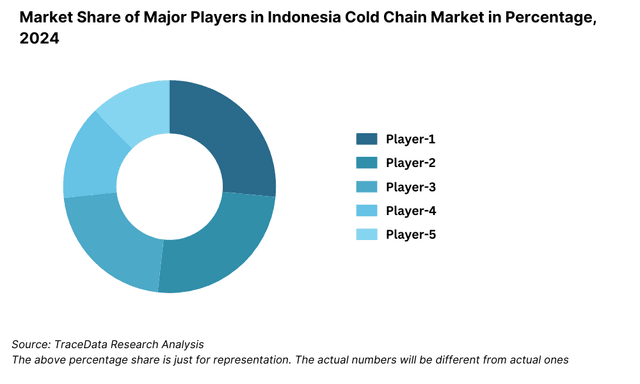
The Indonesia cold chain market is moderately fragmented with a growing presence of organized 3PL providers, especially in metropolitan and export-oriented regions. While many small and regional operators cater to local food processing needs, larger firms are expanding their footprint by offering integrated cold storage, transportation, and value-added services. The rise of modern retail, online grocery platforms, and pharmaceutical distribution has encouraged innovation and scale-building. Key players include DHL Supply Chain Indonesia, GAC Samudera Logistics, Wahana Cold Chain, PT Diamond Cold Storage, and Salam Pacific Indonesia Lines (SPIL).
Company Name | Founding Year | Original Headquarters |
DHL Supply Chain Indonesia | 1969 (ID: ~1990s) | Bonn, Germany |
GAC Samudera Logistics | 1956 (ID: ~1997) | Dubai, UAE |
PT Diamond Cold Storage | 1974 | Jakarta, Indonesia |
Wahana Cold Chain | 2012 | Jakarta, Indonesia |
Salam Pacific Indonesia Lines (SPIL) | 1970 | Surabaya, Indonesia |
Maersk Indonesia | 1904 (ID: ~1990s) | Copenhagen, Denmark |
Kuehne + Nagel Indonesia | 1890 (ID: ~1990s) | Schindellegi, Switzerland |
Agility Indonesia | 1979 (ID: ~2000s) | Kuwait City, Kuwait |
Yusen Logistics Indonesia | 1955 (ID: ~2000s) | Tokyo, Japan |
Nippon Express Indonesia | 1937 (ID: ~1970s) | Tokyo, Japan |
CEVA Logistics Indonesia | 2006 (ID: ~2008) | Marseille, France |
FedEx Express Indonesia | 1971 (ID: ~1980s) | Memphis, USA |
UPS Indonesia | 1907 (ID: ~1990s) | Atlanta, USA |
Some of the Recent Competitor Trends and Key Information Include:
DHL Supply Chain Indonesia: In 2023, DHL opened a new multi-temperature facility in West Java catering to the pharmaceutical and food sectors. It also introduced RFID-enabled tracking systems for cold transportation, reducing temperature deviation incidents by 18%.
GAC Samudera Logistics: GAC enhanced its refrigerated trucking fleet and cold warehousing footprint across Greater Jakarta and Surabaya. The firm reported a 22% YoY increase in demand for seafood and frozen poultry logistics in 2023.
PT Diamond Cold Storage: One of the oldest cold chain players in Indonesia, the company expanded its processing and storage facilities to support dairy and meat distribution. It now manages over 80,000 pallet positions nationwide.
Wahana Cold Chain: A rapidly growing cold logistics startup, Wahana added cross-docking stations in Makassar and Medan. In 2023, the company launched an on-demand refrigerated delivery model for fresh produce and QSR clients.
Salam Pacific Indonesia Lines (SPIL): SPIL integrated cold chain logistics into its inter-island shipping routes. In 2023, it piloted containerized reefer shipments from Papua to Java, ensuring fresh seafood delivery within 48 hours.
What Lies Ahead for Indonesia Cold Chain Market?
The Indonesia cold chain market is projected to witness strong growth by 2029, fueled by rising consumer demand for perishable products, rapid expansion in online grocery, and increased regulatory focus on food and pharmaceutical safety. The market is expected to record a healthy CAGR during the forecast period, supported by investments in cold infrastructure, digital integration, and government-backed logistics reforms.
Acceleration of E-Grocery and Quick Commerce Fulfillment: Indonesia’s e-grocery segment is expected to grow rapidly, especially in metro areas like Jakarta, Bandung, and Surabaya. Platforms such as Tokopedia, Bukalapak, and GrabMart are investing in localized cold storage hubs and express cold transport solutions to ensure freshness and reduce spoilage.
Expansion of Cold Chain Infrastructure Beyond Java: As the government pushes regional development, cold chain investments are expected to expand into Eastern Indonesia, including Sulawesi and Papua. Fisheries, poultry, and agriculture sectors in these regions will benefit from newly built cold storage and reefer container terminals.
Digitization and Temperature Monitoring Technologies: The next phase of cold chain evolution in Indonesia will be marked by widespread adoption of IoT-based temperature tracking, automated stock control, and blockchain-enabled product traceability. These technologies will improve reliability and compliance for sensitive goods.
Growth in Pharma and Life Sciences Cold Logistics: With rising demand for vaccines, biologics, and insulin across Indonesia’s growing population, pharmaceutical companies will continue to drive demand for high-quality, GDP-compliant cold chain networks—especially for long-haul and inter-island transport.
%252C%25202024-2030.png&w=640&q=75)
Indonesia Cold Chain Market Segmentation
• By Market Structure:
o Cold Storage Facility Operators
o Refrigerated Transportation Providers
o Integrated Cold Chain Logistics Providers
o Third-Party Cold Chain Logistics (3PL)
o Fourth-Party Logistics (4PL)
o Organized Sector
o Unorganized/Traditional Players
• By Mode of Transport:
o Refrigerated Road Transport
o Air Freight (Perishable & Pharma)
o Sea Freight / Reefer Containers
o Multimodal Cold Chain Transport
• By End-User Industry:
o Food Processing
o Dairy and Ice Cream
o Meat and Seafood
o Fruits and Vegetables
o Pharmaceuticals and Vaccines
o Quick Service Restaurants (QSR)
o Modern Retail & E-Grocery
• By Type of Storage:
o Frozen Storage Facilities
o Chilled Storage Facilities
o Controlled Atmosphere Warehousing
o Bonded Cold Warehousing
o Built-to-Suit Cold Warehouses
• By Region:
o Greater Jakarta (Jabodetabek)
o West Java
o East Java (incl. Surabaya)
o Sumatra (incl. Medan)
o Kalimantan
o Sulawesi and Papua
Players Mentioned in the Report:
Cold Storage and Integrated Logistics Providers
• DHL Supply Chain Indonesia
• GAC Samudera Logistics
• PT Diamond Cold Storage
• Wahana Cold Chain
• Salam Pacific Indonesia Lines (SPIL)
• PT Charoen Pokphand Indonesia Cold Chain
• PT Era Mandiri Cemerlang
Refrigerated Transport Operators
• Indah Logistik
• Nusantara Cold Chain Logistics
• BSA Logistics
• Waru Logistics
E-Commerce Cold Chain Providers
• GrabMart Fulfillment
• Bukalapak Q-Commerce Logistics
• Sayurbox
• HappyFresh
Pharmaceutical Cold Chain Providers
• Kalbe Farma Logistics
• Enseval Putera Megatrading
• PT Dexa Medica Cold Storage
Key Target Audience:
• Cold Chain Logistics and Warehousing Companies
• Pharmaceutical Distributors and Healthcare Providers
• Frozen & Processed Food Manufacturers
• E-Commerce Grocery and Retail Aggregators
• Government and Regulatory Authorities (e.g., Ministry of Maritime Affairs, BPOM)
• Technology and Refrigeration Solution Providers
• Private Equity and Infrastructure Investors
• Research and Consulting Firms
Time Period:
• Historical Period: 2018–2023
• Base Year: 2024
• Forecast Period: 2024–2029
Explore Flexible Purchase Options or Have Limited Budget?
Pay only for relevant chapters • Customizable report sections
Table of Contents
Choose individual sections to purchase. Mix and match as you like.
4.1. Macroeconomic framework for Indonesia Including GDP (2018-2024), GDP Growth (2018-2024), GDP Contribution by Sector
4.2. Cold Chain Sector Contribution to GDP and how the contribution has been changing in the historical assessment
4.3. Ease of Doing Business in Indonesia
4.4. LPI Index of Indonesia and Improvements in the last 10-“15 Years
4.5. Custom Procedure and Custom Charges in Indonesia Cold Chain Market
5.1. Landscape of Investment Parks and Cold Chain Clusters in Indonesia
5.2. Current Scenario for Cold Chain Infrastructure in Indonesia
5.3. Road Infrastructure in Indonesia including Road Network, Toll Charges and Toll Network, Major Goods Traded through Road, Major Flow Corridors for Road (Inbound and Outbound)
5.4. Air Infrastructure in Indonesia including Total Volume Handled, FTK for Air Freight, Major Inbound and Outbound Flow Corridors, Major Goods traded through Air, Number of Commercial and Passenger Airports, Air Freight Volume by Ports and other Parameters
5.5. Sea Infrastructure in Indonesia including Total Volume Handled, FTK for Sea Freight, Major Inbound and Outbound Flow Corridors, Major Goods Traded through Sea, Number of Ports for Coastal and Ocean Freight, Number of Vessels, Sea Freight Volume by Ports and other Parameters
5.6. Rail Infrastructure in Indonesia including Total Volume Handled, FTK for Rail Freight, Major Inbound and Outbound Flow Corridors, Major Goods Traded through Rail and others
6.1. Basis Revenues, 2018-“2024P
7.1. By Segment (Cold Storage and Cold Transportation), 2018-“2024P
7.2. By End User Industries, 2018-“2024P
8.1. Market Overview and Genesis
8.2. Indonesia Cold Storage Market Size by Revenues, 2018-“2024P
8.3. Indonesia Cold Storage Market Segmentation, 2018-“2024P
8.3.1. By Storage Type (Frozen, Chilled, Controlled Atmosphere), 2018-“2024P
8.3.2. By Region (Java, Sumatra, Kalimantan, Sulawesi, Papua), 2018-“2024P
8.3.3. By End User Industry (Food Processing, Pharma, Retail, Dairy, QSR), 2018-“2024P
8.4. Competitive Landscape in Indonesia Cold Storage Market, 2021
8.4.1. Heat Map of Major Players in Indonesia Cold Storage on the Basis of Service Offering
8.4.2. Market Share of Major Players in Indonesia Cold Storage Market, 2023
8.4.3. Cross Comparison of Major Players on Parameters including Storage Capacity, Warehouse Footprint, Regions Served, Type of Storage, Revenue, Technology Use, Future Plans, and Clients
8.5. Indonesia Cold Storage Future Market Size by Revenues, 2025-“2029
8.6. Indonesia Cold Storage Market Segmentation, 2025-“2029
8.6.1. Future Market Segmentation by Storage Type, 2025-“2029
8.6.2. Future Market Segmentation by End User, 2025-“2029
8.6.3. Future Market Segmentation by Region, 2025-“2029
9.1. Market Overview and Genesis
9.2. Indonesia Cold Transportation Market Size by Revenues, 2018-“2024P
9.3. Indonesia Cold Transportation Market Segmentation, 2018-“2024P
9.3.1. By Mode of Transport (Road, Sea, Air, Multimodal), 2018-“2024P
9.3.2. By End User (Seafood, Pharma, Dairy, F&B, Retail), 2018-“2024P
9.4. Competitive Landscape in Indonesia Cold Transportation Market, 2021
9.4.1. Market Share of Major Players in Indonesia Cold Transportation Market, 2023
9.4.2. Cross Comparison of Major Players by Fleet Size, Route Network, Refrigeration Type, Technology, Revenue, and Major Clients
9.5. Indonesia Cold Transportation Market Future Size, 2025-“2029
9.6. Indonesia Cold Transportation Market Future Segmentation, 2025-“2029
9.6.1. Future Segmentation by Mode of Transport, 2025-“2029
9.6.2. Future Segmentation by End User, 2025-“2029
10.1. Technology Adoption-“ IoT, RFID, and Automation in Cold Chain
10.2. Growth in Quick Commerce and E-Grocery Cold Delivery
10.3. Inter-Island Cold Chain Logistics Expansion
10.4. Sustainability Practices-“ Solar-Powered Warehousing and Eco Refrigerants
11.1. High Operational Costs and Energy Dependence
11.2. Skilled Manpower Shortage
11.3. Regulatory Hurdles in Halal and Pharma Logistics
11.4. Infrastructure Gaps in Remote Islands
12.1. National Logistics Ecosystem (NLE) Program
12.2. Cold Chain Tax Incentives and Investment Zones
12.3. Food and Pharma Cold Chain Safety Regulations (BPOM)
12.4. Halal Supply Chain Certification Rules
13.1. Cold Chain Demand by Sector (FMCG, Seafood, Pharma, Dairy, QSR, Retail)
13.2. End User Preferences: In-House vs. Outsourcing
13.3. Contract Structures, Sourcing Models, and Challenges by Industry
13.4. Logistics Spend Breakdown and Future Demand Expectations
14.1. Basis Revenues, 2025-“2029
15.1. By Segment (Cold Storage, Cold Transportation), 2025-“2029
15.2. By End User Industries, 2025-“2029
15.3. By Transport Mode, 2025-“2029
15.4. By Region, 2025-“2029
16.1. Technology and Automation
16.2. Sustainable and Green Logistics
16.3. Integration Across Islands
16.4. Vaccine and Pharma Logistics Expansion
Discuss a Customized Research Scope
Custom research scope • Tailored insights • Industry expertise
Research Methodology
Step 1: Ecosystem Creation
Map the ecosystem and identify all the demand-side (e.g., food processing, QSRs, e-grocery platforms, pharmaceuticals, seafood exporters) and supply-side (e.g., cold storage providers, reefer fleet operators, integrated 3PLs, distribution hubs) entities within the Indonesia Cold Chain Market.
Based on this ecosystem, we shortlist 6–8 leading cold chain companies in Indonesia, selected using parameters such as storage capacity (pallet positions), fleet size (reefer trucks and containers), service integration (end-to-end cold chain solutions), and regulatory compliance (e.g., GDP, halal logistics certification).
Sourcing is carried out using industry articles, investment announcements, annual reports, news portals, and proprietary industry databases to conduct comprehensive desk research and gather key market intelligence.
Step 2: Desk Research
A detailed secondary research process is undertaken to collect information from public and private sources including Ministry of Maritime Affairs and Investment (Indonesia), BPOM, APICS, ASEAN Cold Chain Forums, World Bank Logistics Performance Index, and publications from cold chain associations (e.g., ALFI, GAPMMI).
Key variables studied include market size by cold storage and transportation, regional infrastructure development, regulatory trends, cost drivers, perishables trade flow, and technology penetration.
Company-level insights are derived from financial statements, corporate presentations, press releases, and industry case studies to map capabilities and operational scale across players.
Step 3: Primary Research
We conduct in-depth interviews with CXOs and operational heads from leading cold chain firms, logistics infrastructure developers, exporters of perishables, and representatives from retail chains and pharma majors.
These discussions help validate secondary insights, assess current infrastructure gaps, understand pricing models, and evaluate demand for multi-temperature and inter-island cold logistics.
To authenticate data on fleet size, storage capacity, and service pricing, we also carry out mystery client interviews with cold chain vendors and transport aggregators.
A bottom-up approach is used to build the market model by aggregating regional and vertical-specific data, which is then triangulated with top-down inputs from macroeconomic indicators and trade volumes.
Step 4: Sanity Check
Final outputs are verified through top-down and bottom-up validation methods, margin benchmarking, and triangulation with historical market growth and ASEAN-level peer comparisons.
Government policy reviews and future infrastructure investment announcements are also factored in to assess forward-looking estimates, ensuring consistency, reliability, and alignment with national logistics goals.
See What's Inside the Report
Get a preview of key findings, methodology and report coverage
Frequently Asked Questions
The Indonesia cold chain market is expected to witness significant expansion, reaching a projected valuation of over IDR 75 Trillion by 2029. Growth is driven by rising consumption of frozen and processed foods, increased demand for pharmaceutical cold logistics, and expanding e-grocery and Q-commerce sectors. Infrastructure development beyond Java and digital innovations in cold chain management will further unlock market scalability and efficiency.
Major players in the Indonesia cold chain industry include DHL Supply Chain Indonesia, GAC Samudera Logistics, Wahana Cold Chain, PT Diamond Cold Storage, and Salam Pacific Indonesia Lines (SPIL). These firms are leading the market through extensive cold storage capacity, reefer fleet expansion, and integration of digital temperature monitoring technologies across the supply chain.
Primary growth drivers include increasing demand for temperature-sensitive food and pharmaceutical products, expansion of e-commerce grocery services, government-backed logistics infrastructure projects, and rising export volumes of seafood and perishables. Additionally, the adoption of IoT-enabled tracking, automated warehousing, and solar-powered cold storage is strengthening operational reliability.
Key challenges include limited cold infrastructure in remote islands, high electricity and diesel costs, fragmented service offerings from small-scale operators, and lack of skilled workforce in cold chain handling. Regulatory compliance with food safety and halal logistics standards also adds operational complexity. Ensuring consistent temperature maintenance across inter-island transport remains a critical bottleneck.
License Options
PDF + Excel
Complete report package
$4,000
Excel Only
Data and analytics
$2,500
Custom Sections
Starts from $100
$0