Indonesia Drip Irrigation Market Outlook to 2035
By Crop Type, By Application Method, By System Component, By Farm Size, and By Region
Report Overview
Report Code
TDR0439
Coverage
Asia
Published
January 2026
Pages
80
Flexible Purchase Options
Select and purchase only the chapters you need for your strategic decisions
On This Page
Report Overview
The report titled “Indonesia Drip Irrigation Market Outlook to 2035 – By Crop Type, By Application Method, By System Component, By Farm Size, and By Region” provides a comprehensive analysis of the drip irrigation industry in Indonesia. The report covers an overview and genesis of the market, overall market size in terms of value, detailed market segmentation; trends and developments, regulatory and policy landscape, farmer- and plantation-level demand profiling, key issues and challenges, and competitive landscape including competition scenario, cross-comparison, opportunities and bottlenecks, and company profiling of major players operating in the Indonesia drip irrigation market.
Report Coverage
Verified Market Sizing
Multi-layer forecasting with historical data and 5–10 year outlook
Deep-Dive Segmentation
Cross-sectional analysis by product type, end user, application and region
Competitive Benchmarking & Positioning
Market share, operating model, pricing and competition matrices
Actionable Insights & Risk Assessment
High-growth white spaces, underserved segments, technology disruptions and demand inflection points
Review Methodology & Data Structure
Preview report structure, data sources and research framework
Executive Summary
The report titled “Indonesia Drip Irrigation Market Outlook to 2035 – By Crop Type, By Application Method, By System Component, By Farm Size, and By Region” provides a comprehensive analysis of the drip irrigation industry in Indonesia. The report covers an overview and genesis of the market, overall market size in terms of value, detailed market segmentation; trends and developments, regulatory and policy landscape, farmer- and plantation-level demand profiling, key issues and challenges, and competitive landscape including competition scenario, cross-comparison, opportunities and bottlenecks, and company profiling of major players operating in the Indonesia drip irrigation market.
The report concludes with future market projections based on agricultural modernization programs, water-use efficiency imperatives, plantation crop expansion, horticulture intensification, government subsidy mechanisms, climate variability, and regional demand drivers, along with cause-and-effect relationships and case-based illustrations highlighting the major opportunities and cautions shaping the market through 2035.
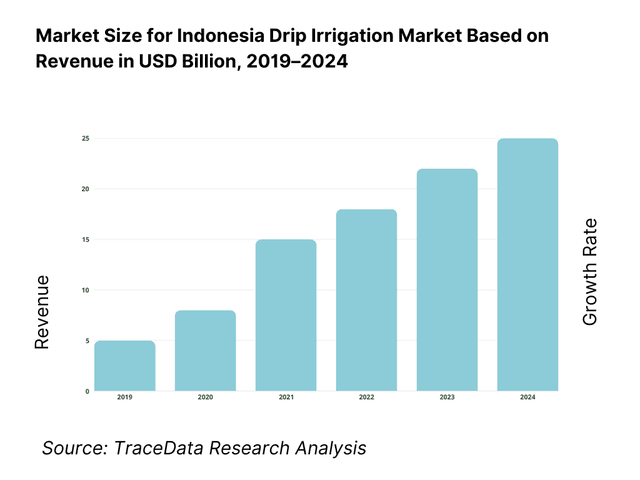
Indonesia Drip Irrigation Market Overview and Size
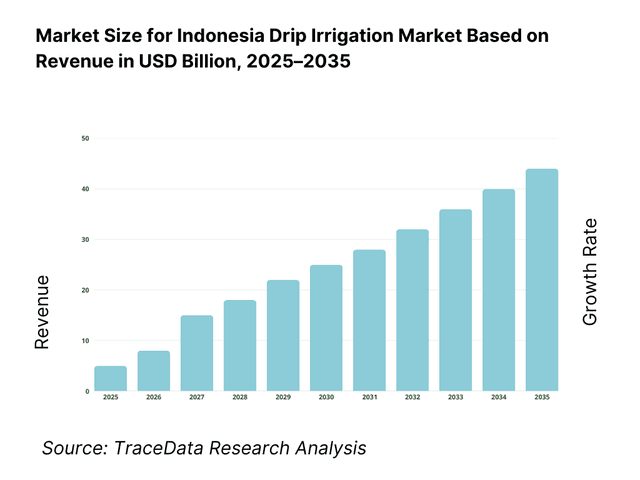
The Indonesia drip irrigation market is valued at approximately ~USD ~ million, representing the supply of micro-irrigation systems designed to deliver water and nutrients directly to the root zone of crops through a network of emitters, laterals, sub-mains, filters, valves, and control systems. Drip irrigation solutions in Indonesia are deployed across plantation crops, horticulture, vegetables, fruits, floriculture, and increasingly in protected cultivation and high-value crop clusters.
The market is anchored by Indonesia’s large agricultural base, growing pressure on freshwater resources, increasing variability in rainfall patterns, and the government’s push toward efficient irrigation practices to improve crop productivity and farmer incomes. Drip irrigation adoption is particularly relevant in regions where water availability is seasonal, pumping costs are rising, and labor efficiency is becoming critical for plantation operators and progressive farmers.
Unlike traditional surface and flood irrigation methods, drip systems allow precise control over water application, fertilizer dosing (fertigation), and crop stress management. This precision aligns well with Indonesia’s gradual shift toward higher-value crops, export-oriented horticulture, and commercial plantation farming where yield consistency and input optimization directly impact profitability.
Java remains the largest demand center due to its concentration of horticulture farms, vegetable belts, and progressive smallholder adoption supported by local governments. Sumatra represents a structurally important market driven by plantation crops such as oil palm, rubber, coffee, and horticulture clusters. Eastern Indonesia, including parts of Nusa Tenggara and Sulawesi, shows rising potential due to water scarcity concerns, dryland farming conditions, and increasing government focus on irrigation infrastructure development. Kalimantan presents selective demand linked to plantation expansion and pilot modern farming projects, although adoption remains uneven due to infrastructure and awareness constraints.
What Factors are Leading to the Growth of the Indonesia Drip Irrigation Market
Rising pressure on water resources and the need for irrigation efficiency strengthen structural demand: Indonesia’s agriculture sector is increasingly affected by irregular rainfall, prolonged dry spells, and localized water stress, particularly in dryland and plantation regions. Traditional flood irrigation practices result in high water losses through evaporation, runoff, and deep percolation. Drip irrigation systems significantly reduce water consumption while maintaining or improving crop yields by delivering water precisely where it is needed. This efficiency advantage is becoming a key driver for adoption among both commercial plantations and progressive smallholders, especially in regions facing seasonal water shortages.
Expansion of horticulture and high-value crops accelerates adoption of precision irrigation: Indonesia is witnessing steady growth in fruits, vegetables, spices, floriculture, and protected cultivation aimed at domestic urban markets and export channels. These crops are highly sensitive to water stress and require consistent moisture management to achieve optimal yields and quality. Drip irrigation enables uniform crop growth, better nutrient uptake, and reduced disease incidence, making it a preferred solution for horticulture clusters, greenhouse operators, and contract farming models. As crop economics improve, farmers are more willing to invest in drip systems despite higher upfront costs compared to conventional methods.
Government programs and subsidy support improve affordability and awareness: Central and provincial governments in Indonesia promote efficient irrigation technologies as part of broader agricultural modernization and food security initiatives. Subsidies, demonstration projects, and support through farmer producer groups and cooperatives lower the effective cost of adoption and increase awareness of drip irrigation benefits. Public-sector involvement also helps build trust among small and marginal farmers, who traditionally perceive drip systems as complex or expensive. Over time, these programs contribute to gradual market expansion and normalization of micro-irrigation practices.
Which Industry Challenges Have Impacted the Growth of the Indonesia Drip Irrigation Market:
High upfront system costs and limited farmer affordability constrain large-scale adoption: While drip irrigation systems deliver long-term water savings, yield improvements, and input efficiency, the initial capital cost remains a significant barrier for many Indonesian farmers—particularly small and marginal landholders. Costs related to pipes, emitters, filters, fertigation units, pumps, and installation can be substantially higher than traditional flood or sprinkler irrigation methods. Even with subsidies, farmers often face cash-flow constraints, limited access to formal credit, and uncertainty around payback periods, especially for seasonal or rainfed crops. This financial hesitation delays adoption decisions and results in drip irrigation being concentrated primarily among commercial plantations, export-oriented horticulture growers, and progressive farmers rather than achieving broad-based penetration.
Limited technical knowledge, design capability, and after-sales support reduce system effectiveness: Drip irrigation performance is highly dependent on proper system design, crop-specific layout, water quality assessment, pressure management, and ongoing maintenance. In many parts of Indonesia, farmers lack access to trained technicians, agronomic advisory services, and reliable after-sales support. Poorly designed systems—such as incorrect emitter spacing, inadequate filtration, or improper fertigation practices—can lead to clogging, uneven water distribution, and suboptimal crop outcomes. These failures create negative perceptions of drip irrigation technology, reducing word-of-mouth adoption and increasing skepticism among neighboring farmers and cooperatives.
Water quality variability and infrastructure limitations increase operational risks: In several agricultural regions of Indonesia, irrigation water sources include surface canals, shallow groundwater, and seasonal reservoirs that often contain sediments, organic matter, or dissolved salts. Inadequate filtration and inconsistent water pressure can cause emitter clogging and system degradation, increasing maintenance requirements and downtime. Additionally, unreliable electricity supply in rural areas limits the effective use of automated or pressurized drip systems. These infrastructure and water-quality challenges increase operational complexity and deter farmers from transitioning away from traditional irrigation methods that are perceived as more forgiving and less maintenance-intensive.
What are the Regulations and Initiatives which have Governed the Market:
Government irrigation modernization programs promoting efficient water use and productivity improvement: Indonesia’s agricultural policy framework increasingly emphasizes water-use efficiency, climate resilience, and yield enhancement as part of national food security and rural development objectives. Drip irrigation systems are promoted through central and provincial government initiatives aimed at modernizing on-farm irrigation infrastructure, particularly for horticulture and plantation crops. These programs often include partial subsidies, pilot demonstrations, and distribution through farmer groups and cooperatives. While implementation effectiveness varies by region, such initiatives play a critical role in improving awareness, reducing perceived risk, and lowering the entry barrier for drip irrigation adoption.
Subsidy mechanisms and farmer group–based procurement influencing adoption dynamics: Drip irrigation deployment in Indonesia is frequently linked to subsidy schemes administered through agricultural departments, local governments, and farmer producer organizations. These schemes influence system specifications, supplier selection, and installation timelines. In many cases, standardized system packages are procured in bulk to reduce costs, which helps accelerate adoption but may limit customization for specific crop or soil conditions. Administrative processes, documentation requirements, and budget release cycles can also affect the timing and scale of installations, shaping year-to-year market volatility.
Water resource management policies and sustainability initiatives shaping long-term demand: Broader water management regulations and sustainability initiatives—including groundwater usage controls, watershed management programs, and climate adaptation strategies—indirectly support the adoption of micro-irrigation technologies such as drip systems. As policymakers seek to reduce water wastage and improve irrigation efficiency, drip irrigation aligns well with long-term regulatory objectives. Although enforcement and monitoring remain uneven, these policy directions create a favorable long-term environment for precision irrigation solutions, particularly in water-stressed and dryland farming regions.
Indonesia Drip Irrigation Market Segmentation
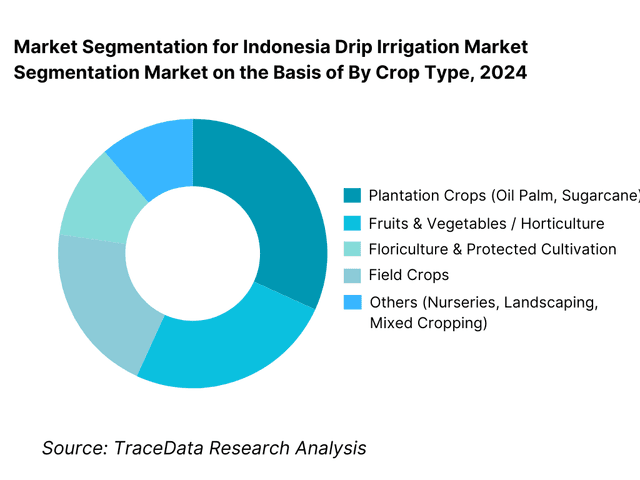
By Crop Type: Plantation crops and horticulture account for the dominant share of drip irrigation deployment in Indonesia. Plantation crops such as oil palm, sugarcane, coffee, cocoa, and rubber increasingly adopt drip systems to improve water-use efficiency, reduce labor intensity, and stabilize yields across large contiguous land parcels. Horticulture—including fruits, vegetables, floriculture, and protected cultivation—drives higher system value per hectare due to denser layouts, fertigation requirements, and greater sensitivity to moisture stress. Field crops continue to see limited penetration due to lower margins and reliance on traditional irrigation practices, although pilot adoption is emerging in water-stressed regions.
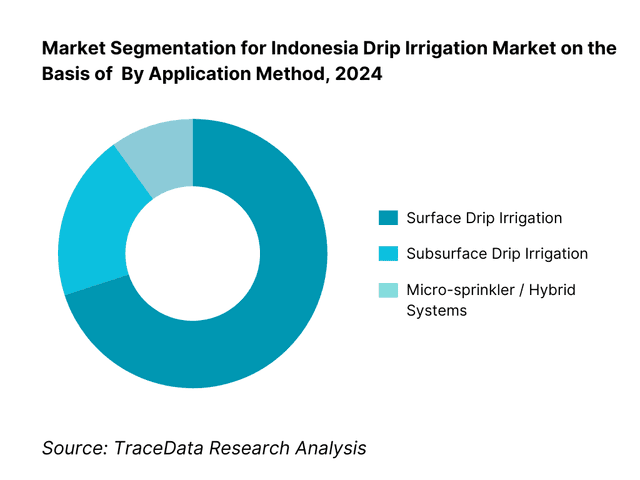
By Application Method: Surface drip irrigation dominates the Indonesian market due to its relatively lower installation cost, ease of maintenance, and suitability for smallholder as well as plantation-scale farming. Subsurface drip irrigation remains limited to specific plantation and high-value crop applications where long-term water efficiency gains justify higher capital expenditure. Micro-sprinkler systems are selectively used in orchards, nurseries, and plantation crops where partial canopy wetting is preferred.
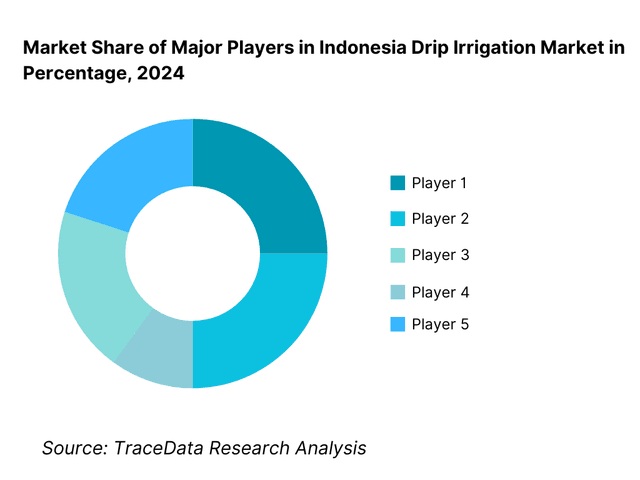
Competitive Landscape in Indonesia Drip Irrigation Market
The Indonesia drip irrigation market is moderately fragmented, characterized by the presence of international micro-irrigation technology providers, regional Asian manufacturers, domestic system integrators, and a large base of local distributors and installers. Competitive intensity is shaped by system pricing, subsidy eligibility, distribution reach, installation capability, and the availability of agronomic and after-sales support.
International players tend to dominate large plantation and export-oriented horticulture projects where system reliability, engineering support, and long-term performance are critical. Local and regional players remain competitive in smallholder and subsidy-driven projects by offering lower-cost solutions, simplified system designs, and proximity to farmer groups. Market positioning is strongly influenced by relationships with government agencies, cooperatives, and plantation operators, rather than purely by brand visibility.
Name | Founding Year | Original Headquarters |
Netafim | 1965 | Israel |
Jain Irrigation Systems | 1986 | Jalgaon, India |
Rivulis Irrigation | 1966 | Israel |
Toro Micro-Irrigation | 1914 | Minnesota, USA |
Metzer Group | 1970 | Israel |
Nusantara-based Local Integrators | ~2000s | Indonesia |
Regional Chinese & Southeast Asian Manufacturers | ~2000s | China / ASEAN |
Some of the Recent Competitor Trends and Key Information About Competitors Include:
Netafim: Netafim remains one of the most prominent global players in the Indonesian drip irrigation landscape, particularly in large plantation and high-value horticulture projects. The company’s competitive advantage lies in advanced emitter technology, strong agronomic expertise, and the ability to design crop-specific irrigation and fertigation solutions. Netafim is often preferred in projects where long-term yield optimization, water efficiency, and system durability are prioritized over upfront cost considerations.
Jain Irrigation Systems: Jain Irrigation competes strongly in Indonesia by offering a broad product portfolio across pipes, emitters, fertigation units, and turnkey solutions. The company is well positioned in subsidy-linked and medium-scale projects due to its experience in working with government programs and farmer groups across emerging markets. Competitive pricing, integrated manufacturing capabilities, and familiarity with smallholder adoption dynamics support its market presence.
Rivulis Irrigation: Rivulis focuses on delivering cost-effective yet technically robust drip irrigation systems suited for both plantation and horticulture applications. The company’s positioning emphasizes balance between performance and affordability, making it attractive for mid-sized commercial farms and projects transitioning from pilot to scaled deployment.
Toro Micro-Irrigation: Toro’s presence is more selective, with strength in specialized applications such as orchards, nurseries, and controlled-environment agriculture. The company competes on system reliability, precision control, and compatibility with automation, serving niche segments rather than mass smallholder deployment.
Local System Integrators and Regional Manufacturers: Domestic integrators and regional Asian manufacturers play a critical role in expanding market reach across Indonesia’s fragmented agricultural landscape. These players compete primarily on price, local availability, and responsiveness, often customizing systems to local water quality, crop practices, and budget constraints. While technical depth varies, strong relationships with cooperatives and local governments enable these firms to capture a meaningful share of subsidy-driven demand.
What Lies Ahead for Indonesia Drip Irrigation Market?
The Indonesia drip irrigation market is expected to expand steadily by 2035, supported by long-term pressure on water resources, increasing climate variability, and the gradual shift toward efficient, productivity-driven agricultural practices. Growth momentum is further reinforced by government-led irrigation modernization initiatives, expansion of plantation and horticulture crops, and rising awareness among farmers of the economic benefits of precision irrigation. As agricultural stakeholders increasingly prioritize yield stability, input optimization, and water-use efficiency, drip irrigation is expected to transition from a niche solution toward a more mainstream irrigation method across select crop categories and regions.
Transition Toward Crop-Specific and Application-Optimized Drip Irrigation Systems: The future of the Indonesia drip irrigation market will see a shift from generic system installations toward crop-specific and purpose-designed irrigation configurations. Plantation crops, horticulture clusters, and protected cultivation increasingly require tailored emitter spacing, flow rates, fertigation integration, and pressure management aligned with crop physiology and soil conditions. Suppliers that move beyond standardized kits and offer customized designs based on crop type, climate zone, and water quality will capture higher-value demand and build stronger long-term relationships with commercial farms and plantations.
Growing Emphasis on Water Efficiency, Yield Stability, and Climate Resilience: As rainfall patterns become more unpredictable and dry spells more frequent, drip irrigation will play a critical role in improving crop resilience and reducing dependence on seasonal precipitation. Farmers and plantation operators are expected to increasingly view drip systems not only as a water-saving tool but as a risk-mitigation investment that stabilizes yields and income. This shift in perception will support adoption in water-stressed regions and dryland farming zones, particularly where traditional flood irrigation is no longer reliable or economically viable.
Integration of Fertigation, Automation, and Basic Digital Monitoring Solutions: The next phase of market development will involve deeper integration of fertigation systems and gradual adoption of automation and monitoring technologies. While advanced digital agriculture remains nascent in Indonesia, commercial farms and export-oriented growers are increasingly interested in solutions that enable precise nutrient delivery, pressure monitoring, and basic scheduling control. Drip irrigation systems that are compatible with low-cost automation and simple monitoring tools will gain traction as farmers seek incremental efficiency gains without significantly increasing system complexity or cost.
Indonesia Drip Irrigation Market Segmentation
By Crop Type
- Plantation Crops (Oil Palm, Sugarcane, Coffee, Cocoa, Rubber)
- Fruits & Vegetables
- Floriculture & Protected Cultivation
- Field Crops
- Nurseries, Landscaping & Others
By Application Method
- Surface Drip Irrigation Systems
- Subsurface Drip Irrigation Systems
- Micro-Sprinkler / Hybrid Irrigation Systems
By System Component
- Emitters & Drippers
- Laterals, Sub-Mains & Pipes
- Filters & Valves
- Fertigation Units
- Pumps & Control Systems
By Farm Size
- Large Plantations & Commercial Farms
- Medium-Sized Farms
- Small & Marginal Farmers
By Region
- Java
- Sumatra
- Kalimantan
- Sulawesi
- Eastern Indonesia
- Others
Players Mentioned in the Report:
- Netafim
- Jain Irrigation Systems
- Rivulis Irrigation
- Toro Micro-Irrigation
- Metzer Group
- Local Indonesian drip irrigation system integrators
- Regional Asian micro-irrigation manufacturers and distributors
Key Target Audience
- Drip irrigation system manufacturers and component suppliers
- Agricultural input distributors and irrigation installers
- Large plantation operators and agribusiness companies
- Horticulture and protected cultivation growers
- Farmer producer groups, cooperatives, and associations
- Government bodies and agricultural departments
- Development agencies and rural infrastructure programs
- Agri-focused private equity and impact investors
Time Period:
Historical Period: 2019–2024
Base Year: 2025
Forecast Period: 2025–2035
Explore Flexible Purchase Options or Have Limited Budget?
Pay only for relevant chapters • Customizable report sections
Table of Contents
Choose individual sections to purchase. Mix and match as you like.
4. 1 Delivery Model Analysis for Drip Irrigation Solutions-Turnkey Projects, Component Sales, Dealer-Installed Systems, Subsidy-Linked Programs [Margins, Preference, Strength & Weakness]
4. 2 Revenue Streams for Indonesia Drip Irrigation Market [System Sales, Installation Services, Maintenance & AMC, Fertigation Solutions, Spare Parts]
4. 3 Business Model Canvas for Indonesia Drip Irrigation Market [Key Partners, Key Activities, Value Propositions, Customer Segments, Cost Structure, Revenue Streams]
5. 1 Local Players vs Global Vendors [Local Integrators vs Netafim/Jain Irrigation etc.]
5. 2 Investment Model in Indonesia Drip Irrigation Market [Government Subsidies, Development Programs, Private Investment, Corporate Farming Initiatives]
5. 3 Comparative Analysis of Drip Irrigation Adoption in Smallholder vs Commercial Farming [Procurement Models, Use Cases, ROI Benchmarks]
5. 4 Irrigation Investment Allocation by Farm Size [Large Plantations, Medium Farms, Small & Marginal Farmers]
8. 1 Revenues (Historical Trend)
9. 1 By Market Structure (Subsidy-Led Adoption vs Commercial/Private Investment)
9. 2 By Technology (Surface Drip, Subsurface Drip, Micro-Sprinkler Systems)
9. 3 By Crop Type (Plantation Crops, Fruits & Vegetables, Floriculture, Field Crops)
9. 4 By Farm Size (Large Plantations, Medium Farms, Small & Marginal Farmers)
9. 5 By Application/Function (Irrigation, Fertigation, Water Conservation, Yield Optimization)
9. 6 By System Configuration (Gravity-Fed, Pump-Based, Automated Systems)
9. 7 By Standardized vs Customized Irrigation Solutions
9. 8 By Region (Java, Sumatra, Kalimantan, Sulawesi, Eastern Indonesia)
10. 1 Farmer, Plantation & Agribusiness Landscape and Cohort Analysis
10. 2 Drip Irrigation Adoption Drivers & Decision-Making Process
10. 3 Drip Irrigation Effectiveness & ROI Analysis
10. 4 Gap Analysis Framework
Industry Analysis
11. 1 Trends & Developments in Indonesia Drip Irrigation Market
11. 2 Growth Drivers for Indonesia Drip Irrigation Market
11. 3 SWOT Analysis for Indonesia Drip Irrigation Market
11. 4 Issues & Challenges for Indonesia Drip Irrigation Market
11. 5 Government Regulations for Indonesia Drip Irrigation Market
12. 1 Market Size and Future Potential for Subsidized Drip Irrigation in Indonesia
12. 2 Business Models & Revenue Streams [Subsidy Programs, Turnkey Projects, Service Contracts]
12. 3 Delivery Models & Drip Irrigation Solutions Offered [Surface Systems, Fertigation Units, Automated Controls]
15. 1 Market Share of Key Players in Indonesia Drip Irrigation Market (By Revenues)
15. 2 Benchmark of Key Competitors [Company Overview, USP, Business Strategies, Business Model, Manufacturing Capacity, Revenues, Pricing Models, Technology Used, Best-Selling Irrigation Systems, Major Clients, Strategic Tie-ups, Marketing Strategy, Recent Developments]
15. 3 Operating Model Analysis Framework
15. 4 Gartner Magic Quadrant for Irrigation Technology Providers
15. 5 Bowman’s Strategic Clock for Competitive Advantage
16. 1 Revenues (Projections)
17. 1 By Market Structure (Subsidy-Driven and Commercial Adoption)
17. 2 By Technology (Surface Drip, Subsurface Drip, Micro-Sprinkler)
17. 3 By Crop Type (Plantation, Horticulture, Floriculture, Field Crops)
17. 4 By Farm Size (Large, Medium, Small & Marginal Farmers)
17. 5 By Application/Function (Irrigation, Fertigation, Water Efficiency, Yield Improvement)
17. 6 By System Configuration (Pump-Based, Gravity-Based, Automated)
17. 7 By Standardized vs Customized Programs
17. 8 By Region (Java, Sumatra, Kalimantan, Sulawesi, Eastern Indonesia)
Discuss a Customized Research Scope
Custom research scope • Tailored insights • Industry expertise
Research Methodology
Step 1: Ecosystem Creation
We begin by mapping the complete ecosystem of the Indonesia Drip Irrigation Market across demand-side and supply-side entities. On the demand side, entities include large plantation operators (oil palm, sugarcane, rubber, coffee, cocoa), horticulture and vegetable growers, floriculture farms, protected cultivation operators, medium-scale commercial farms, small and marginal farmers, farmer producer groups and cooperatives, and government-supported agricultural clusters. Demand is further segmented by crop type, farm size, irrigation application method (surface drip, subsurface drip, micro-sprinkler), and adoption driver (yield improvement, water efficiency, labor optimization, subsidy-led adoption).
On the supply side, the ecosystem includes global drip irrigation manufacturers, regional Asian micro-irrigation suppliers, domestic system integrators, pipe and emitter manufacturers, filtration and fertigation equipment suppliers, pump providers, distributors and installers, agronomic advisory service providers, and government agencies administering subsidy and irrigation modernization programs. From this mapped ecosystem, we shortlist leading international and regional drip irrigation players along with representative local integrators based on product portfolio, pricing competitiveness, geographic reach, installation capability, and presence in plantation and horticulture segments. This step establishes how value is created and captured across system design, component supply, installation, training, and after-sales service.
Step 2: Desk Research
An exhaustive desk research process is undertaken to analyze the Indonesia drip irrigation market structure, adoption drivers, and segment behavior. This includes reviewing agricultural production patterns, crop-wise irrigation practices, water availability trends, climate variability, plantation expansion plans, and government initiatives related to irrigation efficiency and farm productivity. We assess farmer and plantation-level decision-making around cost-benefit trade-offs, payback expectations, subsidy dependence, and perceived operational risks.
Company-level analysis includes review of drip irrigation product offerings, system configurations, pricing benchmarks, distribution models, and service support structures. We also examine policy frameworks governing irrigation infrastructure, subsidy mechanisms, and water resource management across key agricultural regions. The outcome of this stage is a comprehensive industry foundation that defines the segmentation logic and establishes the assumptions required for market sizing, penetration analysis, and future outlook modeling.
Step 3: Primary Research
We conduct structured interviews with drip irrigation manufacturers, regional distributors, local system integrators, agronomists, plantation managers, horticulture growers, and representatives of farmer groups and cooperatives. The objectives are threefold: (a) validate assumptions around adoption barriers, subsidy impact, and demand concentration by crop and region, (b) authenticate segment splits by crop type, farm size, and application method, and (c) gather qualitative insights on system pricing, installation challenges, maintenance practices, and farmer satisfaction levels.
A bottom-to-top approach is applied by estimating irrigated area under drip systems across key crop segments and regions, combined with average system cost per hectare. These estimates are aggregated to develop the overall market view. In selected cases, disguised buyer-style interactions are conducted with distributors and installers to validate on-ground realities such as installation timelines, service responsiveness, water quality challenges, and common system performance issues faced by end users.
Step 4: Sanity Check
The final stage integrates bottom-to-top and top-to-down approaches to cross-validate market size estimates, segmentation splits, and forecast assumptions. Demand estimates are reconciled with macro indicators such as agricultural output trends, plantation expansion rates, irrigation infrastructure investments, and subsidy budget allocations. Assumptions related to water stress intensity, farmer affordability, subsidy continuity, and technology learning curves are stress-tested to assess their impact on adoption trajectories. Sensitivity analysis is conducted across key variables including crop price realization, water availability, subsidy coverage, and system cost reductions. Market models are refined until alignment is achieved between supplier capacity, installation throughput, and realistic adoption potential, ensuring internal consistency and robust directional forecasting through 2035.
See What's Inside the Report
Get a preview of key findings, methodology and report coverage
Frequently Asked Questions
The Indonesia drip irrigation market holds steady long-term potential, supported by increasing pressure on water resources, growing climate variability, and the gradual shift toward productivity-driven agriculture. Expansion of plantation crops, horticulture, and protected cultivation creates structurally favorable conditions for drip irrigation adoption. While penetration among smallholders remains subsidy-dependent, commercial farms and plantations are expected to drive sustained growth through 2035 as water efficiency and yield stability become strategic priorities.
The market features a mix of global drip irrigation technology providers, regional Asian manufacturers, and domestic system integrators. Competition is shaped by system reliability, pricing, availability of subsidy-compliant solutions, installation capability, and after-sales support. International players tend to dominate large plantation and high-value crop projects, while local integrators play a critical role in smallholder and cooperative-led adoption.
Key growth drivers include rising water scarcity concerns, expansion of horticulture and plantation farming, government-led irrigation modernization programs, and increasing awareness of input efficiency and yield improvement benefits. Labor optimization and fertigation capability further strengthen the business case for drip irrigation, particularly among commercial farms and agribusiness operators.
Challenges include high upfront system costs, limited technical knowledge among farmers, inconsistent after-sales support in remote regions, and water quality issues that affect system performance. Adoption among small and marginal farmers remains heavily dependent on subsidies and government programs. Addressing these challenges will require stronger service networks, farmer training initiatives, and cost-effective system designs tailored to local conditions.
License Options
PDF + Excel
Complete report package
$4,000
Excel Only
Data and analytics
$2,500
Custom Sections
Starts from $100
$0