Indonesia Geothermal Energy Market Outlook to 2029
By Market Structure, By Installed Capacity, By Energy Output, By Key Regions, By End-User Segments, and By Key Players
Report Overview
Report Code
TDR0090
Coverage
Asia
Published
December 2024
Pages
80-100
Flexible Purchase Options
Select and purchase only the chapters you need for your strategic decisions
On This Page
Report Overview
The report titled “Indonesia Geothermal Energy Market Outlook to 2029 - By Market Structure, By Installed Capacity, By Energy Output, By Key Regions, By End-User Segments, and By Key Players” provides a comprehensive analysis of the geothermal energy market in Indonesia. The report covers an overview and genesis of the industry, the overall market size in terms of installed capacity and revenue, market segmentation; trends and developments, regulatory landscape, project-level profiling, issues and challenges, and competitive landscape including major players, opportunities, and barriers.
Report Coverage
Verified Market Sizing
Multi-layer forecasting with historical data and 5–10 year outlook
Deep-Dive Segmentation
Cross-sectional analysis by product type, end user, application and region
Competitive Benchmarking & Positioning
Market share, operating model, pricing and competition matrices
Actionable Insights & Risk Assessment
High-growth white spaces, underserved segments, technology disruptions and demand inflection points
Review Methodology & Data Structure
Preview report structure, data sources and research framework
Executive Summary
The report titled “Indonesia Geothermal Energy Market Outlook to 2029 - By Market Structure, By Installed Capacity, By Energy Output, By Key Regions, By End-User Segments, and By Key Players” provides a comprehensive analysis of the geothermal energy market in Indonesia. The report covers an overview and genesis of the industry, the overall market size in terms of installed capacity and revenue, market segmentation; trends and developments, regulatory landscape, project-level profiling, issues and challenges, and competitive landscape including major players, opportunities, and barriers. The report concludes with future market projections based on installed capacity, energy output, end-user segments, and success case studies highlighting major opportunities and cautions in the market.
Indonesia Geothermal Energy Market Overview and Size
The Indonesia geothermal energy market reached an installed capacity of 2,500 MW in 2023, driven by the abundant availability of geothermal resources, growing demand for renewable energy, and supportive government policies promoting clean energy solutions. The market is characterized by major players such as Pertamina Geothermal Energy, Star Energy, Medco Energi, and Ormat Technologies. These companies are recognized for their robust project portfolios, advanced technology implementation, and significant contributions to Indonesia's renewable energy transition.
In 2023, Pertamina Geothermal Energy commissioned new capacity in the Lahendong and Ulubelu geothermal fields to enhance energy output and address the increasing demand for sustainable energy. This expansion supports Indonesia's target of achieving 23% renewable energy in the national energy mix by 2025. Key regions such as Java and Sumatra dominate the geothermal market due to their high-quality geothermal reserves and developed infrastructure, while areas like Sulawesi and Flores are emerging as potential growth zones.
Market Size for Indonesia Geothermal Energy Market on the Basis of Installed Capacity in MW, 2018–2024

What Factors are Leading to the Growth of Indonesia Geothermal Energy Market:
Resource Availability: Indonesia possesses an estimated geothermal potential of 24 GW, with only 10% of this potential being utilized as of 2023. The vast availability of untapped resources positions the country as a global leader in geothermal energy development. High-temperature geothermal fields, located across Java, Sumatra, and Sulawesi, present significant opportunities for new project development.
Government Initiatives: Supportive government policies and incentives, such as the feed-in tariff and renewable energy roadmap, have played a crucial role in market expansion. The Indonesian government targets 23% renewable energy in the energy mix by 2025, with geothermal energy contributing a significant share. The establishment of public-private partnerships (PPPs) has also facilitated funding for large-scale geothermal projects.
Rising Energy Demand: With an annual energy demand growth rate of 6%, Indonesia faces increasing pressure to diversify its energy portfolio. Geothermal energy offers a reliable and sustainable solution, particularly in remote and off-grid areas where traditional energy sources are less viable.
Which Industry Challenges Have Impacted the Growth of Indonesia Geothermal Energy Market
High Initial Investment Costs: The development of geothermal energy projects requires significant upfront capital investment for exploration, drilling, and infrastructure. On average, exploration and drilling account for approximately 40% of total project costs. This financial burden has deterred private sector participation, limiting the pace of market expansion.
Regulatory and Permitting Delays: Complex regulatory frameworks and lengthy permitting processes remain a major challenge for project developers. In 2023, it was reported that the average time to secure permits for geothermal projects in Indonesia was over three years, causing delays and increasing project costs. Streamlining these processes is critical to attracting more investment into the sector.
Technical and Resource Risks: Uncertainties related to geothermal resource availability and potential drilling failures pose significant risks. Industry reports indicate that up to 20% of exploration wells drilled in Indonesia yield suboptimal results, leading to increased costs and delays. This risk factor discourages investors, particularly in high-potential but underdeveloped regions.
What are the Regulations and Initiatives that Have Governed the Market
Feed-in Tariff Mechanism: The Indonesian government introduced a feed-in tariff scheme in 2023 to incentivize geothermal energy development. This mechanism ensures competitive pricing for geothermal electricity, encouraging private sector investment. The tariff rates are adjusted based on project location and resource capacity, providing tailored support for different regions.
Renewable Energy Targets: Indonesia’s renewable energy roadmap mandates a 23% share of renewables in the national energy mix by 2025, with geothermal energy expected to contribute a significant portion. This target has driven government efforts to facilitate project development and streamline regulations.
Geothermal Fund Facility: To address the high upfront costs of geothermal projects, the government established the Geothermal Fund Facility (GFF), which provides risk mitigation support and financing for exploration activities. As of 2023, the GFF has supported over 15 projects, reducing exploration risks and attracting private investors.
Indonesia Geothermal Energy Market Segmentation
By Market Structure: The geothermal energy market in Indonesia is dominated by private developers, who have been pivotal in advancing new projects and introducing innovative technologies. These developers often partner with government entities to secure funding and permits. State-owned enterprises, such as Pertamina Geothermal Energy, also hold a significant share due to their access to government resources, established expertise in energy development, and focus on large-scale projects. Their ability to develop extensive geothermal fields, such as Wayang Windu and Sarulla, underscores their importance in the market.
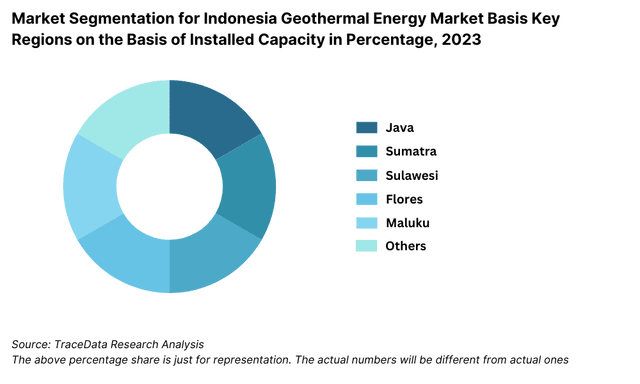
By Key Regions: Java leads the geothermal market due to its high population density, energy demand, and well-established infrastructure. The island accounts for over 60% of Indonesia's total geothermal capacity. Sumatra follows as a key region due to its significant geothermal reserves and increasing industrial activity. Emerging regions such as Sulawesi and Flores are gaining traction with ongoing exploratory projects and government initiatives targeting untapped geothermal potential.
By End-User Segments: Industrial users constitute the largest segment due to their high energy requirements and preference for cost-effective, sustainable energy sources. Geothermal energy is increasingly adopted by industries such as manufacturing, mining, and processing due to its reliability and low carbon emissions. Residential and commercial sectors also contribute significantly, driven by urbanization and a growing focus on clean energy solutions.
Competitive Landscape in Indonesia Geothermal Energy Market
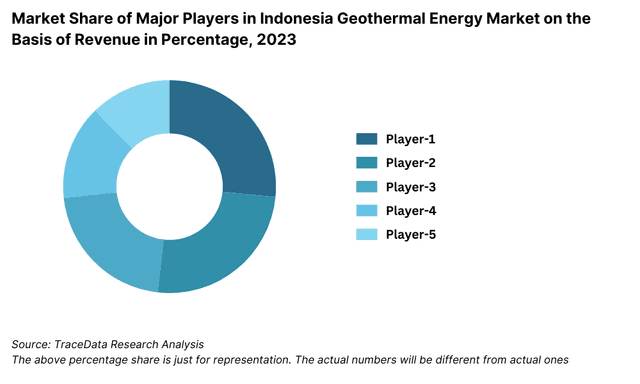
The Indonesia geothermal energy market is relatively concentrated, with a few major players driving development across the country. These companies, including Pertamina Geothermal Energy, Star Energy, Medco Energi, and Ormat Technologies, dominate the sector due to their expertise, resources, and ability to manage large-scale projects. Emerging players and partnerships are adding diversity, bringing innovation and competition to the market.
Company Name | Establishment Year | Headquarters |
|---|---|---|
PT Pertamina Geothermal Energy | 2006 | Jakarta, Indonesia |
Star Energy Geothermal | 2003 | Jakarta, Indonesia |
PT Geo Dipa Energi | 2002 | Jakarta, Indonesia |
Sarulla Operations Ltd. | 2006 | Jakarta, Indonesia |
Supreme Energy | 2007 | Jakarta, Indonesia |
PT PLN (Persero) | 1945 | Jakarta, Indonesia |
Medco Power Indonesia | 2004 | Jakarta, Indonesia |
Ormat Technologies Inc. | 1965 | Reno, Nevada, USA |
KS Orka Renewables Pte Ltd | 2016 | Singapore |
PT Sokoria Geothermal Indonesia | 2013 | Jakarta, Indonesia |
Some of the recent competitor trends and key information about competitors include:
Pertamina Geothermal Energy (PGE): PGE remains a dominant player, operating 14 geothermal working areas across Indonesia. In 2023, the company added 120 MW of capacity in the Ulubelu and Lahendong fields, contributing to its total installed capacity of over 1,877 MW. PGE’s focus on sustainability and community engagement has reinforced its market leadership.
Star Energy: As the largest private geothermal operator in Indonesia, Star Energy manages significant projects such as Wayang Windu and Darajat. In 2023, the company reported a 10% increase in power generation efficiency through the adoption of enhanced geothermal system (EGS) technologies.
Medco Energi: Medco Energi is expanding its geothermal portfolio with the recent commissioning of the Sarulla Geothermal Power Plant Phase III, bringing its total capacity to 330 MW. The company focuses on leveraging local expertise and building long-term partnerships with global technology providers.
Ormat Technologies: Ormat is a global leader in geothermal technology and has partnered with local developers to provide modular power plants and advanced drilling technologies. In 2023, Ormat announced a joint venture with Supreme Energy to explore untapped geothermal fields in Sulawesi, aiming to add 200 MW by 2027.
Supreme Energy: A relatively new entrant, Supreme Energy specializes in developing projects in high-potential but underdeveloped regions like Sumatra and Flores. The company commissioned its first 80 MW project in Muara Laboh in 2023, emphasizing sustainable development and environmental protection.
What Lies Ahead for Indonesia Geothermal Energy Market?
The Indonesia geothermal energy market is projected to grow significantly by 2029, with a robust CAGR during the forecast period. This growth will be driven by increasing energy demand, government incentives, and the global shift towards renewable energy sources.
Expansion of Installed Capacity: Indonesia aims to increase its geothermal installed capacity from 2,500 MW in 2023 to 4,500 MW by 2029, supported by large-scale projects in Java, Sumatra, and Sulawesi. The government’s renewable energy targets and international partnerships will play a key role in achieving this expansion.
Adoption of Advanced Technologies: The deployment of Enhanced Geothermal Systems (EGS), modular power plants, and advanced drilling techniques is expected to reduce project risks and costs. These technologies will enable efficient utilization of geothermal resources in untapped areas, particularly in remote regions like Flores and Sulawesi.
Public-Private Partnerships (PPPs): The government’s focus on fostering PPPs will attract both domestic and foreign investments, accelerating project development timelines. These partnerships are anticipated to bring in technological expertise and funding, addressing critical challenges such as high upfront costs and resource risks.
Regional Development Focus: Regions like Flores, Sulawesi, and Maluku, currently underdeveloped in terms of geothermal capacity, are expected to emerge as new growth hubs. Strategic investments in transmission infrastructure and localized energy solutions will unlock the geothermal potential in these regions.
Future Outlook and Projections for Indonesia Geothermal Energy Market on the Basis of Revenues in USD Billion, 2024-2029


Indonesia Geothermal Energy Market Segmentation
• By Market Structure:
State-Owned Enterprises
Private Developers
Public-Private Partnerships
Independent Power Producers (IPPs)
• By Installed Capacity Range:
<50 MW
50–100 MW
100–300 MW
300 MW
• By Energy Output:
Industrial Sector
Residential Sector
Commercial Sector
Off-Grid Solutions
• By Regions:
Java
Sumatra
Sulawesi
Flores
Maluku
• By Technology Type:
Flash Steam Power Plants
Dry Steam Power Plants
Binary Cycle Power Plants
Enhanced Geothermal Systems (EGS)
• By End-User Segments:
Industrial Users
Commercial Establishments
Rural and Off-Grid Consumers
Government and Utilities
Players Mentioned in the Report:
PT Pertamina Geothermal Energy
Star Energy Geothermal
PT Geo Dipa Energi
Sarulla Operations Ltd.
Supreme Energy
PT PLN (Persero)
Medco Power Indonesia
Ormat Technologies Inc.
KS Orka Renewables Pte Ltd
PT Sokoria Geothermal Indonesia
Key Target Audience:
Geothermal Energy Developers
Renewable Energy Investors
Equipment Manufacturers and Suppliers
Regulatory Bodies (e.g., Ministry of Energy and Mineral Resources)
Research and Development Institutions
Time Period:
Historical Period: 2018-2023
Base Year: 2024
Forecast Period: 2024-2029
Explore Flexible Purchase Options or Have Limited Budget?
Pay only for relevant chapters • Customizable report sections
Table of Contents
Choose individual sections to purchase. Mix and match as you like.
4.1. Value Chain Process-Role of Entities, Stakeholders, and Challenges They Face
4.2. Revenue Streams for Indonesia Geothermal Energy Market
4.3. Business Model Canvas for Indonesia Geothermal Energy Market
4.4. Project Development and Financing Decision-Making Process
5.1. Geothermal Energy Installed Capacity in Indonesia, 2018-2024
5.2. Role of State-Owned Enterprises and Private Developers in the Market
5.3. Investment Trends in Geothermal Projects, 2023-2024
5.4. Distribution of Geothermal Fields by Region in Indonesia
8.1. Installed Capacity, 2018-2024
8.2. Energy Output, 2018-2024
8.3. Revenue, 2018-2024
9.1. By Market Structure (Public and Private Developers), 2023-2024P
9.2. By Regions (Java, Sumatra, Sulawesi, Flores, and Maluku), 2023-2024P
9.3. By Installed Capacity Range (<50 MW, 50-“100 MW, 100-“300 MW, >300 MW), 2023-2024P
9.4. By Technology Type (Flash Steam, Binary Cycle, Dry Steam, and Enhanced Geothermal Systems), 2023-2024P
9.5. By End-User Segments (Industrial, Residential, Commercial, and Rural Consumers), 2023-2024P
10.1. Consumer and Industrial Landscape Analysis
10.2. Decision-Making Process for Energy Procurement
10.3. Needs, Desires, and Barriers to Adoption
10.4. Gap Analysis Framework
11.1. Trends and Developments for Indonesia Geothermal Energy Market
11.2. Growth Drivers for Indonesia Geothermal Energy Market
11.3. SWOT Analysis for Indonesia Geothermal Energy Market
11.4. Issues and Challenges for Indonesia Geothermal Energy Market
11.5. Government Regulations for Indonesia Geothermal Energy Market
12.1. Current Status of Exploratory and Operational Projects, 2018-2029
12.2. Business Model and Revenue Streams for New Projects
12.3. Cross Comparison of Key Geothermal Fields in Indonesia (Sarulla, Wayang Windu, Darajat and others) across Operational and Financial Variables
13.1. Financing Trends and Models for Geothermal Projects, 2018-2029
13.2. Government Incentives and Private Sector Participation
13.3. Financing Splits by Domestic and International Sources, 2023-2024P
13.4. Tenure and Risk Mitigation for Geothermal Financing
13.5. Capital Flow into Geothermal Energy in Indonesia, 2018-2024P
16.1. Market Share of Key EPC Companies in Indonesia Geothermal Energy Market, 2023-2024P
16.2. Benchmark of Key Competitors in Indonesia Geothermal Energy Market including across Operational and Financial Variables
16.3. Strength and Weakness Analysis
16.4. Operating Model Analysis Framework
16.5. Gartner Magic Quadrant for Market Positioning
16.6. Bowmans Strategic Clock for Competitive Advantage
17.1. Installed Capacity, 2025-2029
17.2. Energy Output, 2025-2029
17.3. Revenue Projections, 2025-2029
18.1. By Market Structure (Public and Private Developers), 2025-2029
18.2. By Regions (Java, Sumatra, Sulawesi, Flores, and Maluku), 2025-2029
18.3. By Installed Capacity Range (<50 MW, 50-“100 MW, 100-“300 MW, >300 MW), 2025-2029
18.4. By Technology Type (Flash Steam, Binary Cycle, Dry Steam, and Enhanced Geothermal Systems), 2025-2029
18.5. By End-User Segments (Industrial, Residential, Commercial, and Rural Consumers), 2025-2029
18.6. Recommendation
18.7. Opportunity Analysis
Discuss a Customized Research Scope
Custom research scope • Tailored insights • Industry expertise
Research Methodology
Step 1: Ecosystem Creation
Map the Ecosystem: Identify all demand-side and supply-side entities within the Indonesia Geothermal Energy Market. This includes developers, technology providers, government agencies, and end-users. Based on this ecosystem, we shortlist 5–6 key players in the market, focusing on factors such as installed capacity, project portfolio, and financial performance.
Source Data: Use industry reports, government publications, and proprietary databases to perform desk research. This helps in collecting foundational market information, including resource availability, project status, and market dynamics.
Step 2: Desk Research
Comprehensive Analysis: Conduct an exhaustive desk research process by leveraging secondary and proprietary databases. Explore aspects such as installed capacity, market segmentation, key players, pricing trends, and regulatory frameworks.
Company-Level Data: Gather insights from press releases, annual reports, project announcements, and financial statements of market players. This helps build a detailed understanding of both market and company-level dynamics.
Step 3: Primary Research
In-Depth Interviews: Engage in interviews with key stakeholders, including developers, regulators, and industry experts. These interactions are critical for validating hypotheses, ensuring statistical accuracy, and extracting operational insights.
Validation Strategy: Perform disguised interviews with market participants under the guise of potential partners or stakeholders to cross-verify shared data with secondary sources. This ensures accuracy in operational details, revenue streams, and market structure.
Step 4: Sanity Check
- Market Modeling: Conduct top-to-bottom and bottom-to-top market modeling exercises. Cross-validate findings from desk and primary research to ensure coherence in data and projections.
See What's Inside the Report
Get a preview of key findings, methodology and report coverage
Frequently Asked Questions
The Indonesia geothermal energy market is poised for significant growth, with installed capacity projected to increase from 2,500 MW in 2023 to 4,500 MW by 2029. This growth is driven by abundant geothermal resources, supportive government policies, and increasing demand for renewable energy.
Key players include Pertamina Geothermal Energy, Star Energy, Medco Energi, and Ormat Technologies. These companies dominate the market through their expertise, large-scale projects, and innovative technologies. Emerging players like Supreme Energy also contribute to the market's growth.
The market's growth is fueled by Indonesia's commitment to renewable energy targets, abundant geothermal resources, and technological advancements in geothermal power generation. Government incentives, such as feed-in tariffs and risk mitigation funds, further encourage investment in this sector.
The market faces challenges such as high upfront capital costs, regulatory complexities, and infrastructure limitations in remote areas. Additionally, technical risks during exploration and drilling can lead to delays and cost overruns, posing significant hurdles for developers.
License Options
PDF + Excel
Complete report package
$4,000
Excel Only
Data and analytics
$2,500
Custom Sections
Starts from $100
$0