Indonesia Nitrogenous Fertilizer Market Outlook to 2035
By Product Type, By Crop Type, By Application Method, By Distribution Channel, and By Region
Report Overview
Report Code
TDR0437
Coverage
Asia
Published
January 2026
Pages
80
Flexible Purchase Options
Select and purchase only the chapters you need for your strategic decisions
On This Page
Report Overview
The report titled “Indonesia Nitrogenous Fertilizer Market Outlook to 2035 – By Product Type, By Crop Type, By Application Method, By Distribution Channel, and By Region” provides a comprehensive analysis of the nitrogenous fertilizer industry in Indonesia. The report covers an overview and genesis of the market, overall market size in terms of value and volume, detailed market segmentation; trends and developments, regulatory and subsidy landscape, farmer- and distributor-level demand profiling, key issues and challenges, and competitive landscape including competition scenario, cross-comparison, opportunities and bottlenecks, and company profiling of major players operating in the Indonesian nitrogenous fertilizer market.
Report Coverage
Verified Market Sizing
Multi-layer forecasting with historical data and 5–10 year outlook
Deep-Dive Segmentation
Cross-sectional analysis by product type, end user, application and region
Competitive Benchmarking & Positioning
Market share, operating model, pricing and competition matrices
Actionable Insights & Risk Assessment
High-growth white spaces, underserved segments, technology disruptions and demand inflection points
Review Methodology & Data Structure
Preview report structure, data sources and research framework
Executive Summary
The report titled “Indonesia Nitrogenous Fertilizer Market Outlook to 2035 – By Product Type, By Crop Type, By Application Method, By Distribution Channel, and By Region” provides a comprehensive analysis of the nitrogenous fertilizer industry in Indonesia. The report covers an overview and genesis of the market, overall market size in terms of value and volume, detailed market segmentation; trends and developments, regulatory and subsidy landscape, farmer- and distributor-level demand profiling, key issues and challenges, and competitive landscape including competition scenario, cross-comparison, opportunities and bottlenecks, and company profiling of major players operating in the Indonesian nitrogenous fertilizer market. The report concludes with future market projections based on agricultural production cycles, government fertilizer subsidy reforms, crop diversification trends, farm productivity initiatives, regional demand drivers, cause-and-effect relationships, and case-based illustrations highlighting the major opportunities and cautions shaping the market through 2035.
Indonesia Nitrogenous Fertilizer Market Overview and Size
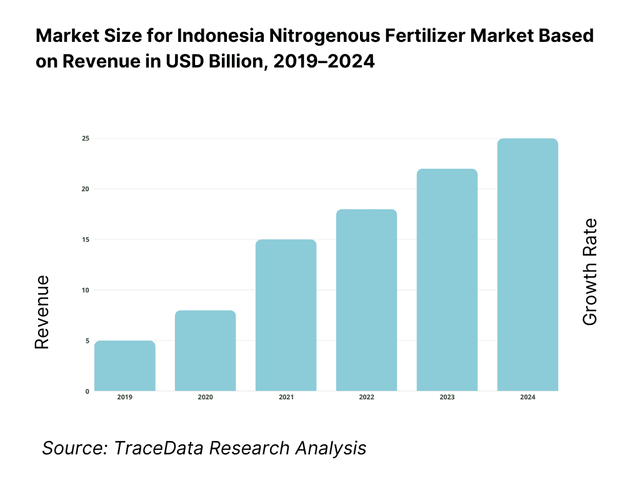
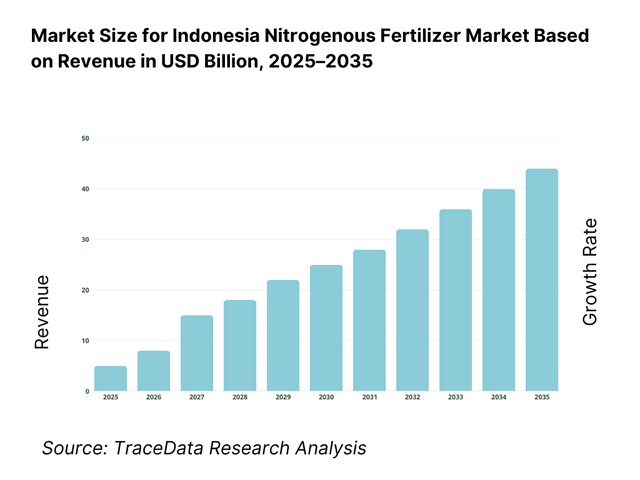
The Indonesia nitrogenous fertilizer market is valued at approximately ~USD ~ billion, representing the production, import, distribution, and consumption of nitrogen-based fertilizers such as urea, ammonium sulfate, ammonium nitrate, calcium ammonium nitrate, and nitrogen-based compound formulations. Nitrogenous fertilizers form the backbone of Indonesia’s crop nutrition ecosystem due to their critical role in promoting vegetative growth, improving yield intensity, and supporting multiple cropping cycles across staple food and plantation crops.
The market is fundamentally anchored by Indonesia’s large agricultural base, high dependence on rice as a staple food crop, extensive cultivation of maize, oil palm, rubber, and sugarcane, and the government’s long-standing fertilizer subsidy program aimed at supporting smallholder farmers and national food security objectives. Nitrogen fertilizers account for the largest share of total fertilizer consumption in the country, driven by nitrogen-deficient soils in many regions and the yield response characteristics of tropical crops.
Java represents the largest demand center for nitrogenous fertilizers due to its high cropping intensity, dense smallholder farmer population, and dominance in rice and maize cultivation. Sumatra follows as a major consumption region, supported by extensive oil palm, rubber, and plantation agriculture. Kalimantan and Sulawesi show structurally rising demand driven by plantation expansion, food estate programs, and increased adoption of balanced fertilization practices. Eastern Indonesia remains comparatively smaller but shows long-term growth potential as irrigation coverage, logistics connectivity, and government-supported agricultural development programs expand.
What Factors are Leading to the Growth of the Indonesia Nitrogenous Fertilizer Market
Dominance of nitrogen-intensive crops sustains baseline demand across agricultural cycles: Indonesia’s agricultural production system is heavily skewed toward nitrogen-intensive crops such as rice, maize, oil palm, and sugarcane. Rice alone accounts for a significant share of total fertilizer consumption due to multiple planting seasons per year and the need to sustain yields on limited arable land. Nitrogen fertilizers, particularly urea and ammonium sulfate, remain indispensable inputs across both irrigated and rainfed systems. This structural crop mix ensures stable baseline demand for nitrogenous fertilizers regardless of short-term commodity price fluctuations or climatic variability.
Government fertilizer subsidy programs underpin volume stability and market continuity: The Indonesian government plays a central role in shaping fertilizer demand through its subsidized fertilizer distribution system. Urea and other nitrogenous fertilizers are prioritized within subsidy allocations to ensure affordability for small and marginal farmers. Although subsidy volumes and beneficiary criteria have evolved over time, the continued presence of state-backed procurement, distribution quotas, and price controls provides demand certainty for domestic producers and distributors. This policy-driven stability reduces downside risk for nitrogen fertilizer manufacturers and sustains large-scale production capacity utilization.
Intensification of farming practices increases nutrient application rates: Pressure to improve yields on shrinking per-capita farmland has led to gradual intensification of farming practices across Indonesia. Farmers are increasingly adopting improved seed varieties, better irrigation management, and more systematic fertilizer application schedules. Nitrogen fertilizers remain the first and most responsive input in this intensification process due to their immediate impact on crop growth. Even as awareness of balanced fertilization improves, nitrogen continues to command the largest share of nutrient application, supporting incremental volume growth over the medium to long term.
Which Industry Challenges Have Impacted the Growth of the Indonesia Nitrogenous Fertilizer Market:
Heavy dependence on government subsidies distorts market pricing and demand signals: The Indonesian nitrogenous fertilizer market is deeply influenced by the government’s fertilizer subsidy framework, which fixes retail prices, allocates volumes, and defines eligible farmer categories. While subsidies support affordability and food security objectives, they also weaken natural price discovery and reduce incentives for efficient nutrient use. Any delay or change in subsidy allocation, distribution quotas, or beneficiary databases can disrupt seasonal availability, create regional shortages, or shift demand abruptly toward non-subsidized channels. This policy-driven demand structure limits market responsiveness and constrains commercial pricing flexibility for manufacturers and distributors.
Natural gas feedstock availability and pricing volatility impact production economics: Nitrogenous fertilizer production is highly energy-intensive, relying heavily on natural gas as a feedstock. In Indonesia, fluctuations in gas supply prioritization, pricing terms for fertilizer producers, and infrastructure constraints can affect plant operating rates and cost structures. Periodic gas allocation issues or price revisions directly influence domestic production economics, potentially increasing reliance on imports during peak demand periods. These dynamics introduce cost uncertainty for producers and can affect fertilizer availability during critical planting seasons.
Inefficient distribution and last-mile delivery challenges affect timely access for farmers: Despite a well-established national distribution network, last-mile fertilizer delivery remains a persistent challenge, particularly in remote and outer island regions. Logistical bottlenecks, limited storage infrastructure, weather-related disruptions, and coordination gaps between producers, distributors, and retailers can delay fertilizer availability during peak application windows. For nitrogenous fertilizers, where timing of application is critical to crop response, such delays can reduce effectiveness, lower yields, and negatively influence farmer confidence in formal distribution channels.
What are the Regulations and Initiatives which have Governed the Market:
Government fertilizer subsidy program regulating pricing, volumes, and distribution mechanisms: The nitrogenous fertilizer market in Indonesia is primarily governed by the national fertilizer subsidy program, which determines annual subsidized volumes, maximum retail prices, eligible farmer criteria, and distribution responsibilities. Urea and other nitrogen-based fertilizers are prioritized under this framework due to their importance in staple crop production. The program directly shapes demand patterns, procurement planning, and production scheduling for domestic manufacturers, while also influencing farmer purchasing behavior and nutrient use intensity.
Natural gas allocation and pricing policies supporting domestic fertilizer manufacturing: To ensure stable domestic fertilizer production, the government regulates natural gas allocation and pricing for fertilizer manufacturers. Preferential gas pricing and long-term supply agreements are intended to maintain plant viability and reduce dependence on imports. However, changes in gas policy, competing industrial demand, or infrastructure constraints can impact production continuity. These policies play a critical role in determining capacity utilization, cost competitiveness, and long-term investment decisions in nitrogen fertilizer manufacturing.
Agricultural productivity and food security initiatives promoting fertilizer access and usage: National initiatives focused on food self-sufficiency, rice productivity, and farmer income stability indirectly drive nitrogenous fertilizer demand. Programs supporting improved seed adoption, irrigation expansion, multiple cropping cycles, and mechanization increase fertilizer responsiveness and reinforce nitrogen demand. Extension services and digital farmer databases are increasingly used to improve targeting, monitor distribution, and reduce leakages, gradually reshaping how nitrogen fertilizers are allocated and consumed.
Indonesia Nitrogenous Fertilizer Market Segmentation
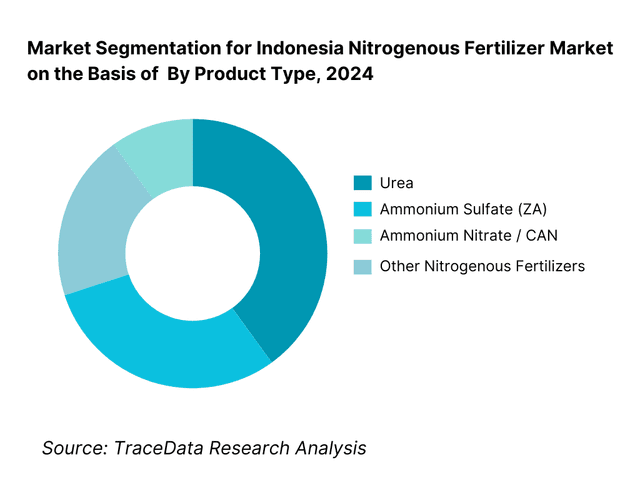
By Product Type: Urea dominates the nitrogenous fertilizer market in Indonesia. Urea holds the largest share of nitrogenous fertilizer consumption due to its high nitrogen content, cost efficiency, ease of storage and transportation, and strong alignment with the government subsidy framework. It is widely used across rice, maize, and plantation crops and benefits from extensive domestic production capacity. Ammonium sulfate maintains a strong presence due to its sulfur content, which is particularly beneficial for oil palm, sugarcane, and sulfur-deficient soils. Other nitrogenous products such as ammonium nitrate, calcium ammonium nitrate, and specialty nitrogen formulations remain niche, largely catering to commercial plantations and non-subsidized demand segments.
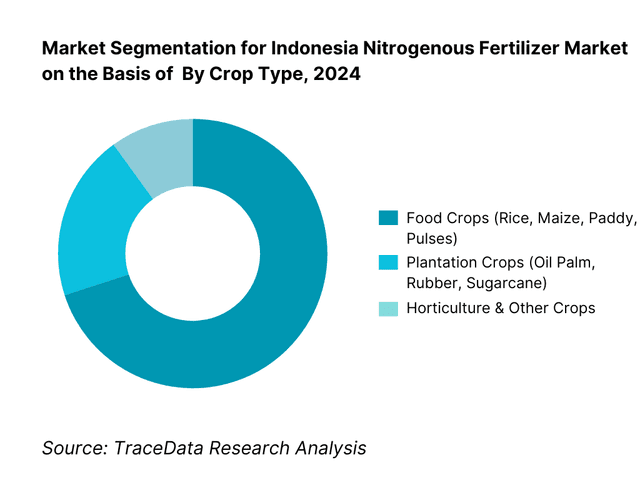
By Crop Type: Food crops account for the largest share of nitrogen fertilizer demand. Food crops—particularly rice and maize—dominate nitrogenous fertilizer consumption in Indonesia due to their large cultivated area, multiple cropping cycles, and high nitrogen responsiveness. Plantation crops such as oil palm, rubber, and sugarcane form the second-largest demand segment, driven by consistent nutrient requirements and commercial-scale fertilizer procurement. Horticulture and other crops account for a smaller but growing share as higher-value farming and intensive cultivation practices expand.
Competitive Landscape in Indonesia Nitrogenous Fertilizer Market
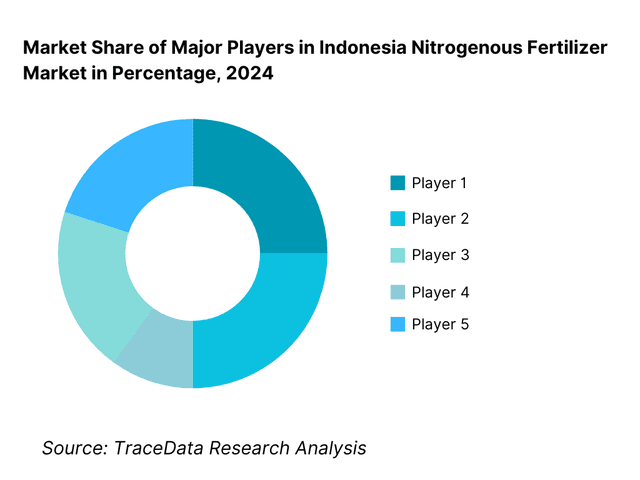
The Indonesia nitrogenous fertilizer market exhibits moderate-to-high concentration, led primarily by state-owned and large domestic producers with integrated manufacturing facilities, access to natural gas feedstock, and strong alignment with government procurement and subsidy programs. Market leadership is driven by production scale, reliability of supply during peak seasons, geographic distribution reach, and compliance with government allocation mechanisms. Private and international players operate largely in the non-subsidized segment, focusing on plantations, specialty fertilizers, and differentiated nitrogen products.
Name | Founding Year | Original Headquarters |
PT Pupuk Indonesia | 2012 | Jakarta, Indonesia |
PT Pupuk Sriwidjaja Palembang (PUSRI) | 1959 | Palembang, Indonesia |
PT Pupuk Kalimantan Timur | 1977 | Bontang, Indonesia |
PT Pupuk Kujang | 1975 | Cikampek, Indonesia |
PT Pupuk Iskandar Muda | 1982 | Aceh, Indonesia |
Yara Indonesia | ~ | Jakarta, Indonesia |
EuroChem | 2001 | Switzerland |
OCI Fertilizers | 1950 | Netherlands |
Some of the Recent Competitor Trends and Key Information About Competitors Include:
PT Pupuk Indonesia: As the central holding company for Indonesia’s state-owned fertilizer producers, Pupuk Indonesia plays a dominant role in nitrogenous fertilizer production and subsidized distribution. Its competitive strength lies in integrated capacity management, coordination across multiple production plants, and deep alignment with government food security objectives. The group continues to focus on supply reliability, subsidy compliance, and gradual efficiency improvements across its nitrogen value chain.
PT Pupuk Sriwidjaja Palembang (PUSRI): PUSRI is a cornerstone of Indonesia’s urea production ecosystem, with a strong legacy in supporting national rice production. The company benefits from established production infrastructure and long-standing participation in the subsidized fertilizer program. Its competitive position is reinforced by consistent output, strong logistics connectivity in Sumatra and Java, and alignment with seasonal agricultural demand cycles.
PT Pupuk Kalimantan Timur: With large-scale production facilities and access to natural gas feedstock, Pupuk Kaltim is a critical supplier of nitrogenous fertilizers for both domestic consumption and export markets. The company’s scale and production efficiency support stable supply during peak planting seasons, making it a key player in maintaining national fertilizer availability.
International Players (Yara, EuroChem, OCI): International fertilizer companies participate selectively in Indonesia’s nitrogenous fertilizer market, primarily targeting non-subsidized segments such as plantations and specialty crop producers. Their competitive advantage lies in advanced product formulations, agronomic advisory services, and differentiated nitrogen solutions rather than volume-based competition with domestic state-owned producers.
What Lies Ahead for Indonesia Nitrogenous Fertilizer Market?
The Indonesia nitrogenous fertilizer market is expected to grow steadily through 2035, supported by sustained food security priorities, continued dominance of nitrogen-intensive crops, and the government’s long-term commitment to supporting agricultural productivity. While overall growth will remain moderate, nitrogen fertilizers will continue to form the backbone of nutrient application across food crops and plantations. Market stability will be reinforced by recurring seasonal demand cycles, multiple cropping patterns, and the structural need to improve yields on limited arable land, even as policy reforms and sustainability considerations gradually reshape usage patterns.
Gradual Transition Toward More Efficient and Balanced Nitrogen Use Practices: Over the forecast period, Indonesia’s fertilizer ecosystem is expected to move slowly from volume-driven nitrogen consumption toward more efficiency-oriented application. While urea will remain the dominant product, greater emphasis will be placed on split application, improved timing, and the use of enhanced-efficiency nitrogen formulations in select crop segments. Government extension programs and agronomic advisory initiatives are likely to promote balanced fertilization to improve yield response and reduce nutrient losses, moderating excessive nitrogen use without fundamentally reducing demand volumes.
Evolution of Subsidy Mechanisms and Improved Targeting of Beneficiaries: Fertilizer subsidy reform will remain a key structural theme shaping the nitrogenous fertilizer market. The government is expected to continue refining farmer databases, digital allocation systems, and distribution controls to improve targeting and reduce leakages. While subsidized volumes are likely to remain substantial, incremental shifts toward more precise allocation and differentiated nutrient recommendations could influence product mix and regional demand patterns. Producers that align operational planning with evolving subsidy frameworks will be better positioned to maintain supply stability and policy alignment.
Rising Importance of Plantation and Non-Subsidized Demand Channels: Growth momentum outside the traditional subsidized channel is expected to strengthen through increased fertilizer use in plantation agriculture, commercial farming, and higher-value crops. Oil palm, sugarcane, and industrial crop operators are likely to drive demand for nitrogen fertilizers through non-subsidized channels, where pricing flexibility, bulk procurement, and product differentiation are more prominent. This segment offers opportunities for manufacturers to introduce specialty nitrogen products, agronomic services, and customized nutrient programs that improve productivity and long-term customer engagement.
Indonesia Nitrogenous Fertilizer Market Segmentation
By Product Type
- Urea
- Ammonium Sulfate (ZA)
- Ammonium Nitrate
- Calcium Ammonium Nitrate (CAN) / UAN Solutions (where applicable)
- Other Nitrogenous Fertilizers (enhanced-efficiency urea, coated urea, specialty nitrogen blends)
By Crop Type
- Food Crops (Rice, Maize, Pulses, Other Staples)
- Plantation Crops (Oil Palm, Rubber, Sugarcane, Cocoa)
- Horticulture Crops (Vegetables, Fruits, High-Value Crops)
- Other Crops (Industrial crops, fodder, mixed farming systems)
By Application Method
- Basal Application (soil incorporation)
- Top Dressing / Split Application (stage-wise nitrogen dosing)
- Broadcast Application
- Fertigation (drip/sprinkler systems where adopted)
- Foliar Nitrogen Application (niche, high-value crops)
By Distribution Channel
- Subsidized Government Distribution (allocated retail points, regulated pricing)
- Non-Subsidized Commercial Retail (agri-input retailers, local distributors)
- Plantation / Institutional Bulk Procurement (direct procurement by estates & large farms)
- Cooperatives, Farmer Groups, and Aggregators (organized procurement and distribution)
By Region
- Java
- Sumatra
- Kalimantan
- Sulawesi
- Bali & Nusa Tenggara
- Maluku & Papua
Players Mentioned in the Report:
- PT Pupuk Indonesia (Holding)
- PT Pupuk Sriwidjaja Palembang (PUSRI)
- PT Pupuk Kalimantan Timur (Pupuk Kaltim)
- PT Pupuk Kujang
- PT Pupuk Iskandar Muda
- Selected importers and international suppliers (for non-subsidized nitrogen products)
- Regional distributors, agro-dealers, cooperatives, and plantation procurement networks
Key Target Audience
- Nitrogen fertilizer manufacturers and ammonia/urea value chain stakeholders
- Natural gas suppliers, logistics providers, and port-based import operators
- Government agencies managing fertilizer subsidy allocation and monitoring
- National and regional distributors, wholesalers, and agro-input retailers
- Large plantations (oil palm, sugarcane, rubber) and commercial farming operators
- Farmer cooperatives, FPO-style groups, and agri-aggregators
- Agronomy advisory firms, extension agencies, and soil testing service providers
- Banks, insurers, and development institutions supporting agricultural productivity programs
Time Period:
Historical Period: 2019–2024
Base Year: 2025
Forecast Period: 2025–2035
Explore Flexible Purchase Options or Have Limited Budget?
Pay only for relevant chapters • Customizable report sections
Table of Contents
Choose individual sections to purchase. Mix and match as you like.
4. 1 Delivery Model Analysis for Nitrogenous Fertilizers-Subsidized Distribution, Commercial Retail, Direct-to-Plantation, Import-Based Supply [Margins, Preference, Strength & Weakness]
4. 2 Revenue Streams for Indonesia Nitrogenous Fertilizer Market [Subsidized Sales, Non-Subsidized Sales, Bulk Institutional Sales, Imports]
4. 3 Business Model Canvas for Indonesia Nitrogenous Fertilizer Market [Key Partners, Key Activities, Value Propositions, Customer Segments, Cost Structure, Revenue Streams]
5. 1 Local Players vs Global Suppliers [Pupuk Indonesia vs International Fertilizer Companies etc.]
5. 2 Investment Model in Indonesia Nitrogenous Fertilizer Market [Government Capex, State-Owned Investments, Private Sector Investments, Joint Ventures]
5. 3 Comparative Analysis of Fertilizer Usage in Subsidized vs Non-Subsidized Segments [Allocation Mechanism, Pricing, Volume Stability, ROI for Farmers]
5. 4 Fertilizer Budget Allocation by Farm Size [Small & Marginal Farmers, Medium Farmers, Large Farmers & Plantations]
8. 1 Revenues (Historical Trend)
9. 1 By Market Structure (Subsidized vs Non-Subsidized Fertilizer Market)
9. 2 By Product Type (Urea, Ammonium Sulfate, Ammonium Nitrate, CAN/UAN, Others)
9. 3 By Crop Type (Food Crops, Plantation Crops, Horticulture, Others)
9. 4 By Farm Size (Small & Marginal, Medium, Large Farms & Plantations)
9. 5 By Application Method (Basal, Top Dressing, Split Application, Fertigation, Foliar)
9. 6 By Distribution Channel (Government Distribution, Commercial Retail, Direct Procurement, Cooperatives)
9. 7 By Standard vs Specialty Nitrogen Fertilizers
9. 8 By Region (Java, Sumatra, Kalimantan, Sulawesi, Eastern Indonesia)
10. 1 Farmer & Plantation Operator Landscape and Cohort Analysis
10. 2 Fertilizer Adoption Drivers & Decision-Making Process
10. 3 Fertilizer Effectiveness & Yield Response Analysis
10. 4 Gap Analysis Framework
11. 1 Trends & Developments in Indonesia Nitrogenous Fertilizer Market
11. 2 Growth Drivers for Indonesia Nitrogenous Fertilizer Market
11. 3 SWOT Analysis for Indonesia Nitrogenous Fertilizer Market
11. 4 Issues & Challenges for Indonesia Nitrogenous Fertilizer Market
11. 5 Government Regulations for Indonesia Nitrogenous Fertilizer Market
12. 1 Market Size and Future Potential for Non-Subsidized Nitrogen Fertilizers in Indonesia
12. 2 Business Models & Revenue Streams [Bulk Sales, Specialty Products, Agronomy Services]
12. 3 Delivery Models & Nitrogen Fertilizer Applications Offered [Granular, Prilled, Coated, Liquid Nitrogen]
15. 1 Market Share of Key Players in Indonesia Nitrogenous Fertilizer Market (By Revenues)
15. 2 Benchmark of Key Competitors [Company Overview, USP, Business Strategies, Business Model, Production Capacity, Revenues, Pricing Models, Product Portfolio, Key Crops Served, Distribution Network, Strategic Tie-ups, Recent Developments]
15. 3 Operating Model Analysis Framework
15. 4 Competitive Positioning Matrix for Fertilizer Producers
15. 5 Bowman’s Strategic Clock for Competitive Advantage
16. 1 Revenues (Projections)
17. 1 By Market Structure (Subsidized and Non-Subsidized Fertilizer Market)
17. 2 By Product Type (Urea, Ammonium Sulfate, Ammonium Nitrate, CAN/UAN, Others)
17. 3 By Crop Type (Food Crops, Plantation Crops, Horticulture, Others)
17. 4 By Farm Size (Small & Marginal, Medium, Large Farms & Plantations)
17. 5 By Application Method (Basal, Top Dressing, Split Application, Fertigation, Foliar)
17. 6 By Distribution Channel (Government, Commercial Retail, Direct Procurement, Cooperatives)
17. 7 By Standard vs Specialty Nitrogen Fertilizers
17. 8 By Region (Java, Sumatra, Kalimantan, Sulawesi, Eastern Indonesia)
Discuss a Customized Research Scope
Custom research scope • Tailored insights • Industry expertise
Research Methodology
Step 1: Ecosystem Creation
We begin by mapping the complete ecosystem of the Indonesia Nitrogenous Fertilizer Market across demand-side and supply-side entities. On the demand side, entities include small and marginal farmers, medium and large farmers, plantation operators (oil palm, sugarcane, rubber), horticulture growers, farmer cooperatives, and government-supported agricultural programs. Demand is further segmented by crop type (food crops vs plantation crops), farm size, irrigation intensity, and fertilizer usage patterns (basal vs split application). On the supply side, the ecosystem includes state-owned fertilizer holding companies, domestic nitrogen fertilizer manufacturers, ammonia and urea production units, natural gas suppliers, importers, bulk distributors, regional wholesalers, agro-input retailers, cooperatives, logistics providers, and government agencies responsible for subsidy allocation and monitoring. From this mapped ecosystem, we shortlist leading nitrogen fertilizer producers and distributors based on installed capacity, geographic coverage, product portfolio, participation in the subsidy program, and presence across key agricultural regions. This step establishes how value is created and captured across production, distribution, subsidy allocation, and last-mile delivery.
Step 2: Desk Research
An exhaustive desk research process is undertaken to analyze the structure, demand drivers, and operating dynamics of the Indonesia nitrogenous fertilizer market. This includes reviewing agricultural production trends, cropping patterns, fertilizer consumption norms, subsidy policy frameworks, and regional agricultural development programs. We assess historical fertilizer usage by crop type, planting cycles, and geography, along with shifts in nutrient management practices. Company-level analysis includes review of production capacity, plant locations, feedstock sourcing, product mix, distribution reach, and historical participation in subsidized and non-subsidized channels. Regulatory and policy analysis covers fertilizer subsidy mechanisms, gas allocation policies, import regulations, and evolving sustainability guidelines. The outcome of this stage is a robust industry baseline that defines segmentation logic and supports market sizing and forecast assumptions.
Step 3: Primary Research
We conduct structured interviews with nitrogen fertilizer manufacturers, distributors, agro-input retailers, plantation procurement teams, agronomists, and agricultural experts. The objectives are threefold: (a) validate assumptions around demand concentration, subsidy-driven versus commercial demand, and regional consumption patterns, (b) authenticate segmentation splits by product type, crop category, application method, and distribution channel, and (c) gather qualitative insights on pricing behavior, availability during peak seasons, logistics challenges, farmer preferences, and adoption of efficient nitrogen practices. A bottom-to-top approach is applied by estimating cultivated area, average nitrogen application rates, and fertilizer usage across major crops and regions, which are aggregated to develop the overall market view. In select cases, distributor- and retailer-level interactions are used to validate field realities such as allocation delays, last-mile challenges, and farmer purchasing behavior.
Step 4: Sanity Check
The final stage integrates bottom-to-top and top-to-down approaches to cross-validate market size estimates, segmentation splits, and forecast assumptions. Demand estimates are reconciled with macro indicators such as crop production targets, population growth, food security objectives, and government budget allocations for fertilizer subsidies. Key assumptions related to subsidy reforms, natural gas availability, import dependence, and changes in nutrient management practices are stress-tested to assess their impact on demand growth. Sensitivity analysis is conducted across variables including cropping intensity, plantation expansion, policy shifts, and sustainability-driven moderation of nitrogen usage. Market models are refined until alignment is achieved between production capacity, distribution throughput, and end-user demand, ensuring internal consistency and a robust outlook through 2035.
See What's Inside the Report
Get a preview of key findings, methodology and report coverage
Frequently Asked Questions
The Indonesia nitrogenous fertilizer market holds strong long-term potential, supported by sustained food security priorities, dominance of nitrogen-intensive crops such as rice and maize, and the government’s continued commitment to supporting agricultural productivity through subsidies. While growth is expected to remain moderate, nitrogen fertilizers will continue to form the backbone of nutrient application across food crops and plantations through 2035.
The market is led primarily by state-owned and large domestic fertilizer producers operating under a national holding structure, supported by integrated production facilities and extensive distribution networks. These players dominate subsidized fertilizer supply, while international and private companies participate selectively in non-subsidized and plantation-focused segments. Competition is driven by production reliability, distribution reach, and alignment with government allocation mechanisms.
Key growth drivers include high cropping intensity, multiple planting seasons, continued reliance on nitrogen for yield improvement, and expansion of plantation agriculture outside Java. Government fertilizer subsidies, agricultural productivity initiatives, and gradual intensification of farming practices further reinforce demand. Growth is also supported by non-subsidized demand from plantations and commercial farms seeking consistent nutrient supply.
Major challenges include heavy dependence on subsidy mechanisms, which can distort pricing and demand signals, volatility in natural gas feedstock availability and pricing, logistical and last-mile distribution constraints, and imbalanced fertilizer application practices. Emerging sustainability and environmental concerns may also influence future nitrogen usage patterns, requiring producers and policymakers to balance productivity with responsible nutrient management.
License Options
PDF + Excel
Complete report package
$4,000
Excel Only
Data and analytics
$2,500
Custom Sections
Starts from $100
$0