Indonesia Toys and Games Market Outlook to 2029
By Branded and Local Players, By Product Type (Educational Toys, Electronic Toys, Action Figures, Dolls, Games and Puzzles, Ride-Ons), By Age Group, By Distribution Channel, and By Region
Report Overview
Report Code
TDR0062
Coverage
Asia
Published
November 2024
Pages
80-100
Flexible Purchase Options
Select and purchase only the chapters you need for your strategic decisions
On This Page
Report Overview
The report titled “Indonesia Toys and Games Market Outlook to 2029 - By Branded and Local Players, By Product Type (Educational Toys, Electronic Toys, Action Figures, Dolls, Games and Puzzles, Ride-Ons), By Age Group, By Distribution Channel, and By Region” provides a comprehensive analysis of the toys and games market in Indonesia. The report covers an overview and genesis of the industry, overall market size in terms of revenue, market segmentation; trends and developments, regulatory landscape, customer profiling, issues and challenges, and competitive landscape including competition scenario, cross-comparison, opportunities and bottlenecks, and company profiling of major players in the Toys...
Report Coverage
Verified Market Sizing
Multi-layer forecasting with historical data and 5–10 year outlook
Deep-Dive Segmentation
Cross-sectional analysis by product type, end user, application and region
Competitive Benchmarking & Positioning
Market share, operating model, pricing and competition matrices
Actionable Insights & Risk Assessment
High-growth white spaces, underserved segments, technology disruptions and demand inflection points
Review Methodology & Data Structure
Preview report structure, data sources and research framework
Executive Summary
The report titled “Indonesia Toys and Games Market Outlook to 2029 - By Branded and Local Players, By Product Type (Educational Toys, Electronic Toys, Action Figures, Dolls, Games and Puzzles, Ride-Ons), By Age Group, By Distribution Channel, and By Region” provides a comprehensive analysis of the toys and games market in Indonesia. The report covers an overview and genesis of the industry, overall market size in terms of revenue, market segmentation; trends and developments, regulatory landscape, customer profiling, issues and challenges, and competitive landscape including competition scenario, cross-comparison, opportunities and bottlenecks, and company profiling of major players in the Toys and Games Market. The report concludes with future market projections based on sales revenue, by market, product types, region, cause and effect relationships, and success case studies highlighting the major opportunities and cautions.
Indonesia Toys and Games Market Overview and Size
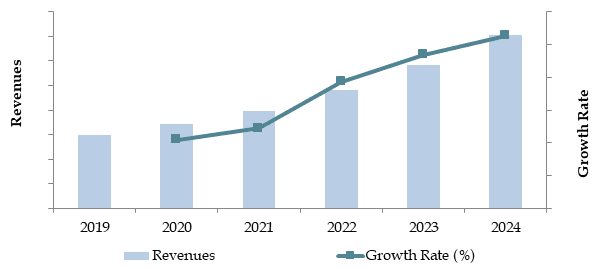
The Indonesia toys and games market reached a valuation of IDR 9.5 Trillion in 2023, driven by the increasing demand for educational toys, a growing middle-class population, and rising consumer spending on children’s products. Major players such as Mattel Indonesia, Hasbro Indonesia, PT Toys Kingdom, and PT Toys Mart dominate the market. These companies are recognized for their extensive product offerings, strong distribution networks, and customer-focused services.
In 2023, PT Toys Kingdom launched a new range of eco-friendly toys to appeal to environmentally conscious parents. This initiative aims to tap into the growing trend towards sustainability in Indonesia and provide a unique selling point in a competitive market. Jakarta and Surabaya are key markets due to their high population density and robust retail infrastructure.
Market Size for Indonesia Toys and Games Industry on the Basis of Revenue, 2018-2024P
What Factors are Leading to the Growth of Indonesia Toys and Games Market:
Economic Growth and Rising Disposable Income: Indonesia’s steady economic growth and rising disposable income have enabled consumers to spend more on discretionary items, including toys and games. In 2023, household spending on toys and games increased by 25%, driven by a growing middle class with higher purchasing power.
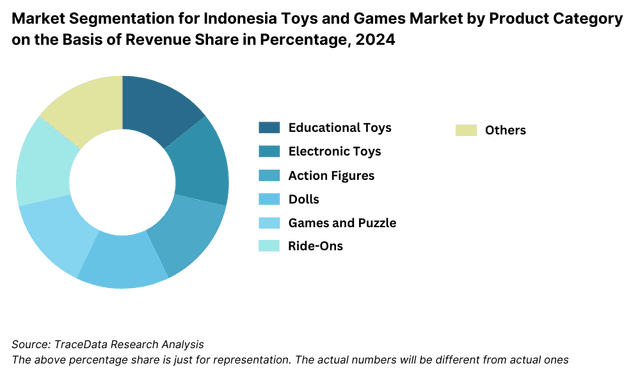
Educational and Developmental Toy Demand: There is an increasing demand for educational and developmental toys in Indonesia as parents become more conscious of their children’s cognitive and social development. In 2023, educational toys accounted for 30% of total toy sales, reflecting a shift towards products that offer learning benefits along with entertainment.
Digitalization and E-commerce Growth: The rise of digital platforms and e-commerce channels has transformed the way toys and games are purchased. In 2023, approximately 45% of toy sales in Indonesia were made online, driven by the convenience and broader product range offered by e-commerce platforms. This shift has allowed consumers to access a wider variety of toys, boosting market growth.
Industry Challenges Impacting the Growth of the Indonesia Toys and Games Market
Quality and Safety Concerns: Concerns about the quality and safety of toys remain significant challenges. Approximately 30% of consumers are hesitant to purchase toys due to fears of toxic materials and substandard manufacturing practices. This issue has led to lower trust levels among buyers, potentially deterring up to 20% of prospective customers.
Counterfeit Products: The proliferation of counterfeit toys in the market, which often lack the necessary safety certifications, poses a threat to consumer confidence. In 2023, it was estimated that counterfeit toys accounted for around 15% of total toy sales in Indonesia. This problem is exacerbated by inadequate regulatory oversight and enforcement.
Regulatory Hurdles: Stringent regulations concerning toy safety standards and import restrictions can limit the availability of certain international brands. These regulations can impose significant costs, particularly on smaller distributors and retailers, making it challenging for them to comply.
Which Industry Challenges Have Impacted the Growth for Indonesia Toys and Games Market:
Counterfeit and Low-Quality Products: The presence of counterfeit and low-quality toys in the Indonesian market has been a persistent challenge. In 2023, approximately 20% of toys sold in the country were reported to be counterfeit or did not meet the required safety standards. This issue not only compromises consumer trust but also poses safety risks to children, significantly affecting the growth and credibility of legitimate brands.
Regulatory Compliance and Safety Standards: Stringent regulations concerning toy safety and the import of foreign toys have created barriers, particularly for smaller manufacturers and importers. In 2023, around 25% of imported toys failed to meet the required safety certifications, leading to delays and additional costs for compliance. These regulatory hurdles can be especially challenging for new entrants, limiting the variety of products available in the market.
Limited Retail Infrastructure in Rural Areas: The lack of retail infrastructure and distribution networks in rural and remote areas restricts the reach of toy manufacturers and sellers. As of 2023, only 35% of rural consumers had access to formal toy retail outlets, highlighting a significant disparity in product availability between urban and rural regions. This limitation hampers the overall market growth, particularly for companies looking to expand their footprint beyond major cities.
What are the Regulations and Initiatives which have Governed the Market:
Toy Safety Regulations: The Indonesian government enforces strict safety regulations on toys to ensure that they meet specific health and safety standards. These regulations require all toys to pass safety tests that check for hazardous chemicals, sharp edges, and small parts that could pose a choking hazard. In 2023, approximately 80% of toys met the required safety standards on their first inspection, reflecting a high compliance level among established manufacturers and importers.
Import Restrictions on Foreign Toys: The government has imposed import restrictions to protect the local toy industry and ensure that imported products comply with Indonesian safety standards. In 2023, imports of toys were subject to a certification process that required adherence to SNI (Indonesian National Standards). As a result, the import of toys that did not meet these standards decreased by 15%, encouraging the growth of domestic toy production.
Tax Incentives for Local Manufacturers: To promote local production, the Indonesian government has introduced tax incentives for domestic toy manufacturers. These incentives include reduced corporate tax rates and subsidies for setting up manufacturing units in less-developed regions. In 2023, these measures led to a 10% increase in the number of local toy manufacturers, supporting the overall growth of the industry.
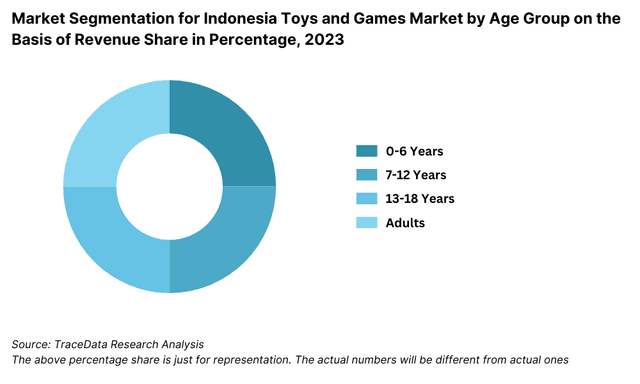
Indonesia Toys and Games Market Segmentation
By Product Category: Educational toys hold a significant share due to the rising awareness among parents regarding the cognitive and motor skill development of children. Traditional toys like dolls and action figures continue to have a strong presence, supported by cultural preferences and local production.
By Consumer Demographics: Toys for children aged 0-6 years dominate the market, with a share of 45%, driven by the demand for developmental and educational toys. The teenage segment shows a preference for electronic and outdoor toys, reflecting a growing trend towards active play.
By Sales Channel: Offline channels, such as specialty toy stores and department stores, hold the majority of the market share due to the preference for physical inspection of products before purchase. Online channels, however, are rapidly gaining traction, accounting for 40% of total sales in 2023, driven by the convenience of e-commerce platforms and a broader selection of products.
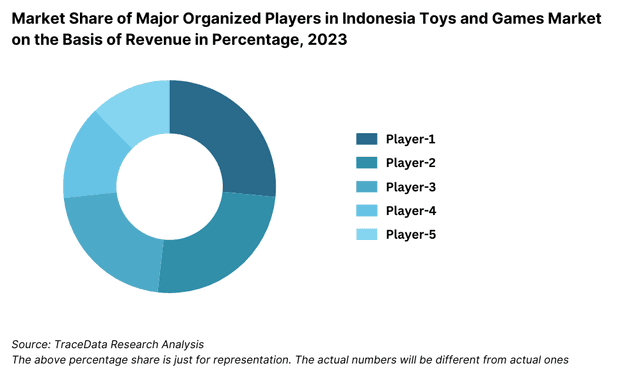
Competitive Landscape in Indonesia Toys and Games Market
The Indonesia toys and games market is relatively fragmented, with a mix of local and international players operating in the space. The entrance of new companies and the expansion of e-commerce platforms such as Tokopedia, Shopee, Lazada, and Blibli have diversified the market, providing consumers with more options and services.
Company Name | Establishment Year | Headquarters |
|---|---|---|
Mattel Indonesia PT | 1945 | Jakarta, Indonesia |
Lego AS | 1932 | Billund, Denmark |
Lotte Shopping Co., Ltd. | 1979 | Seoul, South Korea |
PT Matahari Putra Prima Tbk | 1958 | Tangerang, Indonesia |
Hasbro Indonesia | 1923 | Pawtucket, Rhode Island, USA |
PT Emco Toys | 1986 | Jakarta, Indonesia |
PT Toys Games Indonesia | 2008 | Jakarta, Indonesia |
Some of the recent competitor trends and key information about competitors include:
Mattel Indonesia: As one of the leading toy manufacturers, Mattel Indonesia recorded an 18% increase in revenue in 2023, driven by the launch of new Barbie and Hot Wheels collections. The company’s focus on integrating local cultural elements into their product lines has resonated well with Indonesian consumers.
Hasbro Indonesia: Known for its diverse product offerings, Hasbro Indonesia reported a 22% growth in sales in 2023, attributed to strong demand for board games and action figures. The company's collaboration with local distributors has strengthened its distribution network, enhancing product availability across the archipelago.
PT Toys Kingdom: PT Toys Kingdom saw a 15% increase in revenue in 2023, supported by the introduction of eco-friendly toy lines and educational toys. The company has also expanded its presence in online marketplaces, offering exclusive online discounts and promotions.
PT Toys Mart: Specializing in traditional and educational toys, PT Toys Mart reported a 20% growth in 2023, with a notable increase in sales through e-commerce channels. The company’s strategy to focus on high-quality educational toys has gained traction among parents seeking developmental products for their children.
PT FunLand: PT FunLand, a key player in the outdoor and sports toys segment, achieved a 12% growth in 2023, driven by the launch of new outdoor playsets and sports equipment. The company's emphasis on durability and safety has made it a preferred choice for outdoor play products.
What Lies Ahead for Indonesia Toys and Games Market?
The Indonesia toys and games market is projected to grow steadily by 2029, exhibiting a strong CAGR during the forecast period. This growth is expected to be driven by rising disposable incomes, increasing urbanization, and growing consumer interest in educational and eco-friendly toys.
Shift towards Educational and STEM Toys: The growing emphasis on early childhood education and development is anticipated to drive demand for educational and STEM (Science, Technology, Engineering, and Mathematics) toys. These toys are designed to enhance cognitive abilities and problem-solving skills in children. As parents continue to prioritize their children’s learning, the market for educational toys is expected to grow by 20% annually through 2029.
Expansion of E-Commerce Channels: The increasing penetration of the internet and smartphones in Indonesia is boosting the growth of e-commerce platforms. Online sales of toys and games are projected to contribute 50% of the total market revenue by 2029, as more consumers opt for the convenience and variety offered by digital channels. The expansion of e-commerce is expected to support market growth by providing easy access to products in remote areas.
Rising Demand for Eco-Friendly and Sustainable Toys: With growing environmental awareness among consumers, there is a rising demand for eco-friendly and sustainable toys made from recycled materials or biodegradable components. Companies are introducing product lines that emphasize sustainability, which is expected to be a major growth driver for the market. By 2029, eco-friendly toys are anticipated to account for 15% of the total market share, reflecting this trend.
Technological Integration in Toys: The integration of technology in toys, such as interactive electronic toys, app-enabled toys, and augmented reality (AR) toys, is expected to attract a new segment of tech-savvy parents and children. This trend will likely enhance the play experience and boost the appeal of toys that blend physical and digital play. Technologically integrated toys are forecasted to see a CAGR of 25% during the forecast period.
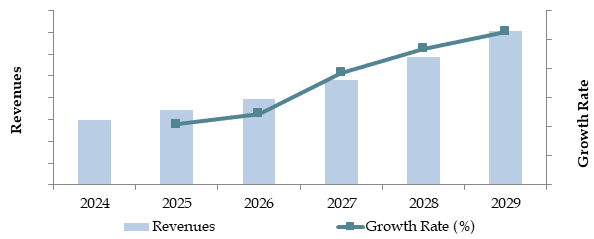
Future Outlook and Projections for Indonesia Toys and Games Market on the Basis of Revenue in INR Crores, 2024-2029
Indonesia Toys and Games Market Segmentation
By Market Structure:
- Traditional Toys
- Educational Toys
- Electronic Toys
- Outdoor and Sports Toys
- Plush Toys
- Board Games and Puzzles
By Product Category:
- Dolls and Action Figures
- Construction Sets
- Vehicles and Remote-Controlled Toys
- Arts and Crafts
- STEM Toys
- VideGames
By Consumer Demographics:
- 0-6 Years
- 7-12 Years
- 13-18 Years
- Adults
By Sales Channel:
- Specialty Toy Stores
- Department Stores
- E-commerce Platforms
- Hypermarkets and Supermarkets
- Small Independent Retailers
By Region:
- Java
- Sumatra
- Kalimantan
- Sulawesi
- Bali and Nusa Tenggara
- Papua
Players Mentioned in the Report:
- Mattel Inc.
- Hasbro Inc.
- LEGO Group
- Nintendo
- Electronic Arts
- Bandai Namco Holdings Inc.
- PT. Matahari Putra Prima Tbk
- Lotte Shopping Co., Ltd.
- Takara Tomy Co. Ltd
- Simba-Dickie Group
- Spin Master Ltd
- Moose Toys Ltd
- AOSHIMA BUNKA KYOZAI Co. Ltd
- Funko Inc.
Key Target Audience:
- Toy Manufacturers
- Retailers and Distributors
- E-commerce Platforms
- Educational Institutions
- Regulatory Bodies (e.g., Ministry of Trade, Ministry of Industry)
- Research and Development Institutions
Time Period:
- Historical Period: 2018-2023
- Base Year: 2024
- Forecast Period: 2024-2029
Explore Flexible Purchase Options or Have Limited Budget?
Pay only for relevant chapters • Customizable report sections
Table of Contents
Choose individual sections to purchase. Mix and match as you like.
3.1. Manufacturers and Suppliers
3.2. Distribution Channels
3.3. Retailers and E-commerce Platforms
3.4. Consumer Groups
4.1. Value Chain Process-Entity relationships, Margin Analysis, Distributor, Dealers, Traders and Retailers
4.2. Business Model Canvas for the India Toys and Games Market
5.1. Population by Age Group
5.2. Estimated Time Spent by Age Group on Toys and Recreational Activities
8.1. Revenues, 2018-2024
8.2. Sales Volume, 2018-2024
9.1. By Market Structure (Organized and Unorganized Market), 2023-2024P
9.2. By Product Category (Educational Toys, Electronic Toys, Traditional Toys, etc.), 2023-2024
9.3. By Sales Channel (Online, Offline Specialty Stores, Department Stores, etc.), 2023-2024P
9.4. By Region (Java, Sumatra, Kalimantan, Sulawesi, etc.), 2023-2024P
9.5. By Age Group (0-6 years, 7-12 years, 13-18 years, Adults), 2023-2024P
9.6. By Price Range, 2023-2024P
10.1. Consumer Landscape and Cohort Analysis
10.2. Consumer Journey and Decision Making
10.3. Need, Desire, and Pain Point Analysis
10.4. Gap Analysis Framework
11.1. Trends and Developments for Indonesia Toys and Games Market
11.2. Growth Drivers for Indonesia Toys and Games Market
11.3. SWOT Analysis for Indonesia Toys and Games Market
11.4. Issues and Challenges for Indonesia Toys and Games Market
11.5. Government Regulations for Indonesia Toys and Games Market
12.1. Market Size and Future Potential for Online Toys and Games Market, 2018-2029
12.2. Business Model and Revenue Streams
12.3. Cross Comparison of Leading Online Toy Platforms Basis Operational and Financial Parameters
15.1. Market Share of Key Organized Brands in Indonesia Toys and Games Market, 2024
15.2. Market Share of Key Distributors in Indonesia Toys and Games Market, 2024
15.3. Benchmark of Key Competitors in Indonesia Toys and Games Market Including Variables such as Company Overview, USP, Business Strategies, Strength, Weakness, Business Model, Marketing Strategy, Global Operations, Product Sales by Volume, Recent Development, Sourcing, Number of Stores by Cities, and Value-Added Services
15.4. Strength and Weakness
15.5. Operating Model Analysis Framework
15.6. Gartner Magic Quadrant
15.7. Bowmans Strategic Clock for Competitive Advantage
16.1. Revenues, 2025-2029
16.2. Sales Volume, 2025-2029
17.1. By Market Structure (Organized and Unorganized Market), 2025-2029
17.2. By Product Category (Educational Toys, Electronic Toys, Traditional Toys, etc.), 2025-2029
17.3. By Sales Channel (Online, Offline Specialty Stores, Department Stores, etc.), 2025-2029
17.4. By Region (Java, Sumatra, Kalimantan, Sulawesi, etc.), 2025-2029
17.5. By Age Group (0-6 years, 7-12 years, 13-18 years, Adults), 2025-2029
17.6. By Price Range, 2025-2029
17.7. Recommendations
17.8. Opportunity Analysis
Discuss a Customized Research Scope
Custom research scope • Tailored insights • Industry expertise
Research Methodology
Step 1: Ecosystem Creation
Map the ecosystem and identify all the demand side and supply side entities for Indonesia Toys and Games Market. Based on this ecosystem, we will shortlist leading 5-6 manufacturers in the country based on their financial information, production capacity/volume, and market presence.
Sourcing is done through industry articles, multiple secondary sources, and proprietary databases to perform desk research around the market to gather industry-level information.
Step 2: Desk Research
Subsequently, we engage in an exhaustive desk research process by referencing diverse secondary and proprietary databases. This approach enables us to conduct a thorough analysis of the market, aggregating industry-level insights. We delve into aspects like sales revenues, number of market players, product pricing, demand trends, and other variables. We supplement this with detailed examinations of company-level data, relying on sources like press releases, annual reports, financial statements, and similar documents. This process aims to build a foundational understanding of both the market and the entities operating within it.
Step 3: Primary Research
We initiate a series of in-depth interviews with C-level executives and other stakeholders representing various Indonesia Toys and Games Market companies and end-users. This interview process serves a multi-faceted purpose: to validate market hypotheses, authenticate statistical data, and extract valuable operational and financial insights from these industry representatives. A bottom-up approach is undertaken to evaluate revenue and sales volume for each player, which is then aggregated to arrive at the overall market size.
As part of our validation strategy, our team executes disguised interviews where we approach each company as potential customers. This approach enables us to validate the operational and financial information shared by company executives, corroborating this data against what is available in secondary databases. These interactions also provide us with a comprehensive understanding of revenue streams, value chain processes, pricing, and other factors.
Step 4: Sanity Check
A bottom-up and top-down analysis, along with market size modeling exercises, is undertaken as part of the sanity check process to ensure accuracy and consistency of the findings. This step involves cross-verification of data points obtained from various sources to maintain the integrity of the research output.
See What's Inside the Report
Get a preview of key findings, methodology and report coverage
Frequently Asked Questions
The Indonesia toys and games market reached a valuation of IDR 9.5 Trillion in 2023, driven by the increasing demand for educational toys, a growing middle-class population, and rising consumer spending on children’s products. Major players such as Mattel Indonesia, Hasbro Indonesia, PT Toys Kingdom, and PT Toys Mart dominate the market. These companies are recognized for their extensive product offerings, strong distribution networks, and customer-focused services.
Key players in the Indonesia toys and games market include global giants such as LEGO, Mattel, and Hasbro, as well as local manufacturers like PT Adhi Cipta and Asta Toys. These companies lead the market due to their strong product portfolios, effective distribution networks, and innovative marketing strategies. Other notable contributors include Bandai Namco and Nintendo, particularly in the video games segment, and regional distributors catering to local consumer preferences.
The primary growth drivers include rising disposable incomes, increased focus on early childhood development, and the rapid penetration of online shopping platforms. Urbanization, coupled with a growing middle-class population, has also encouraged higher spending on premium and branded toys. Moreover, the rising popularity of video games and e-sports among teenagers and young adults significantly contributes to market expansion.
The Indonesia toys and games market faces several challenges, including high import taxes on international brands, which make products less accessible to price-sensitive consumers. Regulatory barriers, such as product safety standards and certification requirements, also pose hurdles for manufacturers and importers. Additionally, competition from counterfeit and low-quality toys, along with limited reach in rural areas, restricts market growth in certain segments.
License Options
PDF + Excel
Complete report package
$4,000
Excel Only
Data and analytics
$2,500
Custom Sections
Starts from $100
$0