Indonesia Used Automobiles Market Outlook to 2035
By Vehicle Type, By Fuel Type, By Sales Channel, By Ownership Profile, and By Region
Report Overview
Report Code
TDR0454
Coverage
Asia
Published
January 2026
Pages
80
Flexible Purchase Options
Select and purchase only the chapters you need for your strategic decisions
On This Page
Report Overview
The report titled “Indonesia Used Automobiles Market Outlook to 2035 – By Vehicle Type, By Fuel Type, By Sales Channel, By Ownership Profile, and By Region” provides a comprehensive analysis of the used automobile ecosystem in Indonesia. The report covers an overview and genesis of the market, overall market size in terms of value and unit sales, detailed market segmentation; trends and developments, regulatory and compliance landscape, buyer-level demand profiling, key issues and challenges, and the competitive landscape including competition scenario, cross-comparison, opportunities and bottlenecks, and company profiling of major players operating in the Indonesia used automobiles market.
Report Coverage
Verified Market Sizing
Multi-layer forecasting with historical data and 5–10 year outlook
Deep-Dive Segmentation
Cross-sectional analysis by product type, end user, application and region
Competitive Benchmarking & Positioning
Market share, operating model, pricing and competition matrices
Actionable Insights & Risk Assessment
High-growth white spaces, underserved segments, technology disruptions and demand inflection points
Review Methodology & Data Structure
Preview report structure, data sources and research framework
Executive Summary
The report titled “Indonesia Used Automobiles Market Outlook to 2035 – By Vehicle Type, By Fuel Type, By Sales Channel, By Ownership Profile, and By Region” provides a comprehensive analysis of the used automobile ecosystem in Indonesia. The report covers an overview and genesis of the market, overall market size in terms of value and unit sales, detailed market segmentation; trends and developments, regulatory and compliance landscape, buyer-level demand profiling, key issues and challenges, and the competitive landscape including competition scenario, cross-comparison, opportunities and bottlenecks, and company profiling of major players operating in the Indonesia used automobiles market.
The report concludes with future market projections based on new vehicle affordability gaps, household income growth, urban mobility needs, expansion of digital automotive marketplaces, financing penetration, regulatory clarity on vehicle transfers, regional demand dynamics, cause-and-effect relationships, and case-based illustrations highlighting the major opportunities and cautions shaping the market through 2035.
Indonesia Used Automobiles Market Overview and Size
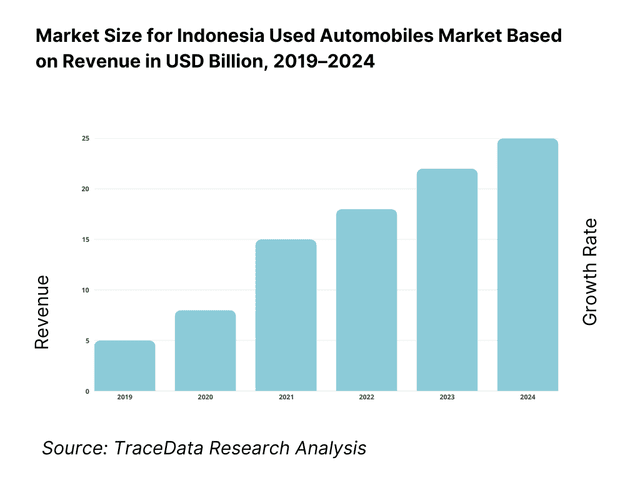
The Indonesia used automobiles market is valued at approximately ~USD ~ billion, representing the resale and secondary transaction of passenger cars and utility vehicles that have been previously owned and operated. This market includes vehicles transacted through organized digital platforms, dealer networks, OEM-certified used car programs, independent used car dealers, auctions, and peer-to-peer (C2C) channels.
Used automobiles form a structurally important component of Indonesia’s broader automotive ecosystem due to the country’s large population base, relatively low new vehicle penetration, high price sensitivity among middle-income households, and the long operational life of vehicles supported by improving road infrastructure and servicing availability. The used car market plays a critical role in enabling first-time vehicle ownership, facilitating vehicle upgrades, and supporting mobility demand in secondary cities and semi-urban regions.
Market demand is anchored by the widening affordability gap between new and used vehicles, rising financing availability for used cars, increasing consumer trust in organized sellers, and the rapid growth of online discovery and transaction platforms. Improvements in vehicle inspection standards, price transparency tools, and warranty-backed certified used car offerings have further accelerated buyer confidence and transaction velocity.
Java represents the largest demand center for used automobiles in Indonesia, driven by high population density, income concentration, urban commuting needs, and the dominance of Jakarta, West Java, and East Java as automotive hubs. Sumatra and Kalimantan follow as significant secondary markets, supported by mining, plantation, logistics, and regional trade activity. Eastern Indonesia remains underpenetrated but shows gradual growth as road connectivity improves and vehicle financing expands beyond tier-1 cities.
What Factors are Leading to the Growth of the Indonesia Used Automobiles Market
Affordability gap between new and used vehicles expands the buyer base: Rising new vehicle prices, driven by higher input costs, regulatory compliance requirements, and currency volatility, have widened the affordability gap for mass-market consumers in Indonesia. Used automobiles offer a significantly lower entry price while delivering comparable utility, especially for vehicles aged 2–6 years. This dynamic has positioned the used car market as the primary access point for first-time car buyers and upgrading two-wheeler households, particularly in price-sensitive urban and peri-urban segments.
Growth of organized digital marketplaces improves transparency and trust: The emergence and scaling of digital used car platforms in Indonesia have transformed market structure by improving price discovery, vehicle condition transparency, and transaction convenience. Online listings, standardized inspection reports, AI-driven pricing benchmarks, and doorstep services have reduced information asymmetry historically associated with used car purchases. These platforms have expanded reach beyond local dealer catchments and enabled buyers to compare inventory across cities and regions, thereby accelerating transaction volumes.
Increasing penetration of used car financing supports demand conversion: Financing availability for used automobiles has improved materially, with banks, captive finance arms, and non-bank financial institutions (NBFIs) offering tailored loan products for pre-owned vehicles. Lower down-payment requirements, flexible tenures, and faster approval processes have made used cars more accessible to salaried professionals, self-employed buyers, and small business owners. Financing penetration has also supported higher-value transactions, enabling buyers to upgrade vehicle segments without a proportionate increase in upfront cash outlay.
Which Industry Challenges Have Impacted the Growth of the Indonesia Used Automobiles Market:
Fragmentation and lack of standardized vehicle quality assessment reduce buyer confidence: The Indonesia used automobiles market has historically been dominated by highly fragmented, informal dealer networks and peer-to-peer transactions, where vehicle condition disclosure, inspection rigor, and pricing transparency vary widely. Inconsistent quality assessment standards increase the risk of odometer fraud, undisclosed accident history, and mechanical issues, particularly for first-time buyers. This trust deficit can delay purchase decisions, push buyers toward newer vehicles despite higher prices, or limit transaction volumes to known local sellers, constraining overall market formalization and scalable growth.
Supply imbalance caused by cyclical new vehicle sales impacts used inventory availability: Used car supply in Indonesia is structurally linked to prior new vehicle sales cycles, fleet replacement patterns, and leasing penetration. Periods of weak new car sales or extended ownership tenures reduce the availability of younger, low-mileage used vehicles, which are the most in-demand segments for organized platforms and financing-led sales. This imbalance can lead to price inflation in preferred age brackets (2–5 years), margin compression for dealers, and reduced affordability for buyers, especially in urban markets where demand remains strong.
Financing risk perception and uneven credit underwriting limit demand conversion: While used car financing penetration has improved, lenders continue to face challenges related to credit risk assessment, vehicle valuation accuracy, and resale risk in case of defaults. Variability in vehicle condition and resale liquidity across regions makes underwriting more complex compared to new cars. As a result, higher interest rates, conservative loan-to-value ratios, or stricter eligibility criteria can limit financing access for informal sector workers and self-employed buyers, restraining demand expansion in key middle-income segments.
What are the Regulations and Initiatives which have Governed the Market:
Vehicle ownership transfer, registration, and taxation regulations shaping transaction timelines: Used automobile transactions in Indonesia are governed by regulations related to ownership transfer (BPKB and STNK updates), vehicle registration, and applicable transfer taxes and administrative fees. Timely and accurate completion of these processes is critical for legal ownership and resale eligibility. Variations in regional implementation efficiency and documentation requirements can extend transaction timelines, affect customer experience, and increase working capital lock-in for dealers and platforms holding inventory during transfer periods.
Emission norms, roadworthiness requirements, and age-related compliance influencing vehicle eligibility: Regulations related to emission standards, periodic roadworthiness testing, and local enforcement practices influence which vehicles remain viable in the secondary market. Older vehicles with higher emissions or poor maintenance histories may face restrictions in certain urban areas or incur higher compliance costs. These factors shape residual values, influence scrappage decisions, and gradually push demand toward newer used vehicles that better meet evolving environmental and safety expectations.
Consumer protection guidelines and digital transaction oversight improving market transparency: Increasing emphasis on consumer protection, digital commerce regulation, and fair trade practices is gradually influencing the used automobiles market. Requirements related to accurate representation, dispute resolution mechanisms, and transparent pricing are particularly relevant for online platforms and organized dealers. While these initiatives improve buyer confidence and long-term market credibility, they also increase compliance, documentation, and operational requirements for sellers.
Indonesia Used Automobiles Market Segmentation
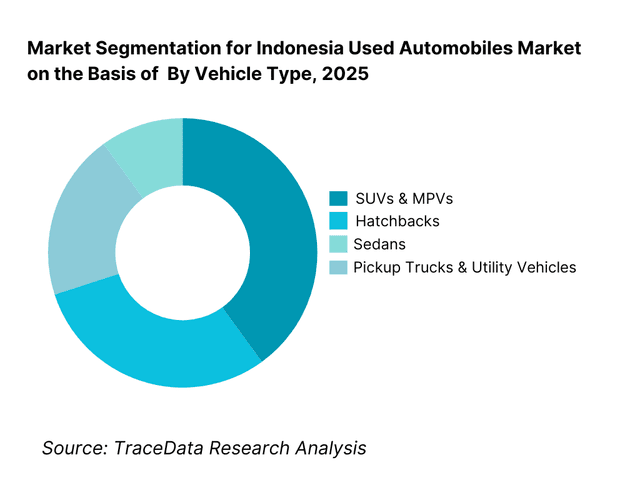
By Vehicle Type: The SUVs and MPVs segment holds dominance in the Indonesia used automobiles market. This is because multi-purpose vehicles align strongly with Indonesian household needs, road conditions, and usage patterns. SUVs and MPVs offer higher ground clearance, larger seating capacity, and versatility for family, business, and inter-city travel. These attributes make them highly preferred across both urban and semi-urban markets. While hatchbacks remain popular among first-time buyers due to affordability, and sedans retain relevance in corporate and executive segments, SUVs and MPVs continue to benefit from sustained demand, higher resale value, and strong availability in the used vehicle pipeline.
By Fuel Type: Petrol-powered vehicles dominate the used automobiles market in Indonesia due to lower upfront costs, widespread fuel availability, and easier maintenance compared to diesel alternatives. Diesel vehicles retain importance in utility, fleet, and inter-city usage segments, particularly outside major metros. Hybrid vehicles are gradually gaining traction in the used market, especially in Jakarta and other large cities, as buyers seek better fuel efficiency without new-vehicle price premiums. Used electric vehicles remain nascent, constrained by limited supply, charging infrastructure, and resale value uncertainty.

Competitive Landscape in Indonesia Used Automobiles Market
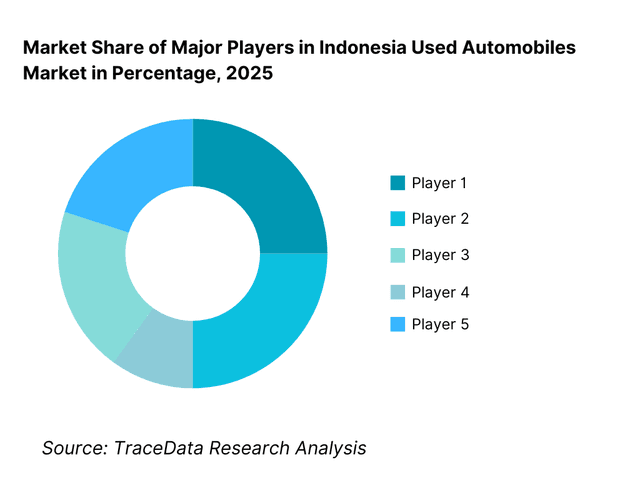
The Indonesia used automobiles market exhibits moderate fragmentation, characterized by the coexistence of fast-scaling digital platforms, OEM-backed certified used car programs, large dealer groups, and a vast base of independent local dealers. Competitive differentiation is driven by inventory sourcing capability, inspection and refurbishment standards, financing integration, pricing transparency, and customer experience.
Organized players are increasingly focusing on end-to-end transaction control—covering inspection, logistics, financing, insurance, and ownership transfer—while unorganized dealers continue to compete on price flexibility and local market familiarity. Scale, capital availability, and operational efficiency are becoming key determinants of long-term competitiveness.
Name | Founding Year | Original Headquarters |
OLX Autos | 2018 | Jakarta, Indonesia |
Mobil88 | 1988 | Jakarta, Indonesia |
Carro | 2015 | Singapore |
Carsome | 2015 | Kuala Lumpur, Malaysia |
Toyota Trust | ~2005 | Jakarta, Indonesia |
Astra Used Car | ~2010 | Jakarta, Indonesia |
Honda Certified Used Car | ~2014 | Jakarta, Indonesia |
Balai Lelang Serasi | 2011 | Jakarta, Indonesia |
Some of the Recent Competitor Trends and Key Information About Competitors Include:
OLX Autos: OLX Autos has positioned itself as a high-volume, data-driven used car platform, focusing on rapid price discovery, standardized inspections, and fast liquidity for sellers. Its competitive strength lies in nationwide reach, strong consumer brand recall, and integration with financing partners, enabling faster transaction closure in urban markets.
Mobil88 (Astra Group): Mobil88 benefits from Astra’s deep automotive ecosystem, strong sourcing access, and long-standing trust among Indonesian buyers. The brand competes strongly in the certified used car segment, emphasizing vehicle quality assurance, transparent documentation, and resale value—particularly for Japanese brands with high market acceptance.
Carro: Carro has expanded aggressively in Indonesia by leveraging technology-led inspection, centralized refurbishment, and cross-border operational learnings from other Southeast Asian markets. The platform differentiates through pricing analytics, inventory optimization, and a focus on improving dealer productivity alongside direct consumer sales.
Carsome: Carsome’s strategy centers on supply-side aggregation and auction-led price discovery, enabling efficient vehicle sourcing from individual sellers and corporates. Its competitive positioning is reinforced by operational scale, refurbishment infrastructure, and growing downstream retail capabilities in select markets.
OEM-Certified Programs (Toyota Trust, Honda Certified Used Cars): OEM-backed programs continue to attract buyers seeking lower risk and higher confidence. These programs compete on warranty coverage, standardized inspection protocols, and strong after-sales support, making them particularly attractive to urban middle-income households and upgrade buyers.
What Lies Ahead for Indonesia Used Automobiles Market?
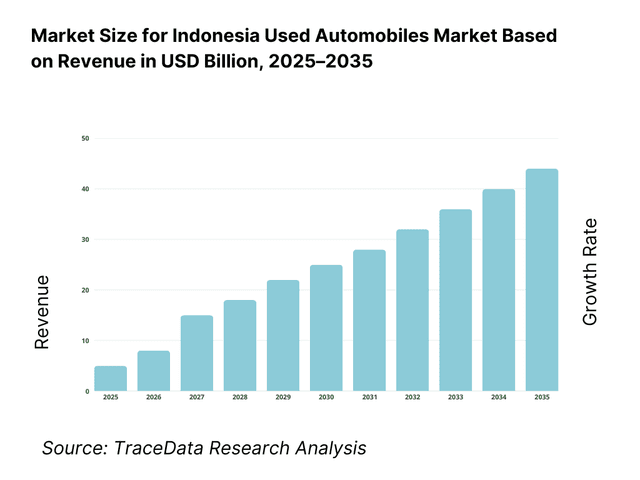
The Indonesia used automobiles market is expected to expand steadily by 2035, supported by a widening affordability gap versus new cars, rising middle-income households, improving access to used car financing, and rapid formalization through organized digital marketplaces and certified dealer networks. Growth momentum is further enhanced by increasing urbanization beyond tier-1 metros, higher mobility needs in secondary cities, and improving transaction transparency through inspection-led sales models. As buyers increasingly prioritize trusted vehicle condition, clear documentation, and financing convenience, the used automobiles market will continue shifting from fragmented, relationship-driven trade toward more structured, platform-enabled and dealer-certified transactions.
Transition Toward More Organized, Inspection-Led, and Warranty-Backed Used Car Purchases: The future of the Indonesia used automobiles market will see a continued move away from purely informal transactions toward standardized inspections, refurbishment-led quality assurance, and limited warranties offered by organized platforms and certified dealer programs. Buyers are increasingly willing to pay a premium for vehicles with verified mileage, clear ownership history, and documented condition reports. This trend will strengthen the role of players that control inspection infrastructure, reconditioning capabilities, and after-sales support—particularly for high-demand SUV/MPV segments where ticket sizes are larger and buyer risk sensitivity is higher.
Growing Emphasis on Financing Integration, Faster Approvals, and Bundled Offerings: Used car financing will become a stronger demand catalyst through 2035, with lenders and platforms building more integrated journeys combining loan approvals, insurance, and ownership transfer services. Faster credit decisioning, improved vehicle valuation models, and stronger fraud checks will increase conversion rates and expand access for self-employed and informal-sector buyers. Players that bundle financing + insurance + warranty into a single monthly payment proposition are likely to increase affordability perception and strengthen customer stickiness.
Shift Toward SUVs/MPVs and Practical Mobility Across Java and Key Secondary Regions: Demand will continue to tilt toward SUVs and MPVs due to Indonesian family mobility needs, mixed road conditions, and preference for multi-purpose vehicles that work for both daily commuting and inter-city travel. Beyond Jakarta and West Java, growth will increasingly come from secondary clusters across Java, Sumatra, and Kalimantan where personal mobility remains essential and organized supply is still scaling. This shift will also influence inventory sourcing strategies, with higher competition for popular models in the 2–6-year age bracket.
Increased Use of Data-Driven Pricing, Trade-In Programs, and Faster Inventory Turn Models: Digitalization will accelerate across the used car value chain, with greater use of AI-based pricing benchmarks, automated lead scoring, and faster inventory turnover playbooks. Trade-ins will become a bigger sourcing channel as dealers and platforms encourage upgrade cycles through assured buyback and exchange programs. This will reduce sourcing dependency on fragmented wholesale markets and enable more predictable inventory flow—especially for platforms targeting nationwide scale.
Indonesia Used Automobiles Market Segmentation
By Vehicle Type
• SUVs & MPVs
• Hatchbacks
• Sedans
• Pickup Trucks & Utility Vehicles
By Fuel Type
• Petrol
• Diesel
• Hybrid
• Electric
By Sales Channel
• Organized Digital Platforms
• Independent Used Car Dealers
• OEM-Certified Used Car Programs
• Consumer-to-Consumer (C2C)
• Auctions
By Vehicle Age Bracket
• 0–2 Years
• 3–5 Years
• 6–10 Years
• >10 Years
By Buyer Profile
• First-Time Buyers
• Upgrade / Replacement Buyers
• Fleet & Commercial Buyers
By Region
• Java
• Sumatra
• Kalimantan
• Sulawesi
• Eastern Indonesia
Players Mentioned in the Report:
• OLX Autos and other organized used car marketplaces
• Astra Group used car ecosystem (Mobil88, Astra-linked channels)
• OEM-certified used car programs (Toyota Trust, Honda Certified Used Car, and other brand-led programs)
• Regional dealer groups and organized multi-branch used car retailers
• Independent used car dealers, wholesale traders, and auction ecosystem participants
Key Target Audience
• Used car digital marketplaces and integrated auto platforms
• OEMs and authorized dealer groups operating certified used car programs
• Independent used car dealers and regional dealer chains
• Banks, NBFIs, and auto finance companies offering used car loans
• Auto insurers and warranty providers serving pre-owned vehicles
• Auction houses, wholesalers, and vehicle remarketing operators
• Fleet owners, ride-hailing driver communities, and SME commercial vehicle users
• Automotive service, refurbishment, and inspection ecosystem players
• Investors and strategic buyers evaluating used mobility platforms and dealer roll-ups
Time Period:
Historical Period: 2019–2024
Base Year: 2025
Forecast Period: 2025–2035
Explore Flexible Purchase Options or Have Limited Budget?
Pay only for relevant chapters • Customizable report sections
Table of Contents
Choose individual sections to purchase. Mix and match as you like.
4. 1 Delivery Model Analysis for Used Automobile Transactions-Organized Digital Platforms, OEM-Certified Dealers, Independent Dealers, Auctions, C2C [Margins, Preference, Strength & Weakness]
4. 2 Revenue Streams for Indonesia Used Automobiles Market [Vehicle Sales Margin, Financing Commissions, Insurance & Warranty, Refurbishment Services, Logistics & Ancillary Fees]
4. 3 Business Model Canvas for Indonesia Used Automobiles Market [Key Partners, Key Activities, Value Propositions, Customer Segments, Cost Structure, Revenue Streams]
5. 1 Local Players vs Regional & Global Platforms [Local Dealers vs Regional Marketplaces]
5. 2 Investment Model in Indonesia Used Automobiles Market [Strategic Investments, VC Funding, PE Investments, OEM-Backed Expansion]
5. 3 Comparative Analysis of Used Automobile Purchases by Individual vs Fleet Buyers [Procurement Models, Use Patterns, ROI Benchmarks]
5. 4 Budget Allocation by Buyer Profile [First-Time Buyers, Upgrade Buyers, Fleet & Commercial Buyers]
8. 1 Transaction Value (Historical Trend)
9. 1 By Market Structure (Organized vs Unorganized Used Car Market)
9. 2 By Vehicle Type (SUVs & MPVs, Hatchbacks, Sedans, Utility Vehicles)
9. 3 By Fuel Type (Petrol, Diesel, Hybrid, Electric)
9. 4 By Buyer Profile (First-Time Buyers, Upgrade Buyers, Fleet & Commercial Buyers)
9. 5 By Vehicle Age Bracket (0-2 Years, 3-5 Years, 6-10 Years, >10 Years)
9. 6 By Sales Channel (Digital Platforms, OEM-Certified Dealers, Independent Dealers, Auctions, C2C)
9. 7 By Financed vs Cash Purchases
9. 8 By Region (Java, Sumatra, Kalimantan, Sulawesi, Eastern Indonesia)
10. 1 Buyer Landscape and Cohort Analysis
10. 2 Purchase Drivers & Decision-Making Process
10. 3 Cost of Ownership & Value Assessment
10. 4 Gap Analysis Framework
11. 1 Trends & Developments in Indonesia Used Automobiles Market
11. 2 Growth Drivers for Indonesia Used Automobiles Market
11. 3 SWOT Analysis for Indonesia Used Automobiles Market
11. 4 Issues & Challenges for Indonesia Used Automobiles Market
11. 5 Government Regulations for Indonesia Used Automobiles Market
12. 1 Market Size and Future Potential for Online Used Car Platforms in Indonesia
12. 2 Business Models & Revenue Streams [Marketplace Margin, Full-Stack Retail, Auction-Led Models]
12. 3 Delivery Models & Services Offered [Inspection-Led Sales, Refurbishment, Financing & Warranty Bundles]
15. 1 Market Share of Key Players in Indonesia Used Automobiles Market (By Transaction Value)
15. 2 Benchmark of Key Competitors [Company Overview, USP, Business Strategies, Business Model, Network Size, Revenues, Pricing Models, Vehicle Categories, Major Buyer Segments, Strategic Tie-ups, Marketing Strategy, Recent Developments]
15. 3 Operating Model Analysis Framework
15. 4 Competitive Positioning Matrix for Used Automobile Platforms
15. 5 Bowman’s Strategic Clock for Competitive Advantage
16. 1 Transaction Value (Projections)
17. 1 By Market Structure (Organized and Unorganized Used Car Market)
17. 2 By Vehicle Type (SUVs & MPVs, Hatchbacks, Sedans, Utility Vehicles)
17. 3 By Fuel Type (Petrol, Diesel, Hybrid, Electric)
17. 4 By Buyer Profile (First-Time Buyers, Upgrade Buyers, Fleet & Commercial Buyers)
17. 5 By Vehicle Age Bracket (0-2 Years, 3-5 Years, 6-10 Years, >10 Years)
17. 6 By Sales Channel (Digital, Dealer, Auction, C2C)
17. 7 By Financed vs Cash Purchases
17. 8 By Region (Java, Sumatra, Kalimantan, Sulawesi, Eastern Indonesia)
Discuss a Customized Research Scope
Custom research scope • Tailored insights • Industry expertise
Research Methodology
Step 1: Ecosystem Creation
We begin by mapping the complete ecosystem of the Indonesia Used Automobiles Market across demand-side and supply-side entities. On the demand side, entities include first-time car buyers, upgrade/replacement buyers, salaried urban households, self-employed and informal-sector buyers, SME owners, ride-hailing and mobility drivers, fleet operators, and institutional buyers disposing and procuring vehicles. Demand is further segmented by purchase purpose (daily commute, family mobility, commercial usage), vehicle preference (SUV/MPV vs hatchback vs sedan), price band, vehicle age bracket, and financing reliance (cash vs loan-driven purchase).
On the supply side, the ecosystem includes organized used car digital platforms, OEM-certified used car programs, authorized dealer groups, independent used car dealers, wholesalers and traders, auction houses, fleet remarketing channels, inspection and refurbishment centers, logistics partners enabling inter-city vehicle movement, used car finance providers (banks and NBFIs), insurers and warranty providers, and registration/ownership transfer intermediaries. From this mapped ecosystem, we shortlist 6–10 leading organized players and a representative set of regional dealer clusters based on scale of inventory flow, geographic coverage, brand trust, inspection depth, financing integration, and presence in high-demand segments such as SUVs/MPVs. This step establishes how value is created and captured across sourcing, inspection, refurbishment, listing/lead generation, financing, transaction execution, and post-sale support.
Step 2: Desk Research
An exhaustive desk research process is undertaken to analyze the Indonesia used automobiles market structure, demand drivers, and segment behavior. This includes reviewing Indonesia’s automotive sales cycles and their impact on used inventory supply, household affordability dynamics, interest rate and credit penetration trends, and shifts in consumer preferences by vehicle category. We assess how pricing benchmarks evolve by age bracket and region, and how transaction trust factors—inspection quality, documentation clarity, warranty availability, and brand credibility—shape channel selection.
Company-level analysis includes review of digital platform service models (inspection-led vs listing-led), refurbishment and logistics capabilities, financing partnerships, warranty and return policies, and regional expansion patterns. We also examine the regulatory and process environment affecting transaction friction, including ownership transfer requirements, tax and fee structures, and documentation compliance norms. The outcome of this stage is a comprehensive industry foundation that defines the segmentation logic and creates the assumptions needed for market estimation and future outlook modeling through 2035.
Step 3: Primary Research
We conduct structured interviews with used car digital platforms, OEM-certified program managers, authorized dealer groups, independent dealers, auction operators, wholesalers, lenders and NBFIs, insurers/warranty providers, and vehicle inspection/refurbishment operators. The objectives are threefold: (a) validate assumptions around demand concentration, pricing drivers, and the role of financing in purchase conversion, (b) authenticate segment splits by vehicle type, fuel type, channel, buyer profile, and region, and (c) gather qualitative insights on inventory sourcing constraints, refurbishment economics, fraud risks, documentation bottlenecks, and buyer trust requirements.
A bottom-to-top approach is applied by estimating transaction volumes and average ticket size across key segments and regions, which are aggregated to develop the overall market view. In selected cases, disguised buyer-style interactions are conducted with dealers and platforms to validate field-level realities such as negotiation practices, inspection transparency, financing approval timelines, add-on attachment rates (insurance/warranty), and typical transaction completion time including ownership transfer.
Step 4: Sanity Check
The final stage integrates bottom-to-top and top-to-down approaches to cross-validate the market view, segmentation splits, and forecast assumptions. Demand estimates are reconciled with macro indicators such as vehicle parc growth, historical new car sales cycles, household income and credit penetration trends, and regional mobility needs. Assumptions around financing growth, platform-led formalization, and inventory availability in preferred age brackets (2–6 years) are stress-tested to understand their impact on pricing and transaction velocity.
Sensitivity analysis is conducted across key variables including interest rate movements, regulatory process simplification, fraud control effectiveness, digital adoption intensity, and the pace of hybrid/EV entry into the used ecosystem. Market models are refined until alignment is achieved between supply-side throughput (sourcing + refurbishment capacity + dealer/platform inventory turns) and demand-side purchase conversion dynamics, ensuring internal consistency and robust directional forecasting through 2035.
See What's Inside the Report
Get a preview of key findings, methodology and report coverage
Frequently Asked Questions
The Indonesia used automobiles market holds strong potential, supported by a widening affordability gap versus new vehicles, sustained mobility needs across Java and key secondary regions, and the continued expansion of used car financing. Market growth is further reinforced by formalization through organized digital platforms and certified dealer programs that improve trust, transparency, and transaction convenience. As inspection-led sales, warranty-backed offerings, and bundled financing/insurance models scale, the used car market is expected to capture higher value and greater transaction velocity through 2035.
The market features a mix of fast-scaling used car digital marketplaces, OEM-certified used car programs, large dealer groups, and a fragmented base of independent dealers and wholesalers. Competition is shaped by inventory sourcing strength, inspection and refurbishment capability, financing integration, customer experience, and geographic coverage. Organized players are increasingly differentiating through end-to-end transaction control—inspection, pricing, financing, documentation, and delivery—while local dealers remain competitive through price flexibility and regional relationships.
Key growth drivers include rising demand for affordable personal mobility, increasing penetration of used vehicle loans, and growing buyer preference for trusted, inspected, and documentation-complete purchases. Additional growth momentum comes from digital platform expansion, trade-in and upgrade cycles, improving inter-city logistics for vehicle movement, and higher demand for SUVs/MPVs due to family mobility needs. Over time, gradual adoption of used hybrids in metro areas is expected to add incremental demand in fuel-efficiency-driven segments.
Challenges include market fragmentation, inconsistent vehicle quality disclosure, fraud risks in informal channels, and transaction friction caused by documentation and ownership transfer timelines. Inventory shortages in the most demanded age brackets can create price inflation and reduce affordability, while financing risk perception can limit credit access for informal-sector buyers. For organized players, scaling inspection, refurbishment, and logistics across an archipelago adds operational complexity and cost pressure, requiring disciplined unit economics and strong ecosystem partnerships.
License Options
PDF + Excel
Complete report package
$4,000
Excel Only
Data and analytics
$2,500
Custom Sections
Starts from $100
$0