Israel Cold Chain Market Outlook to 2029
By Market Segments (Cold Storage and Cold Transportation), By End-User Industries (Food & Beverage, Pharmaceuticals, Retail, and Others), By Temperature Type (Chilled and Frozen), and By Region
Report Overview
Report Code
TDR0282
Coverage
Middle East
Published
September 2025
Pages
80
Flexible Purchase Options
Select and purchase only the chapters you need for your strategic decisions
On This Page
Report Overview
The report titled “Israel Cold Chain Market Outlook to 2029 – By Market Segments (Cold Storage and Cold Transportation), By End-User Industries (Food & Beverage, Pharmaceuticals, Retail, and Others), By Temperature Type (Chilled and Frozen), and By Region” provides a comprehensive analysis of the cold chain sector in Israel. The report covers the overview and genesis of the industry, overall market size in terms of revenue, segmentation by verticals and applications, trends and developments, regulatory landscape, customer profiling, issues and challenges, comparative landscape with competition analysis, cross-comparison of players, key opportunities and bottlenecks, and company profiling of major players in...
Report Coverage
Verified Market Sizing
Multi-layer forecasting with historical data and 5–10 year outlook
Deep-Dive Segmentation
Cross-sectional analysis by product type, end user, application and region
Competitive Benchmarking & Positioning
Market share, operating model, pricing and competition matrices
Actionable Insights & Risk Assessment
High-growth white spaces, underserved segments, technology disruptions and demand inflection points
Review Methodology & Data Structure
Preview report structure, data sources and research framework
Executive Summary
The report titled “Israel Cold Chain Market Outlook to 2029 – By Market Segments (Cold Storage and Cold Transportation), By End-User Industries (Food & Beverage, Pharmaceuticals, Retail, and Others), By Temperature Type (Chilled and Frozen), and By Region” provides a comprehensive analysis of the cold chain sector in Israel. The report covers the overview and genesis of the industry, overall market size in terms of revenue, segmentation by verticals and applications, trends and developments, regulatory landscape, customer profiling, issues and challenges, comparative landscape with competition analysis, cross-comparison of players, key opportunities and bottlenecks, and company profiling of major players in the Israel cold chain market. The report concludes with future projections based on industry revenues, by segment, region, temperature type, and includes success case studies highlighting opportunities and risk factors.
Israel Cold Chain Market Overview and Size
The Israel cold chain market was valued at USD 1.2 Billion in 2023, driven by increasing demand for temperature-sensitive food and pharmaceutical products, digital traceability regulations, and the modernization of storage and logistics infrastructure. Major players such as Amot Investments, FreezTech Logistics, Fridenson Logistics, DHL Israel, and Cargo Amerford have established robust cold chain networks across the country, catering to both domestic and export-oriented businesses.
In 2023, FreezTech Logistics added a new state-of-the-art frozen storage facility in Ashdod to support the rising demand from food exporters and pharma companies. Cities like Tel Aviv, Haifa, and Ashdod are key hotspots due to their proximity to ports, airports, and consumption centers.
%252C%25202019-2024.png&w=640&q=75)
What Factors are Leading to the Growth of Israel Cold Chain Market
Export-Focused Agriculture and Pharmaceuticals: Israel’s growing exports of citrus fruits, avocados, and pharmaceuticals necessitate highly reliable cold chains to preserve product integrity during long transits. In 2023, agricultural cold exports rose by 14% YoY.
Strict Regulatory Compliance: Stringent temperature monitoring regulations by the Israeli Ministry of Health and international standards (GDP for pharma, HACCP for food) are pushing investments into advanced refrigerated storage and IoT-enabled transport.
Technology Integration and Real-Time Monitoring: Adoption of smart sensors, RFID, and telematics for real-time temperature and location tracking is gaining traction. Major cold chain providers are investing in digital platforms to ensure visibility, traceability, and predictive maintenance.
Which Industry Challenges Have Impacted the Growth for Israel Cold Chain Market
High Energy Costs and Operational Expenses: The cold chain sector in Israel faces elevated electricity and fuel costs, which significantly affect profit margins. In 2023, energy accounted for nearly 35% of operating expenses in cold storage facilities. With fluctuating utility tariffs and limited subsidies for cold infrastructure, cost pressures continue to deter small-scale operators from scaling their capacities.
Limited Cold Chain Penetration in Rural and Peripheral Regions: While central regions like Tel Aviv and Haifa are well-equipped, the northern and southern peripheries such as the Negev Desert and Upper Galilee face limited cold chain access. As of 2023, less than 30% of agri-exports from peripheral regions had direct access to cold storage or pre-cooling facilities, leading to high post-harvest losses.
Technology Adoption Gap Among SMEs: Although Israel is known for its innovation, small and mid-sized cold chain operators still lag in adopting advanced cold monitoring and fleet optimization tools. A 2023 industry survey revealed that over 40% of cold transporters still used manual temperature logs without GPS-enabled systems, increasing the risk of spoilage and compliance failures.
What are the Regulations and Initiatives which have Governed the Market
Ministry of Health Cold Chain Compliance Mandate: Israel’s Ministry of Health enforces strict temperature compliance for pharmaceutical logistics, in line with WHO-GDP standards. In 2023, updated guidelines mandated real-time digital monitoring for all pharma shipments, leading to a 60% increase in IoT sensor adoption by key logistics firms.
National Food Security and Cold Chain Modernization Program (2022–2026): Under this initiative, the Israeli government has earmarked over ILS 400 Million to upgrade rural storage units, introduce solar-powered cold rooms, and expand cold chain access for agri-cooperatives. By end-2023, 18 new micro-cold hubs had been commissioned across underserved farming belts.
Green Cold Chain Tax Incentives: To promote sustainable logistics, Israel offers tax rebates of up to 20% on investments in energy-efficient refrigeration units, hybrid reefer trucks, and thermal insulation panels. Major cold logistics firms like Amot and Fridenson benefited from these policies to modernize their fleets and reduce emissions.
Israel Cold Chain Market Segmentation
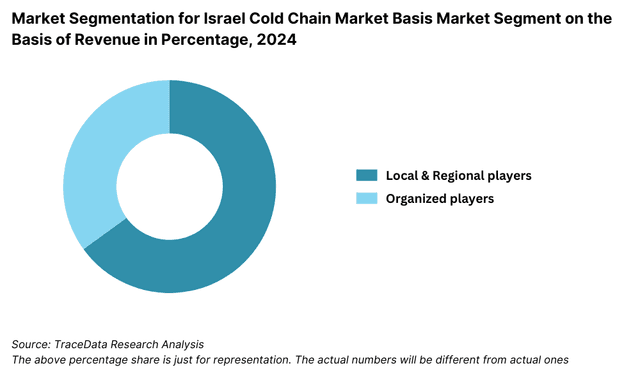
By Market Structure: The cold chain market in Israel is primarily led by local and regional service providers that have built strong capabilities around urban and agricultural zones. These SMEs specialize in temperature-controlled warehousing and short-haul deliveries, offering flexibility and cost efficiency. Their presence is critical in the food and agriculture sector. However, large-scale and organized players such as Fridenson, FreezTech Logistics, and DHL Israel are gaining market share, particularly in pharmaceuticals and high-value exports, owing to their investment in digital monitoring, GDP-compliant systems, and multi-temperature storage facilities. These organized players are preferred by global clients seeking regulatory assurance and scalability.
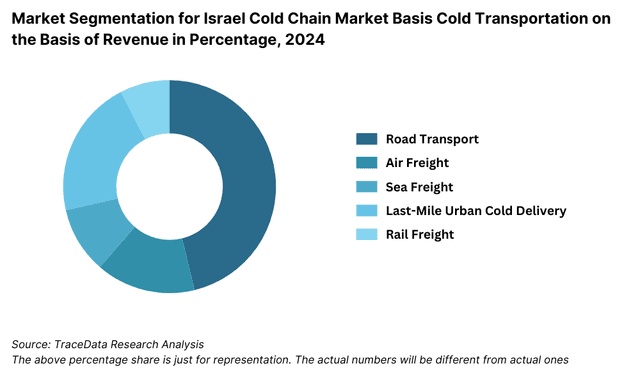
By Mode of Transport: Road transport forms the backbone of cold logistics in Israel, enabling fast movement of perishables and pharma products across major cities. Urban consolidation and same-day delivery requirements have intensified the need for refrigerated vans and trucks. Air freight plays a significant role in Israel’s pharmaceutical and fresh produce exports to Europe and North America, where time and compliance are critical. Maritime logistics through Haifa and Ashdod Ports supports the international movement of frozen and chilled goods via reefer containers. Rail transport plays a negligible role in cold chain activities due to limited temperature-controlled infrastructure.
By End-User Industry: The food & beverage sector leads cold chain consumption, owing to Israel’s extensive dairy, poultry, and fruit supply chains. Urban supermarkets and quick-commerce platforms also drive refrigerated warehousing demand. The pharmaceutical and biotech sector is a strong second, supported by export of high-value drugs, vaccines, and biologics requiring GDP-compliant logistics. Retail and online grocery players like Shufersal, Wolt, and Rami Levy have rapidly scaled cold storage and delivery partnerships to meet changing consumer habits. Other emerging sectors include floriculture, chemicals, and nutraceuticals which depend on reliable cold storage for export purposes.
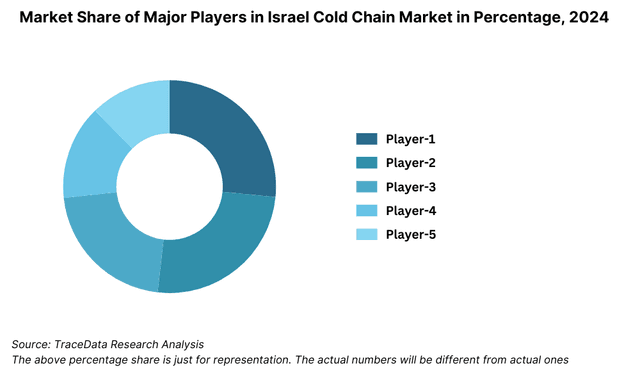
Competitive Landscape in Israel Cold Chain Market
The Israel cold chain market is moderately consolidated, with a mix of specialized local players and global logistics firms operating across storage and transportation services. While local companies dominate intra-country refrigerated logistics, multinational players are gaining ground in pharmaceutical and high-value perishable exports through investment in temperature monitoring and compliance infrastructure. The surge in e-commerce, healthcare logistics, and agro-exports is attracting tech-enabled entrants, intensifying competition and innovation across the sector.
Major Companies Operating in Israel Cold Chain Market
Company Name | Founding Year | Original Headquarters |
FreezTech Logistics | 2009 | Tel Aviv, Israel |
Fridenson Logistics | 1975 | Rishon LeZion, Israel |
Cargo Amerford | 1973 | Holon, Israel |
DHL Israel | 1969 (IL: ~1980s) | Bonn, Germany |
FedEx Israel | 1971 (IL: ~1990s) | Memphis, USA |
Unilog Israel | 1995 | Haifa, Israel |
Isfrost Ltd. | 2001 | Ashdod, Israel |
Amot Investments (Cold Facilities) | 1965 | Tel Aviv, Israel |
Maman Group (Cargo Division) | 1974 | Ben Gurion Airport, Israel |
Flying Cargo Group | 1982 | Lod, Israel |
Some of the Recent Competitor Trends and Key Information Include:
FreezTech Logistics: A major local player, FreezTech expanded its frozen storage capacity by 25% in 2023 with a new facility in Ashdod to support exports of frozen meat and seafood. The company also introduced a GPS-enabled cold fleet with real-time temperature alerts to ensure zero spoilage in transit.
Fridenson Logistics: Fridenson upgraded its pharma distribution network in 2023 by launching GDP-certified vehicles and digital inventory control systems. It also partnered with several biotech exporters to handle temperature-sensitive shipments to Europe.
Cargo Amerford: Focused on food logistics, the company opened a cross-dock center in Holon to consolidate and redistribute fresh produce more efficiently. In 2023, it processed over 50,000 tons of perishables, including citrus and dairy products.
DHL Israel: DHL continued to enhance its cold chain presence with a new multi-zone refrigerated warehouse near Ben Gurion Airport to cater to pharma and life sciences clients. The facility supports cross-border compliance and real-time visibility.
FedEx Israel: Expanded its temperature-controlled cargo handling at key air hubs, focusing on biomedical shipments and high-value temperature-sensitive goods. It also launched a pilot cold locker system in Tel Aviv for scheduled last-mile deliveries.
Unilog Israel: A growing logistics tech firm that integrated IoT-based cold monitoring sensors across its fleet in 2023. The company caters to online grocers and quick-commerce brands, offering sub-24-hour frozen delivery in the Tel Aviv–Haifa corridor.
Isfrost Ltd.: Specialized in cold storage for meat and seafood, Isfrost increased its automated racking systems and invested in solar-powered refrigeration units to cut energy costs by 18% in 2023.
Amot Investments: Through its industrial real estate arm, Amot manages over 400,000 sq. ft. of refrigerated space. In 2023, it initiated construction of a new cold storage logistics park in Be’er Sheva, targeting clients in agriculture and pharma.
What Lies Ahead for Israel Cold Chain Market?
The Israel cold chain market is projected to experience steady growth through 2029, supported by increasing demand for perishable exports, rising pharma logistics, digital integration, and government-backed cold infrastructure investments. The market is expected to register a healthy CAGR over the forecast period, driven by innovation, food security goals, and export-oriented strategies.
Growth in Pharmaceutical and Biotech Logistics: With Israel emerging as a global hub for biotech and pharmaceutical innovation, cold chain logistics will play a critical role in facilitating exports of high-value biologics, vaccines, and clinical trial materials. By 2029, the pharma cold chain segment is expected to grow by over 40%, supported by stricter GDP compliance and digital monitoring solutions.
Cold Chain Penetration in Agricultural Export Zones: Investments in micro cold storage hubs and farm-gate pre-cooling facilities in Northern and Southern Israel will enhance agri-export competitiveness. Regions like Galilee and the Negev are expected to benefit from solar-powered cold units and government-backed storage subsidies, reducing post-harvest losses and improving rural supply chains.
Integration of IoT and Predictive Analytics: Israel’s tech ecosystem is set to revolutionize cold logistics through adoption of smart sensors, blockchain-based traceability, and predictive analytics for spoilage prevention and inventory optimization. By 2029, it is projected that more than 60% of cold transport fleets will be equipped with real-time monitoring and route optimization systems.
Expansion of Urban Cold Fulfillment and Quick-Commerce: The growing demand for same-day and next-day delivery of frozen and chilled groceries is expected to accelerate the rise of urban cold micro-fulfillment centers. Companies like Wolt and Shufersal are likely to scale cold delivery infrastructure across Tel Aviv, Haifa, and Jerusalem to meet changing consumer behavior.
%252C%25202024-2030.png&w=640&q=75)
Israel Cold Chain Market Segmentation
• By Market Structure:
Cold Storage Providers
Refrigerated Transportation Operators
Temperature-Controlled 3PL Providers
Temperature-Controlled 4PL Coordinators
Express Cold Delivery Services
Contract Cold Chain Logistics Firms
Organized Cold Chain Sector
Unorganized/Traditional Cold Storage Operators
• By Mode of Transport:
Road-Based Refrigerated Transport
Air Freight (Pharma & Fresh Produce)
Sea Freight (Reefer Containers)
Multimodal Cold Chain Integration (Sea-Air/Road-Air)
• By End-User Industry:
Food & Beverage (Meat, Dairy, Frozen Foods)
Pharmaceuticals and Biotech
Online Grocery and Quick-Commerce
Agriculture and Perishables (Fruits, Vegetables)
Specialty Chemicals and Laboratory Samples
Floriculture and Horticulture Exports
• By Type of Cold Chain Storage:
Frozen Storage Facilities (< -18°C)
Chilled Storage Warehouses (0–8°C)
Multi-Temperature Warehouses
Last-Mile Cold Fulfillment Centers
Built-to-Spec Pharma-Compliant Facilities
Solar/Green Cold Chain Units (Rural/Agri)
• By Region:
Central Israel (Tel Aviv, Petah Tikva, Rishon LeZion)
Northern Israel (Haifa, Galilee, Jezreel Valley)
Southern Israel (Ashdod, Be’er Sheva, Eilat)
Jerusalem District
Coastal Logistics Belt (Ashdod–Haifa Corridor)
Players Mentioned in the Report
Cold Storage and Logistics Providers
FreezTech Logistics
Fridenson Logistics
Cargo Amerford
Isfrost Ltd.
Maman Cargo Division
Amot Investments (Industrial Cold Facilities)
Flying Cargo Group
Cold Transport and Express Delivery Firms
DHL Israel
FedEx Israel
Unilog Israel
UPS Israel
Wolt Cold Chain (Grocery Fulfillment)
Shufersal Logistics
Transclima Logistics
Key Target Audience
Cold Chain Logistics and Warehousing Companies
Food Processing and Export Companies
Biotech and Pharmaceutical Manufacturers
Grocery Retail and E-Commerce Platforms
Agriculture Cooperatives and Exporters
Technology and Telematics Providers
Regulatory Authorities (e.g., Ministry of Health, Ministry of Agriculture)
Private Equity and Infra Fund Investors
Market Research and Consulting Firms
Time Period
Historical Period: 2018–2023
Base Year: 2024
Forecast Period: 2024–2029
Explore Flexible Purchase Options or Have Limited Budget?
Pay only for relevant chapters • Customizable report sections
Table of Contents
Choose individual sections to purchase. Mix and match as you like.
4.1. Macroeconomic framework for Israel Including GDP (2018-2024), GDP Growth (2018-2024), GDP Contribution by Sector
4.2. Cold Chain Sector Contribution to GDP and how the contribution has been changing in the historical assessment
4.3. Ease of Doing Business in Israel
4.4. LPI Index of Israel and Improvements in the last 10-15 Years
4.5. Custom Procedure and Custom Charges in Israel Cold Chain Market
5.1. Landscape of Investment Parks and Cold Storage Zones in Israel
5.2. Current Scenario for Cold Chain Infrastructure in Israel
5.3. Road Infrastructure in Israel including Road Network, Toll Charges and Toll Network, Major Goods Traded through Road, Major Flow Corridors for Road (Inbound and Outbound)
5.4. Air Infrastructure in Israel including Total Volume Handled, FTK for Air Freight, Major Inbound and Outbound Flow Corridors, Major Goods traded through Air, Number of Commercial and Passenger Airports, Air Freight Volume by Ports and other Parameters
5.5. Sea Infrastructure in Israel including Total Volume Handled, FTK for Sea Freight, Major Inbound and Outbound Flow Corridors, Major Goods Traded through Sea, Number of Ports for Coastal and Ocean Freight, Number of Vessels, Sea Freight Volume by Ports and other Parameters
5.6. Rail Infrastructure in Israel including Total Volume Handled, FTK for Rail Freight, Major Inbound and Outbound Flow Corridors, Major Goods Traded through Rail and others
6.1. Basis Revenues, 2018-2024P
7.1. By Segment (Cold Storage, Cold Transportation, CEP and Value-Added Services), 2018-2024P
7.2. By End User Industries, 2018-2024P
8.1. Market Overview and Genesis
8.2. Israel Cold Transportation Market Size by Revenues, 2018-2024P
8.3. Israel 3PL Cold Transportation Market Segmentation, 2018-2024P
8.3.1. By Mode of Freight Transport (Road, Sea, Air and Rail), 2018-2024P
8.3.1.1. Price per FTK for Road/Air/Sea and Rail in Israel
8.3.1.2. Road Freight (Domestic and International Volume, FTK and Revenue; Number of Registered Vehicles)
8.3.1.3. Road Freight Domestic and International Corridors
8.3.1.4. Ocean Freight (Domestic and International Volume, FTK and Revenue; Volume by Commodity; Sea Ports Key Statistics)
8.3.1.5. Air Freight (Domestic and International Volume, FTK and Revenue)
8.3.1.6. Rail Freight (Domestic and International Volume, FTK and Revenue; Volume by Commodity and Region)
8.3.1.7. Export-Import Scenario (Value by Mode of Transport, Commodity and Country; Volume by Principal Commodities)
8.3.2. By Intercity Road Freight Corridors, 2018-2024P
8.3.3. By International Road Freight Corridors, 2018-2024P
8.3.4. By End User (Agriculture, Pharma, E-Grocery, Food & Beverage and Others), 2018-2024P
8.4. Snapshot of Cold Freight Aggregators in Israel Including Company Overview, USP, Business Strategies, Future Plans, Business Model, Number of Fleets, Margins/Commission, Number of Booking, Major Clients, Average Booking Amount, Major Routes and others
8.5. Competitive Landscape in Israel Cold Transportation Market, 2021
8.5.1. Heat Map of Major Players in Israel Cold Transportation on the Basis of Service offering
8.5.2. Market Share of Major Players in Israel Cold Transportation Market, 2023
8.5.3. Cross Comparison of Major Players in Cold Transportation Companies on the Basis of Parameters including Volume of Road Freight, Inception Year, Number of Fleets (Owned and Subcontracted), Fleets by Type, Occupancy Rate, Number of Employees, Major Route Network, Major Clients, Revenues, Volume of Sea Freight, Volume of Air Freight, USP, Business Strategy, Technology, (2023)
8.6. Israel 3PL Cold Transportation Future Market Size by Revenues, 2025-2029
8.7. Israel Cold Transportation Market Segmentation, 2025-2029
8.7.1. Future Market Segmentation by Mode of Freight Transport (Road, Sea, Air and Rail), 2025-2029
8.7.2. Future Market Segmentation by International Road Freight Corridors, 2025-2029
8.7.3. Future Market Segmentation by End User (Agriculture, Pharma, E-Grocery, Food & Beverage and Others), 2025-2029
9.1. Market Overview and Genesis
9.2. Value Chain Analysis in Israel Cold Storage Market including entities, margins, role of each entity, process flow, challenges and other aspects
9.3. Israel Cold Storage Market Size on the Basis of Revenues and Storage Capacity, 2018-2024P
9.4. Israel 3PL Cold Storage Segmentation
9.4.1. Israel Cold Storage Revenue by Business Model (Agri/Pharma/Retail/Quick-Commerce), 2018-2024P
9.4.2. Israel Cold Storage By Type of Warehouse (Frozen, Chilled, Multi-Temperature), 2018-2024P
9.4.3. Israel Cold Storage Revenue by End User (Agriculture, FMCG, Pharma, Retail and Others), 2018-2024P
9.4.4. 3PL Cold Storage Space by Region, 2024P
9.5. Competitive Landscape in Israel 3PL Cold Storage Market
9.5.1. Market Share of Top 10 Companies in Israel Cold Storage Market, 2023
9.5.2. Cross Comparison of Top 10 3PL Cold Storage Companies on the Basis of Parameters including Company Overview, USP, Business Strategy, Future Plans, Technology, Revenues from Cold Storage, Number of Warehouses, Storage Capacity, Location of Warehouses, Type of Warehouses, Occupancy Rate, Rental Rates, Clients and others, (2023)
9.6. Israel Cold Storage Future Market Size on the Basis of Revenues, 2025-2029
9.7. Israel Cold Storage Market Future Segmentation
9.7.1. Israel Cold Storage Revenue by Business Model (Agri/Pharma/Retail/Quick-Commerce), 2025-2029
9.7.2. Israel Cold Storage Revenue By Type of Warehouse (Frozen, Chilled, Multi-Temperature), 2025-2029
9.7.3. Israel Cold Storage Revenue by End User (Agriculture, FMCG, Pharma, Retail and Others), 2025-2029
10.1. Customer Cohort Analysis and End User Paradigm for Different Verticals (Pharma, E-Grocery, Agriculture, F&B, Retail, Chemicals)
10.2. Understanding on Cold Chain Spend by End User, 2023-2024P
10.3. End User Preferences in terms of In-House or Outsourcing Cold Chain Services and Reason for Selection; Segregate this by Size of Company on the Basis of Revenues
10.4. Major Cold Chain Companies Specialized in Serving Each Type of End User
10.5. Detailed Landscape of Each End User across Parameters including Major Products, Emerging Needs, Type of Services Required, Major Companies, Contract Duration, Facilities Required, Future Outlook, Market Size with Growth Rate, 2018-2024P
11.1. Basis Revenues, 2025-2029
12.1. By Segment (Cold Storage, Cold Transportation, CEP and Value-Added Services), 2025-2029
12.2. By End User Industries, 2025-2029
12.3. Recommendation
12.4. Opportunity Analysis
Discuss a Customized Research Scope
Custom research scope • Tailored insights • Industry expertise
Research Methodology
Step 1: Ecosystem Creation
Map the ecosystem and identify all relevant demand-side entities such as agriculture exporters, food processors, online grocery platforms, pharmaceutical manufacturers, and biotech firms. On the supply side, we include cold storage providers, refrigerated transport companies, last-mile cold logistics firms, 3PLs, and temperature-controlled warehouse operators active in Israel.
Based on this mapping, we shortlist 6–8 leading cold chain logistics and warehousing companies in Israel using selection criteria including market presence, storage capacity, fleet size, service vertical integration, and technology adoption levels.
Sourcing is carried out through industry portals, company press releases, news articles, public filings, and proprietary market databases to perform desk research and gather ecosystem-level data.
Step 2: Desk Research
Comprehensive secondary research is conducted using information from the Israeli Ministry of Agriculture, Ministry of Health (for pharma compliance), Israel Export Institute, World Bank Logistics Performance Index, and sector-specific publications from the Cold Chain Federation and Pharma Logistics associations.
Key variables assessed include market size, segment-wise growth (storage vs. transport), infrastructure investments, regulatory norms, operating cost benchmarks, and pricing trends.
Company-level intelligence is gathered through financial statements, investor presentations, annual reports, and third-party industry trackers, enabling detailed profiling of players and operational metrics.
Step 3: Primary Research
In-depth interviews are conducted with senior executives of cold chain logistics providers, pharma logistics heads, agriculture co-op managers, e-grocery fulfillment heads, and industry consultants to validate findings and capture ground realities.
These conversations help identify service gaps, pricing dynamics, cold infrastructure deficits, and client expectations from logistics partners.
A layer of mystery shopping is undertaken to cross-validate claims around fleet sizes, refrigeration capabilities, warehouse types, last-mile performance, and real-time tracking infrastructure.
Market estimates are built using a bottom-up approach, aggregating segment-wise and regional data. This is complemented by top-down triangulation, using macro indicators and cold chain-dependent industry revenues for validation.
Step 4: Sanity Check
Final outputs are validated using cross-modeling techniques (bottom-up + top-down), industry ratio checks, and alignment with GDP, population growth, export mix, and energy cost trends.
Peer benchmarking with other developed cold chain markets (e.g., Netherlands, Singapore, UAE) is conducted to assess efficiency ratios, capacity utilization benchmarks, and sustainability adoption.
Forecast models are stress-tested with scenario analysis based on regulatory shifts, energy policy, and cold chain subsidies announced by the Israeli government.
See What's Inside the Report
Get a preview of key findings, methodology and report coverage
Frequently Asked Questions
The Israel cold chain market is poised for significant growth, projected to reach a valuation of over USD 2 Billion by 2029. This growth is driven by rising demand for temperature-sensitive logistics across pharmaceuticals, food exports, and e-commerce groceries. Israel’s focus on export-oriented agriculture, healthcare innovation, and digital infrastructure development is expected to further unlock the cold chain sector's full potential.
Leading players in the Israel cold chain industry include FreezTech Logistics, Fridenson Logistics, Cargo Amerford, DHL Israel, FedEx Israel, and Amot Investments. These companies dominate due to their specialized temperature-controlled facilities, compliance with global standards (GDP, HACCP), and integration of IoT-based real-time monitoring for pharma and perishable goods.
Key growth drivers include the expansion of pharmaceutical and biotech exports, digital transformation of cold chain systems, growth in online grocery and last-mile refrigerated delivery, and government-backed rural cold storage investments. Additionally, Israel’s increasing trade with Europe and North America requires high-compliance cold logistics for perishables and medical goods.
Major challenges include high operational costs due to energy prices, limited cold chain coverage in peripheral regions, and a shortage of trained cold chain technicians. Fragmented SME players with low tech adoption also create inconsistencies in service quality. Moreover, environmental regulations and sustainability targets will necessitate heavy investments in green cold infrastructure over the next few years.
License Options
PDF + Excel
Complete report package
$4,000
Excel Only
Data and analytics
$2,500
Custom Sections
Starts from $100
$0