Italy Smart Home Devices Market Outlook to 2030
By Device Category, By Connectivity/Protocol, By Use-Case Cluster, By Housing Type, By Sales & Delivery Channel, and By Region
Report Overview
Report Code
TDR0377
Coverage
Europe
Published
November 2025
Pages
80
Flexible Purchase Options
Select and purchase only the chapters you need for your strategic decisions
On This Page
Report Overview
The report titled “Italy Smart Home Devices Market Outlook to 2030 - By Device Category, By Connectivity/Protocol, By Use-Case Cluster, By Housing Type, By Sales & Delivery Channel, and By Region” provides a comprehensive analysis of the smart home devices market in Italy. The report covers an overview and genesis of the industry, overall market size in terms of revenue, market segmentation; trends and developments, regulatory landscape, customer level profiling, issues and challenges, and competitive landscape including competition scenario, cross-comparison, opportunities and bottlenecks, and company profiling of major players in the smart home devices market.
Report Coverage
Verified Market Sizing
Multi-layer forecasting with historical data and 5–10 year outlook
Deep-Dive Segmentation
Cross-sectional analysis by product type, end user, application and region
Competitive Benchmarking & Positioning
Market share, operating model, pricing and competition matrices
Actionable Insights & Risk Assessment
High-growth white spaces, underserved segments, technology disruptions and demand inflection points
Review Methodology & Data Structure
Preview report structure, data sources and research framework
Executive Summary
The report titled “Italy Smart Home Devices Market Outlook to 2030 - By Device Category, By Connectivity/Protocol, By Use-Case Cluster, By Housing Type, By Sales & Delivery Channel, and By Region” provides a comprehensive analysis of the smart home devices market in Italy. The report covers an overview and genesis of the industry, overall market size in terms of revenue, market segmentation; trends and developments, regulatory landscape, customer level profiling, issues and challenges, and competitive landscape including competition scenario, cross-comparison, opportunities and bottlenecks, and company profiling of major players in the smart home devices market. The report concludes with future market projections based on device shipments, connectivity technologies, use-case clusters, regions, cause-and-effect relationships, and success case studies highlighting the major opportunities and cautions.
Italy Smart Home Devices Market Overview and Size
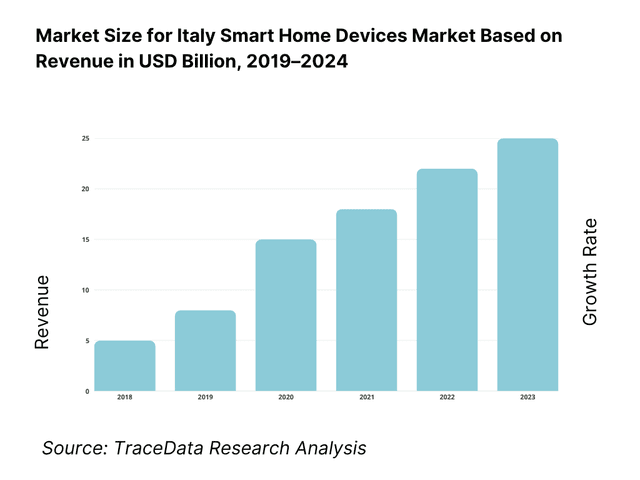
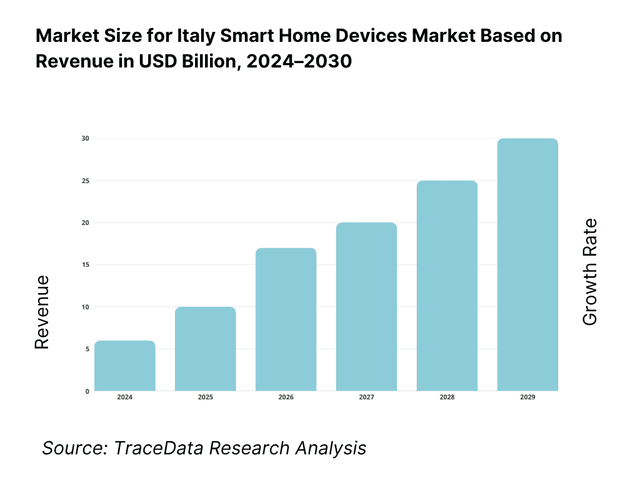
The Italy smart home devices market is valued at USD 3.39 billion in 2024. This level of revenue is driven by rising home broadband penetration, expanding FTTH infrastructure, increasing consumer interest in energy efficiency (especially via subsidies like Ecobonus/Bonus Casa), and retrofit-friendly wireless device offerings that reduce installation friction. In 2024, continued momentum in home automation, coupled with greater awareness of smart security and HVAC control, supports further growth.
Key cities and regions dominate Italy’s smart home adoption due to stronger per capita incomes, denser urban housing, and advanced infrastructure. The Milan / Lombardy area leads thanks to high disposable income, tech literacy, and early adoption culture. Rome and the Lazio region follow, driven by administrative headquarters of major utilities and telcos. The wealthy Northern cities such as Turin, Bologna, and Genoa also lead adoption, benefiting from better access to certified installers, retail showrooms, and service coverage.
What Factors are Leading to the Growth of the Italy Smart Home Devices Market:
Dense digital rails and device addressability fueling adoption: Italy’s home automation landscape benefits from a vast and well-connected digital infrastructure that makes smart devices easier to deploy and manage. The country supports 18,945,300 fixed-broadband subscriptions, providing the backbone for hubs, cameras, and thermostats, while 108.5 million mobile SIMs enable continuous app-based control and remote access. On the energy front, the national grid’s 76.6 GW of installed renewable capacity drives daily fluctuations that increase the importance of home-level automation. These conditions establish a strong foundation for the widespread integration of smart thermostats, plugs, and storage orchestrators in Italian households.
Electrification and renewable variability increasing the value of home energy automation: Italy’s energy landscape, with 264 billion kWh of net electricity production and 76.6 GW of renewable generation, underscores the growing need for flexible residential energy management. The grid’s increasing reliance on weather-dependent sources like solar, which generated 36 TWh of power, calls for intelligent home systems capable of optimizing consumption and storage. Smart thermostats, EV chargers, and load controllers allow homeowners to respond automatically to fluctuating supply and time-of-use tariffs. As utilities and telcos bundle these devices with service contracts, homes are evolving into active participants in grid stability and national decarbonization goals.
Large, aging residential base with persistent electrification needs and shrinking household size: Italy’s 58,934,000 residents and declining household size of 2.2 persons create a broad retrofit opportunity for wireless and plug-and-play smart home devices. The country’s housing stock—dominated by older apartments and detached homes—presents strong demand for non-invasive upgrades that enhance safety, energy efficiency, and comfort. Monthly winter power demand reaching 26.9 billion kWh demonstrates the scale of electrification needs in residential spaces. With nationwide mobile connectivity supporting app-based monitoring, retrofit-friendly devices such as smart lighting, thermostats, and leak detectors are being rapidly adopted to modernize traditional Italian homes.
Which Industry Challenges Have Impacted the Growth of the Italy Smart Home Devices Market:
Demographic headwinds and skills/logistics constraints in installation and after-sales: An aging population and declining workforce availability pose long-term service and maintenance challenges for Italy’s smart home expansion. With 58,934,000 residents and only 370,000 annual births, the labor force capable of performing installations and technical support continues to shrink. Seasonal peaks in electricity demand, averaging 26.9 billion kWh in January, further pressure the limited pool of certified HVAC and electrical installers. This imbalance highlights the need for scalable installer training programs, remote diagnostics, and self-install kits to maintain the pace of device rollouts nationwide.
GDPR enforcement risk raising compliance costs for video, voice, and telemetry: Data privacy compliance represents a significant operational burden for vendors of connected devices. Recent enforcement actions totaling €79.1 million in penalties demonstrate the seriousness of Italy’s regulatory stance. Home cameras, voice assistants, and telemetry systems handling sensitive data must meet strict transparency, consent, and data storage requirements. With over 108 million SIM connections enabling 24/7 connectivity, companies are investing heavily in privacy-by-design architectures and secure regional cloud storage to mitigate the risk of sanctions and build user trust in connected ecosystems.
Legacy housing fabric complicates deep retrofits despite high connectivity: While Italy’s digital and mobile infrastructure supports large-scale connectivity, its aging and historically protected building stock creates physical limitations for system integration. Many multi-dwelling units lack accessible wiring conduits or permissions for structural modifications, restricting hard-wired KNX and bus installations. Despite the national grid’s 264 billion kWh electricity flow and expanding renewable share, deep retrofit projects often face long lead times and high costs. This has pushed the market toward wireless and battery-free sensors, offering incremental modernization even in buildings where full rewiring or structural automation is impractical.
What are the Regulations and Initiatives which have Governed the Market:
ARERA supervision of distribution networks and second-generation smart metering: Italy’s energy regulator oversees more than 1,287,100 kilometers of electricity distribution infrastructure, ensuring metering interoperability and customer data accuracy. New mandates for second-generation smart meters aim to synchronize in-home devices with national energy management systems, allowing seamless data exchange with utilities. This oversight supports transparency, enhances consumer control over energy usage, and provides a technical backbone for the growing network of thermostats, load controllers, and energy dashboards integrated within Italian homes.
GDPR enforcement by Garante for home video, audio, and telemetry processing: Italy’s data protection authority continues to reinforce GDPR principles across smart home and IoT ecosystems. Regulatory enforcement targeting unauthorized data usage, voice recordings, and AI-driven profiling has led to multi-million-euro fines. These precedents compel manufacturers, cloud operators, and integrators to strengthen privacy measures—implementing robust consent mechanisms, encrypted local storage, and transparent data governance frameworks. Compliance with these standards has become a non-negotiable licensing condition for manufacturers entering or expanding within the Italian market.
Grid operations and renewable integration standards shaping device orchestration: The nation’s grid operations—comprising 264 billion kWh of domestic generation, 76.6 GW of renewable capacity, and 36 TWh of solar output—provide the framework for energy-responsive smart home devices. Integration standards now encourage two-way communication between household systems and grid operators, enabling residential participation in demand-response schemes. Alongside this, the telecommunications regulator maintains policies ensuring stable mobile and broadband access across 108.5 million active lines, allowing consistent real-time control of connected devices. These combined frameworks define the technical, operational, and policy landscape that governs Italy’s evolving smart home ecosystem.
Italy Smart Home Devices Market Segmentation
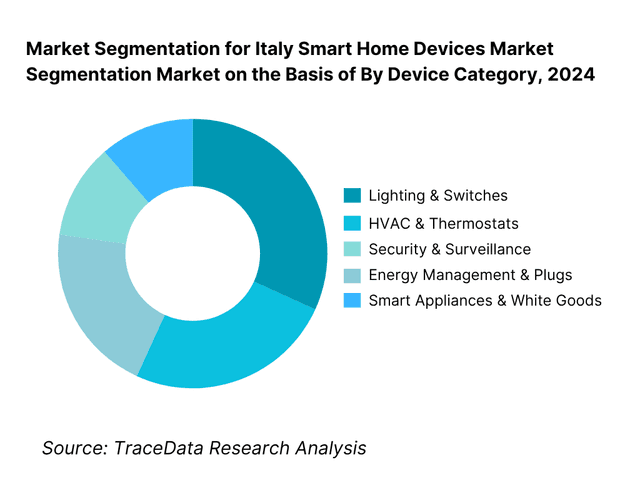
By Device Category: Lighting & Switches is the dominant sub-segment accounting for a large share of 2024 revenues (≈ 25 % of device revenues). Consumers tend to adopt entry-level, lower-cost smart bulbs and smart switches as their first point of entry into home automation. Because switching/lighting devices are ubiquitous in every room, require less intrusive installation, and offer visible “wow” effects (dimming, color, scenes), they attract earlier and broader adoption. Many OEMs bundle light kits with voice and control platforms, further boosting take-up.
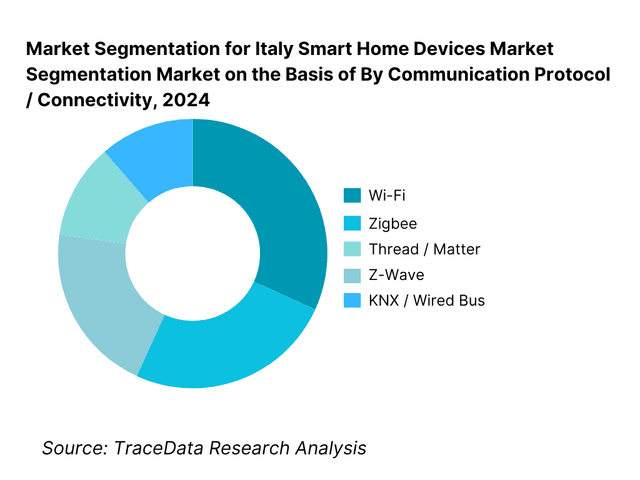
By Communication Protocol / Connectivity: Wi-Fi remains the dominant connectivity method with roughly 40 % share in 2024. Its dominance is because almost every home already has Wi-Fi infrastructure, eliminating additional gateway cost. Many consumer smart home devices ship Wi-Fi as default, which simplifies installation and lowers friction for end users unfamiliar with home automation. Some OEMs still require bridging for alternative protocols, but the ubiquity of Wi-Fi ensures broad compatibility and adoption.
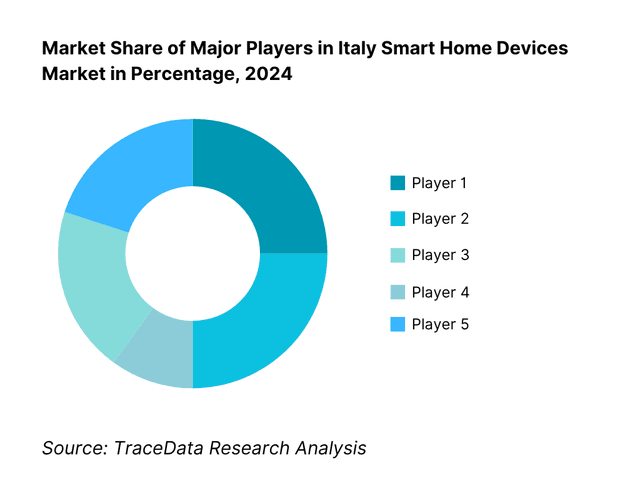
Competitive Landscape in Italy Smart Home Devices Market
The Italy smart home devices market is characterized by a mix of local electrical OEMs and global consumer electronics/IoT players. Major incumbents in Italy often leverage their installer networks, local electrical standards familiarity, and relationships with distributors. Global tech firms bring brand strength, scale, and software ecosystems. This duality leads to competitive tension in device Features, interoperability, and go-to-market models.
Name | Founding Year | Original Headquarters |
Legrand (BTicino) | 1904 | Limoges, France |
Vimar | 1945 | Marostica, Italy |
Gewiss | 1959 | Cenate Sotto, Italy |
ABB | 1988 | Zürich, Switzerland |
Schneider Electric | 1836 | Rueil-Malmaison, France |
Signify (Philips Lighting) | 1891 | Eindhoven, Netherlands |
Nice | 1993 | Oderzo, Italy |
Somfy | 1969 | Cluses, France |
Google (Nest) | 1998 | Mountain View, USA |
Amazon (Ring / Alexa) | 1994 | Seattle, USA |
Enel X | 2017 | Rome, Italy |
Xiaomi | 2010 | Beijing, China |
Verisure | 1988 | Geneva, Switzerland |
Samsung Electronics | 1969 | Suwon, South Korea |
Ariston Group | 1930 | Fabriano, Italy |
Some of the Recent Competitor Trends and Key Information About Competitors Include:
Legrand (BTicino): A long-standing leader in Italy’s electrical and smart home ecosystem, Legrand (through its BTicino brand) has expanded its “MyHOME Up” platform with full Matter protocol compatibility to improve device interoperability across multi-brand ecosystems. In 2024, the company strengthened partnerships with Italian energy service firms to integrate smart panels and connected switches into energy efficiency retrofits under the Ecobonus and Bonus Casa incentives, increasing adoption in both residential and commercial retrofit markets.
Vimar: Vimar introduced upgraded versions of its View Wireless system and By-Me Plus automation range, enabling seamless integration with popular voice assistants and offering enhanced app-based controls localized in Italian. The company also launched new smart modules for heritage and retrofit homes, a segment particularly relevant in Italy’s historic housing stock. Its continued investment in design aesthetics and installer-friendly systems has reinforced its strong domestic market presence.
Gewiss: In 2024, Gewiss advanced its JOINON e-mobility and smart energy management solutions, linking electric vehicle charging stations with home energy systems for demand optimization. The company’s Chorus Smart Home range gained traction among installers seeking robust, Italian-made wired and hybrid bus systems compliant with CEI standards. Gewiss has also focused on expanding digital tools for installers, including commissioning apps and remote diagnostics.
Signify (Philips Hue): Signify accelerated the rollout of Matter-compatible Philips Hue bridges and bulbs in the Italian market, aiming to simplify user onboarding and multi-brand interoperability. It also strengthened retail partnerships with MediaWorld and Unieuro to expand distribution beyond online channels. Continuous firmware updates have introduced energy monitoring and dynamic ambient features, aligning with Italy’s growing demand for energy-conscious lighting systems.
Enel X (Homix): The Enel X “Homix” platform continues to gain visibility as Italy’s only utility-backed smart home ecosystem, integrating thermostats, cameras, and lighting with Enel’s smart energy tariffs. In 2024, Enel X introduced AI-based comfort scheduling and new compatibility with voice assistants, aiming to capture consumers seeking unified control of home energy and automation through one service provider. Its close linkage to Enel’s retail electricity base provides a strategic distribution advantage across Italy’s residential market.
What Lies Ahead for Italy Smart Home Devices Market?
The Italy smart home devices market is projected to advance steadily toward 2030, underpinned by structural energy transitions, the spread of interoperable IoT standards, and a strong retrofit opportunity across its aging housing base. The country’s high broadband density and renewable-driven grid variability continue to create organic demand for automation, energy orchestration, and assisted living solutions.
Expansion of Interoperability through Matter and Thread Standards: The next phase of Italy’s smart home ecosystem will be defined by cross-platform interoperability. With 18.9 million fixed-broadband lines in service and 108.5 million active SIMs supporting pervasive connectivity, Italian households are ready for multi-brand ecosystems under the Matter protocol. Local OEMs such as BTicino (Legrand) and Vimar are aligning their product suites with global alliances to reduce vendor lock-in. This interoperability push will simplify installation, lower integration costs, and unlock higher device density per dwelling, allowing consumers to seamlessly connect lighting, heating, and security systems across brands.
Convergence of Smart Energy and Home Automation: Italy’s accelerating renewable penetration—with 76.6 GW of installed renewable capacity and 36 TWh of solar generation—creates a strong incentive for households to actively manage energy demand. Smart thermostats, plugs, and load controllers are increasingly integrated with time-of-use tariffs regulated by ARERA and distributed solar or storage systems. As utilities and telcos bundle connected devices with electricity and broadband contracts, homes will act as balancing nodes in Italy’s decarbonization path. This convergence will enhance grid stability, improve energy efficiency, and enable consumers to optimize electricity use in real time.
Growth in Assisted Living and Aging-in-Place Automation: Italy’s demographic profile, with 58.9 million residents and a median age above 47 years, positions assisted living as a key growth avenue for smart home adoption. Automation that supports safety, comfort, and remote monitoring—such as motion sensors, fall-detection systems, and voice-activated controls—is gaining traction among families caring for elderly relatives. National programs promoting independent living and digital healthcare integration are accelerating this trend. The combination of healthcare digitization, IoT infrastructure, and personalized care solutions will make assisted living automation one of the most transformative segments of Italy’s smart home market in the years ahead.
Italy Smart Home Devices Market Segmentation
By Device Category
Smart speakers & hubs
Thermostats & HVAC controls (zoning, heat-pump controllers)
Lighting & controls (bulbs, switches, dimmers, drivers)
Security & safety (cams, video doorbells, alarms, sensors, smart locks)
Energy management (smart plugs, sub-meters, load controllers, HEMS)
Shading & access (roller shutters, awnings, gates/garage)
Smart appliances (washers, ovens, fridges, robot vacuums)
Water & environment (leak/valve, IAQ, smoke/CO)
By Connectivity / Protocol
Wi-Fi
Zigbee
Thread / Matter
Z-Wave
Bluetooth / BLE Mesh
Wired bus (KNX, SCS/BTicino, Bacnet gateways)
By Use-Case Cluster
Energy orchestration & demand response (PV, storage, EV charging windows)
Safety & security monitoring
Comfort & lighting scenes / shading automation
Entertainment & voice assistance
Assisted living / telecare & wellness
Water management & leak prevention
By Housing / Property Type
Apartments & condomìni (multi-dwelling units)
Detached / semi-detached homes (villette)
New-builds (developer-installed)
Historic dwellings & protected buildings (centri storici)
Hospitality & short-let (B&B, boutique hotels)
By Sales & Delivery Channel
Pro-installer / electrical wholesaler route (Sonepar, Comet, etc.)
Consumer electronics retail (MediaWorld, Unieuro, Leroy Merlin)
E-commerce marketplaces (Amazon.it, OEM D2C)
Utility / telco bundles (Enel X, TIM, Vodafone, WindTre)
Builder / developer packages & condo administrator tenders
Players Mentioned in the Report:
Legrand (BTicino)
Vimar
Gewiss
ABB
Schneider Electric
Signify (Philips Hue)
Nice
Somfy
Google (Nest)
Amazon (Ring / Alexa)
Enel X (Homix)
Xiaomi
Verisure
Samsung
Ariston Group
Key Target Audience
Strategic business units at OEMs of smart home / electrical companies
Utilities and smart grid development divisions (e.g. Enel, Eni, Hera)
Telecom operators’ IoT/business units (e.g. TIM, Vodafone Italy)
Electrical distribution & wholesale groups (e.g. Sonepar Italia)
Real estate developers & condominium management groups
Renewable energy + home automation integrators / installers
Investments & venture capital firms (interested in IoT, smart energy)
Government & regulatory bodies
Time Period:
Historical Period: 2019-2024
Base Year: 2025
Forecast Period: 2025-2030
Explore Flexible Purchase Options or Have Limited Budget?
Pay only for relevant chapters • Customizable report sections
Table of Contents
Choose individual sections to purchase. Mix and match as you like.
4.1. Delivery Model Analysis for Smart Home Systems-(DIY, Installer-Led, Hybrid-Integrated, Utility-Bundled)
4.2. Revenue Streams for Italy Smart Home Devices Market
4.3. Business Model Canvas for Italy Smart Home Devices Market
5.1. DIY vs Professional Installer Mode
5.2. Investment Model in Italy Smart Home Devices Market
5.3. Comparative Analysis of Channel Funnel-Retail vs Utility vs Installer vs Marketplace
5.4. Consumer Budget Allocation for Smart Home Devices by Household Income Group
8.1. Revenues (EUR Billion)-Historical Performance and Growth Patterns
9.1. By Market Structure (In-House Systems and Outsourced Integrations)
9.2. By Device Type (Smart Speakers, Thermostats, Lighting, Security, Appliances)
9.3. By Application Cluster (Energy Management, Security, Comfort, Entertainment, Health & Assisted Living)
9.4. By Connectivity Standard (Wi-Fi, Zigbee, Thread, Z-Wave, Bluetooth Mesh, KNX)
9.5. By End-User Segment (Apartments, Villas, Condominiums, Small Businesses, Hospitality)
9.6. By Mode of Control (App-Based, Voice-Controlled, Automated Scheduling)
9.7. By Open vs Proprietary Ecosystems (Matter-Enabled, Legacy Systems)
9.8. By Region (North-West, North-East, Central, South, Islands)
10.1. Consumer Cohort Landscape-Demographic, Psychographic, and Behavioral Profiling
10.2. Smart Device Purchase Triggers and Decision-Making Process
10.3. Adoption Barriers, Trust Factors, and ROI Perception
10.4. User Experience (UX) & Post-Installation Feedback Analysis Framework
11.1. Trends and Developments
11.2. Growth Drivers
11.3. SWOT Analysis
11.4. Issues and Challenges
11.5. Government Regulations and Incentive Landscape
12.1. Market Size and Future Potential for Online Channels
12.2. Business Models and Revenue Streams (Direct-to-Consumer, Subscription Bundles, Marketplace Resellers)
12.3. Delivery Models and Type of Devices Offered (DIY kits, Plug-and-Play, Professional-Installed)
15.1. Market Share of Key Players (Basis Revenues, Installed Units)
15.2. Benchmark of Key Competitors (Company Overview, USP, Business Strategy, Product Breadth, Protocol Support, Installer Network, Italian-Language UX, Revenues, Technology Stack, Top Selling Devices, Strategic Partnerships, Marketing Campaigns, and Key Clients)
15.3. Operating Model Analysis Framework
15.4. Gartner Magic Quadrant Positioning
15.5. Bowman’s Strategic Clock for Competitive Advantage
16.1. Revenues (EUR Billion)-Forecasted Growth Trajectory and Key Catalysts
17.1. By Market Structure (In-House and Outsourced Integration)
17.2. By Device Type (Speakers, Lighting, Security, HVAC, Appliances)
17.3. By Application Cluster (Energy, Security, Comfort, Health, Entertainment)
17.4. By End-User Segment (Apartments, Villas, Condominiums, Hospitality)
17.5. By Connectivity Standard (Wi-Fi, Zigbee, Thread, KNX, BLE)
17.6. By Mode of Control (App, Voice, AI-Automated)
17.7. By Open vs Proprietary Systems (Matter vs Legacy)
17.8. By Region (North-West, North-East, Central, South, Islands)
Discuss a Customized Research Scope
Custom research scope • Tailored insights • Industry expertise
Research Methodology
Step 1: Ecosystem Creation
Map the ecosystem and identify all the demand-side and supply-side entities for the Italy Smart Home Devices Market. On the demand side, include homeowners, condominium associations, small and medium enterprises, hospitality operators, senior-care facilities, and public infrastructure integrators. On the supply side, include device OEMs (Legrand BTicino, Vimar, Gewiss, ABB, Schneider Electric, Nice, Somfy), platform providers (Google Nest, Amazon Alexa, Apple HomeKit), utilities (Enel X, Eni Plenitude), telcos (TIM, Vodafone, WindTre), certified installers, distributors (Sonepar, Comet), and online retail platforms (Amazon.it, MediaWorld, Unieuro). Based on this mapped ecosystem, shortlist the leading 5–6 manufacturers and integrators in Italy, considering financials, distribution coverage, and active client partnerships. Sourcing is conducted through industry articles, official publications (ARERA, Terna, AGCOM, Garante), company filings, and proprietary databases to collate industry-level insights and validate corporate footprints.
Step 2: Desk Research
Subsequently, engage in an exhaustive desk research process referencing diverse secondary and proprietary databases. This includes analyzing industry-level and company-level data such as annual reports, product catalogs, patent filings, certification listings (CE/RED/KNX), and regulatory documents. The research captures variables including installed device base, network connectivity density (18.9 million broadband lines; 108.5 million SIMs — World Bank & AGCOM), product segmentation (lighting, HVAC, security, energy management, appliances), channel structure (installer, retail, e-commerce, utility bundles), and compliance frameworks (ARERA, CEI, GDPR). This process builds the foundation of the market model, aligning revenue attribution across distribution channels, product lines, and technology stacks.
Step 3: Primary Research
Initiate a series of in-depth interviews with C-level executives, product heads, and sales managers from OEMs, utilities, and distributors operating in Italy. Conduct interviews with certified installers, utility innovation teams, and real-estate developers to validate market hypotheses and operational parameters. The interview program includes discussions with telco IoT units and consumer electronics retail managers. These interactions aim to authenticate shipment volumes, adoption ratios, channel margins, installation lead times, warranty claims, and after-sales service costs. A bottom-to-top approach is used to derive player-level revenues by multiplying installed units with average system value (hardware + install + cloud subscription). To strengthen verification, disguised interviews are performed with vendors and distributors under the guise of B2B clients. This allows validation of pricing ladders, installer commissions, and value-chain economics against publicly available data.
Step 4: Sanity Check
A bottom-to-top and top-to-bottom modeling exercise is undertaken to assess data reliability and ensure coherence between demand and supply indicators. Top-down validation: Cross-check total connected households, broadband penetration, and retail sell-out volumes from AGCOM and ISTAT data. Bottom-up validation: Aggregate OEM shipments, installer purchase orders, and e-commerce sell-through rates to ensure reconciliation with category totals. Sensitivity testing is conducted on critical variables such as protocol migration (Matter/Thread adoption), installer capacity constraints, and incentive utilization (Ecobonus, Bonus Casa). This multi-angle consistency check guarantees the final market sizing is robust, defensible, and grounded in validated operational data.
See What's Inside the Report
Get a preview of key findings, methodology and report coverage
Frequently Asked Questions
The Italy Smart Home Devices Market is positioned for sustained expansion, reaching a value of USD 3.39 billion in 2024. Growth is being driven by a combination of structural and policy factors — widespread broadband access with 18.9 million fixed broadband lines, rapid home electrification, and generous national incentives like Ecobonus and Bonus Casa that subsidize connected energy and automation upgrades. The market’s potential is reinforced by the convergence of home comfort, security, and energy management within Italy’s aging housing stock, creating robust demand for retrofit-friendly smart devices.
The Italy Smart Home Devices Market features a strong mix of domestic electrical OEMs and global technology platforms. Legrand (BTicino), Vimar, and Gewiss dominate the wired and hybrid control segment through deep installer networks and CEI-compliant product ranges. Global players like Signify (Philips Hue), ABB, and Schneider Electric bring advanced IoT-enabled systems aligned with EU interoperability standards. Meanwhile, digital ecosystem giants such as Google (Nest), Amazon (Alexa / Ring), and Samsung compete in the voice and cloud-based automation layers. Enel X (Homix) and Nice lead in energy-integrated and access-control solutions respectively, leveraging localized service support and regulatory alignment.
Several macroeconomic and policy forces underpin Italy’s smart home growth. The country’s 76.6 GW of renewable capacity and 36 TWh of solar generation have heightened demand for intelligent load management at the residential level. Broadband penetration with 18.9 million connections and mobile access with 108.5 million SIMs enable seamless device integration and app-based control. Government-backed building incentives such as Ecobonus and Bonus Casa, along with the national drive toward electrification of heating and mobility, continue to encourage household adoption of connected thermostats, lighting, and energy management systems.
The Italy Smart Home Devices Market faces challenges linked to infrastructure, demographics, and compliance. The country’s aging population of 58.9 million residents and small average household size of 2.2 persons strain installation capacity and raise service costs. Retrofitting historic buildings — many protected under cultural heritage codes — limits invasive wiring upgrades, slowing adoption of hard-wired systems. Additionally, stringent GDPR enforcement, including data misuse fines amounting to €79.1 million, compels vendors to invest heavily in data protection infrastructure, increasing operational costs and extending time-to-market for new connected products.
License Options
PDF + Excel
Complete report package
$4,000
Excel Only
Data and analytics
$2,500
Custom Sections
Starts from $100
$0