Japan Cold Chain Market Outlook to 2029
By Market Structure, By Applications, By Temperature Type, By End-Users, By Region, and By Technology Adoption
Report Overview
Report Code
TDR0185
Coverage
Asia
Published
May 2025
Pages
80
Flexible Purchase Options
Select and purchase only the chapters you need for your strategic decisions
On This Page
Report Overview
The report titled “Japan Cold Chain Market Outlook to 2029 – By Market Structure, By Applications, By Temperature Type, By End-Users, By Region, and By Technology Adoption” provides a comprehensive analysis of the cold chain logistics market in Japan. The report covers an overview and genesis of the industry, overall market size in terms of revenue, market segmentation; key trends and developments, regulatory ecosystem, customer preferences, operational bottlenecks, and comparative landscape including competition overview, market gaps, and profiling of major players in the Japan Cold Chain Market.
Report Coverage
Verified Market Sizing
Multi-layer forecasting with historical data and 5–10 year outlook
Deep-Dive Segmentation
Cross-sectional analysis by product type, end user, application and region
Competitive Benchmarking & Positioning
Market share, operating model, pricing and competition matrices
Actionable Insights & Risk Assessment
High-growth white spaces, underserved segments, technology disruptions and demand inflection points
Review Methodology & Data Structure
Preview report structure, data sources and research framework
Executive Summary
The report titled “Japan Cold Chain Market Outlook to 2029 – By Market Structure, By Applications, By Temperature Type, By End-Users, By Region, and By Technology Adoption” provides a comprehensive analysis of the cold chain logistics market in Japan. The report covers an overview and genesis of the industry, overall market size in terms of revenue, market segmentation; key trends and developments, regulatory ecosystem, customer preferences, operational bottlenecks, and comparative landscape including competition overview, market gaps, and profiling of major players in the Japan Cold Chain Market. The report concludes with future market projections based on revenue, by application, segment, region, demand drivers, challenges, and success case studies to highlight key opportunities and risks.
Japan Cold Chain Market Overview and Size
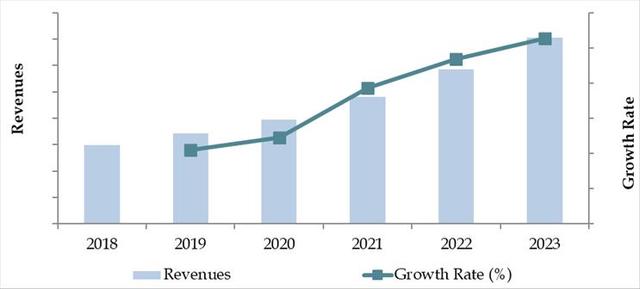
The Japan cold chain market reached a valuation of JPY 2.1 Trillion in 2023, driven by rising demand for temperature-sensitive food products, pharmaceuticals, and biotechnology goods. A growing aging population, high standards for food safety, and an expanding e-commerce grocery sector have further boosted demand for cold storage and transportation solutions.
Key players in the industry include Yamato Logistics, Nichirei Logistics, Sagawa Express, Mitsubishi Logistics, and AEON Logistics, known for their advanced warehousing systems, end-to-end temperature-controlled distribution networks, and strategic partnerships with healthcare and food retailers.
In 2023, Nichirei Logistics opened a fully automated cold storage facility in Tokyo Bay, leveraging AI and robotics to enhance warehouse efficiency and energy optimization. Major metropolitan regions such as Tokyo, Osaka, and Fukuoka are leading demand centers due to their dense population and high concentration of cold chain-dependent industries.
Market Size for Japan Cold Chain Industry on the Basis of Revenues in USD Million, 2018-2024
What Factors are Leading to the Growth of Japan Cold Chain Market:
Aging Population & Healthcare Demand: Japan’s aging demographic is fueling demand for pharmaceuticals, vaccines, and biologics, which require cold storage. In 2023, healthcare-related cold chain logistics grew at a CAGR of 6.8%.
Food Safety Regulations: Stringent food safety laws such as the Food Sanitation Act have forced supply chains to adopt cold chain logistics to preserve product integrity. The Ministry of Health, Labour and Welfare has enforced tighter controls on perishable goods distribution, especially seafood and dairy products.
Rising Demand from E-Grocery and Food Delivery: With nearly 45% of households using online grocery services by 2023, the demand for last-mile cold chain delivery surged, particularly in urban areas.
Which Industry Challenges Have Impacted the Growth for Japan Cold Chain Market
High Operational Costs: The cold chain industry in Japan faces significant cost pressures due to the high cost of electricity, fuel, and real estate. In 2023, energy expenditures accounted for nearly 30% of the total operational costs for refrigerated warehouses, posing a major challenge for scalability and profit margins, particularly for small and mid-sized operators.
Workforce Shortages: Japan's aging population and shrinking labor force have created labor shortages in the logistics sector. It was reported that nearly 40% of cold chain logistics firms struggled with insufficient drivers and warehouse staff in 2023. This constraint hampers efficiency, increases delivery times, and forces companies to invest more heavily in automation.
Infrastructure Constraints in Rural Areas: While urban cold chain networks are well-developed, rural and remote regions lack the necessary infrastructure, resulting in product spoilage and longer lead times. As of 2023, only 45% of Japan’s cold storage capacity was accessible in tier-2 and tier-3 cities, limiting regional market penetration.
What are the Regulations and Initiatives which have Governed the Market
Food Sanitation Law & HACCP Compliance: The Ministry of Health, Labour and Welfare mandates HACCP (Hazard Analysis and Critical Control Points) compliance for all food-related businesses, including cold chain operators. In 2023, over 90% of large-scale cold storage facilities were HACCP-certified, ensuring safety and hygiene throughout the cold chain.
Pharmaceutical Logistics Standards: Japan enforces strict Good Distribution Practice (GDP) guidelines for pharmaceutical cold chain logistics. These regulations ensure consistent temperature control and product integrity. In 2023, approximately 70% of cold chain service providers offering pharma logistics were GDP-compliant, a number expected to increase with ongoing investments.
Government Push for Carbon-Neutral Logistics: As part of its 2050 carbon neutrality goal, Japan’s government offers incentives for green logistics, including subsidies for EV refrigerated trucks and energy-efficient cold storage systems. In FY 2023, nearly JPY 4.5 billion was allocated to promote sustainable cold chain infrastructure, encouraging players to transition to eco-friendly operations.
Japan Cold Chain Market Segmentation
By Market Structure: The organized segment dominates Japan’s cold chain market due to strict quality compliance, technology integration, and established infrastructure. Large logistics providers such as Yamato, Sagawa, and Nichirei Logistics offer end-to-end cold storage and transport with real-time tracking, HACCP/GDP certifications, and automated warehouse systems. The unorganized segment, comprising smaller regional players, still holds presence in rural areas but faces challenges such as outdated facilities and limited scalability.
By Application: The food industry remains the dominant application for cold chain logistics in Japan, accounting for the majority share due to the country’s strong seafood, dairy, and processed food sectors. The pharmaceutical segment is rapidly growing, driven by biologics, vaccines, and the demand for temperature-controlled medical logistics post-COVID. E-commerce groceries and frozen meal delivery services have also emerged as fast-growing applications.
By Temperature Type: The chilled segment leads the market, primarily used for dairy, fresh produce, and seafood. However, the frozen segment is gaining traction, especially for processed food and vaccine storage. Ultra-low temperature segments, such as -70°C storage for mRNA-based vaccines, though niche, have seen capacity expansion in recent years.
Competitive Landscape in Japan Cold Chain Market
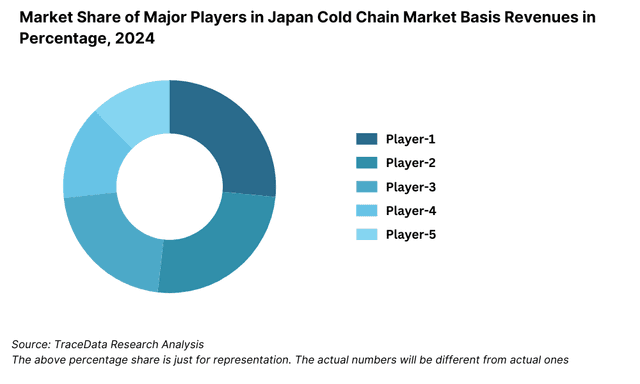
The Japan cold chain market is moderately concentrated, with a few dominant players supported by robust infrastructure and compliance standards. However, rising demand for pharma cold chains and e-commerce groceries has led to the emergence of niche operators and tech-driven logistics startups. Major players such as Yamato Transport, Sagawa Express, Nichirei Logistics, Mitsubishi Logistics, AEON Logistics, and Senko Group have extensive national coverage and sophisticated temperature-controlled solutions.
| Company Name | Founding Year | Original Headquarters |
| Nichirei Logistics Group Inc. | 1942 | Tokyo, Japan |
| Yamato Transport Co., Ltd. | 1919 | Tokyo, Japan |
| SBS Holdings, Inc. (Cold Logistics Division) | 1987 | Tokyo, Japan |
| Okamura Co., Ltd. (Cold Chain Division) | 1945 | Tokyo, Japan |
| Maruwa Unyu Kikan Co., Ltd. | 1951 | Nagoya, Japan |
| Sagawa Express Co., Ltd. | 1957 | Kyoto, Japan |
| Nippon Express Co., Ltd. (Cold Chain Division) | 1937 | Tokyo, Japan |
| Meito Transportation Co., Ltd. | 1952 | Aichi, Japan |
| Hinomaru Logistics Co., Ltd. | 1952 | Tokyo, Japan |
| Konoike Transport Co., Ltd. | 1880 | Osaka, Japan |
| Logitem Japan Co., Ltd. | 1941 | Tokyo, Japan |
| Mitsui-Soko Holdings Co., Ltd. | 1909 | Tokyo, Japan |
| Mitsubishi Logistics Corporation | 1887 | Tokyo, Japan |
| Lineage Logistics Japan (via acquisitions of Fuji Cold Chain & others) | 2008 (JP: ~2020) | Novi, Michigan, USA |
| DHL Supply Chain Japan (cold chain operations) | 1969 (JP: ~2000s) | Bonn, Germany |
Some of the recent competitor trends and key information about competitors include:
Yamato Transport: As Japan’s leading parcel and cold chain delivery company, Yamato launched its “Cool TA-Q-BIN” AI-enhanced refrigerated delivery service, ensuring consistent temperature maintenance. In 2023, it handled over 400 million temperature-sensitive parcels, with 12% year-on-year growth in the food delivery segment.
Sagawa Express: Known for its high-volume logistics capabilities, Sagawa expanded its pharma cold chain fleet by 20% in 2023. The firm also launched a blockchain-based monitoring system to ensure traceability and regulatory compliance for critical medical shipments.
Nichirei Logistics Group: A dominant player in cold warehousing, Nichirei opened a new automated frozen storage facility in Tokyo Bay, increasing its national capacity by 8%. It has also invested in low-carbon refrigeration systems aligned with Japan’s green logistics policy.
Mitsubishi Logistics: Mitsubishi has focused on GDP-compliant pharma logistics and deep-freeze storage facilities (-70°C). In 2023, it partnered with major vaccine distributors and invested in IoT-based condition monitoring platforms.
AEON Logistics: Leveraging its retail backbone, AEON Logistics reported a 17% increase in frozen grocery deliveries in 2023, driven by the surge in online supermarket orders. Its last-mile cold chain optimization initiative reduced delivery times by 15%.
Senko Group Holdings: Senko expanded its regional cold chain footprint, especially in western Japan. The firm also collaborated with equipment manufacturers to introduce energy-efficient and solar-assisted reefer containers.
What Lies Ahead for Japan Cold Chain Market?
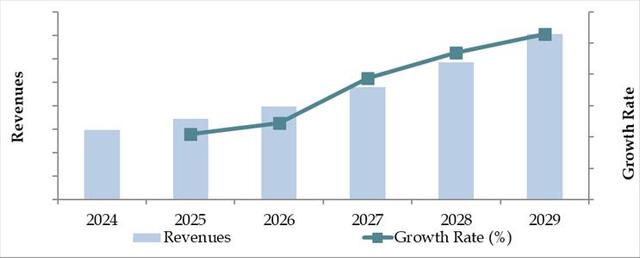
The Japan cold chain market is expected to witness steady growth by 2029, driven by rising demand from the pharmaceutical and food sectors, expansion of e-commerce logistics, and government support for sustainable and digital supply chains. The market is projected to grow at a CAGR of 6–7% during 2024–2029, with increasing investments in automation and smart logistics solutions.
Expansion of Pharma Cold Chain Infrastructure: With Japan’s aging population and growing pharmaceutical consumption, there will be heightened demand for temperature-sensitive logistics, especially for biologics, vaccines, and advanced therapies. The GDP-compliant logistics segment is expected to expand rapidly, with increased participation from both domestic and international logistics providers.
Adoption of Green and Sustainable Cold Chain Technologies: Environmental sustainability is gaining momentum in Japan. Cold chain operators are expected to invest more in solar-powered refrigeration units, energy-efficient warehouses, and low-GWP refrigerants. Government subsidies and carbon neutrality targets will accelerate this trend, particularly in urban and port regions.
Integration of IoT, AI, and Predictive Analytics: The cold chain market will see a surge in smart logistics technologies. Real-time temperature monitoring, AI-based route optimization, and predictive maintenance for refrigeration equipment will become mainstream. These technologies will help reduce spoilage, optimize costs, and improve compliance across the supply chain.
Growth in E-Grocery and Direct-to-Consumer Models: Post-pandemic behavioral shifts are expected to continue, with e-grocery and frozen meal services becoming a core driver of cold chain demand. By 2029, over 55% of Japanese households are expected to rely on online platforms for purchasing perishable food items, increasing the need for last-mile cold chain logistics.
Future Outlook and Projections for Japan Cold Chain Market on the Basis of Revenues in USD Million, 2024-2029
Japan Cold Chain Market Segmentation
- By Market Structure:
o 3PL Cold Chain Providers
o In-House Logistics Operators
o Independent Cold Storage Providers
o Last-Mile Cold Delivery Services
o Organized Sector
o Unorganized Sector - By Application:
o Processed Food
o Dairy Products
o Meat and Seafood
o Pharmaceuticals and Biologics
o E-Commerce Grocery
o Confectionery and Bakery - By Temperature Type:
o Chilled (0°C to 10°C)
o Frozen (-18°C and below)
o Deep Freeze/Ultra-Low Temperature (-70°C and below) - By End-User Industry:
o Food & Beverage Manufacturers
o Pharmaceutical Companies
o Hospitals and Diagnostic Centers
o Online Grocery Platforms
o Retail Chains
o Exporters/Importers - By Region:
o Kanto (Tokyo, Yokohama, etc.)
o Kansai (Osaka, Kyoto, etc.)
o Chubu (Nagoya, Shizuoka, etc.)
o Kyushu
o Tohoku & Hokkaido
Players Mentioned in the Report:
· Nippon Express
· Yamato Transport Co.
· Sagawa Express Co., Ltd.
· Kintetsu World Express
· Itochu Logistics Corp.
· Nichirei Logistics Group, Inc.
· Yusen Logistics Co., Ltd.
· DHL Japan
· Kuehne + Nagel Japan
· K Line Logistics
· Sojitz Corporation
· CEVA Logistics Japan
· Kokubu Group
· Agility Logistics Japan
· SF Express Japan
· Cold Storage Japan Ltd.
· GLP Japan
Key Target Audience:
- Cold Storage Operators
- 3PL and Logistics Companies
- Food & Beverage Exporters and Importers
- Pharmaceutical & Vaccine Distributors
- Government & Regulatory Authorities (e.g., Ministry of Land, Infrastructure, Transport and Tourism - MLIT)
- Technology and Cold Chain Monitoring Providers
- Industry Associations (e.g., Japan Cold Chain Logistics Association)
Time Period:
- Historical Period: 2018–2023
- Base Year: 2024
- Forecast Period: 2024–2029
Explore Flexible Purchase Options or Have Limited Budget?
Pay only for relevant chapters • Customizable report sections
Table of Contents
Choose individual sections to purchase. Mix and match as you like.
6.1. Revenues, 2018-2024P
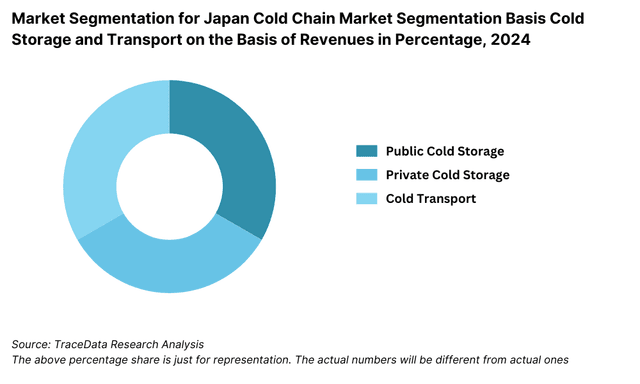
7.1. By Cold Storage and Cold Transport, 2023-2024P
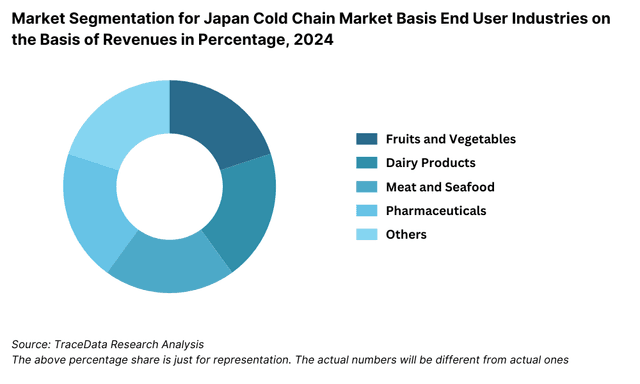
7.2. By End-User Application (Dairy Products, Meat and Seafood, Pharmaceuticals, Fruits and Vegetables and Others), 2023-2024P
7.3. By Ownership (Owned and 3PL Cold Chain Facilities), 2023-2024P
10.1. Japan Cold Storage Market Size
10.1.1. By Revenue, 2018-2024P
10.1.2. By Number of Pallets, 2018-2024P
10.2. Japan Cold Storage Market Segmentation
10.2.1. By Temperature Range (Ambient, Chilled and Frozen), 2023-2024P
10.2.2. By End-User Application (Dairy Products, Meat and Seafood, Pharmaceuticals, Fruits and Vegetables and Others), 2023-2024P
10.2.3. By Major Cities (Manila, Quezon, Cebu and others), 2023-2024P
10.3. Japan Cold Storage Market Future Outlook and Projections, 2025-2029
10.3.1. By Temperature Range (Ambient, Chilled and Frozen), 2025-2029
10.3.2. By Major Cities, 2025-2029
11.1. Japan Cold Transport Market Size (By Revenue and Number of Reefer Trucks), 2018-2024P
11.2. Japan Cold Transport Market Segmentation
11.2.1. By Mode of Transportation (Land, Sea and Air), 2023-2024P
11.2.2. By Location (Domestic and International), 2023-2024P
11.3. Japan Cold Transport Market Future Outlook and Projections, 2025-2029
11.3.1. By Mode of Transport (Land, Sea and Air), 2025-2029
11.3.2. By Location (Domestic and International), 2025-2029
12.1. Trends and Developments in Japan Cold Chain Market
12.2. Issues and Challenges in Japan Cold Chain Market
12.3. Decision Making Parameters for End Users in Japan Cold Chain Market
12.4. SWOT Analysis of Japan Cold Chain Industry
12.5. Government Regulations and Associations in Japan Cold Chain Market
12.6. Macroeconomic Factors Impacting Japan Cold Chain Market
13.1. Parameters to be covered for Each End Users to Determine Business Potential:
13.1.1. Production Clusters
13.1.2. Market Demand, Major Products Stored, Cold Storage Companies in Guwahati catering to End Users
13.1.3. Location Preference for Each End User and their Production Plants, Preferences for Outsourcing and Captive Facility, Services Required, Facility Preferences, Decision Making Parameters
13.1.4. Cross comparison of leading end users/companies based on Headquarters, Manufacturing Plants, Products Stored, Major Products, Total Production, Cold Chain Partner, Facility Outsourced/Captive, Pallets Owned/Hired, Contact Person, Address and others
16.1. Competitive Landscape in Japan Cold Chain Market
16.2. Competition Scenario in Japan Cold Chain Market (Competition Stage, Major Players, Competing Parameters)
16.3. Key Metrics (Temperature Range, Pallet Position, Prices Charged, Occupancy Rate, Revenue (2023) and Employee Base) for Major Players in Japan Cold Chain Market
16.4. Company Profiles of Major Companies in Japan Cold Chain Market (Year of Establishment, Company Overview, Service Offered, USP, Warehousing Facilities, Warehousing Price, Cold Storage by location, Occupancy Rate, Major Clientele, Industries Catered, Employee Base, Temperature Range, Topline OPEX*, Revenue, Recent Developments, Future Strategies)
16.5. Strength and Weakness
16.6. Operating Model Analysis Framework
16.7. Gartner Magic Quadrant
16.8. Bowmans Strategic Clock for Competitive Advantage
17.1. Revenues, 2025-2029
18.1. By Cold Storage and Cold Transport, 2025-2029
18.2. By End-User Application (Dairy Products, Meat and Seafood, Pharmaceuticals, Fruits and Vegetables and Others), 2025-2029
18.3. By Ownership (Owned and 3PL Cold Chain Facilities), 2025-2029
18.4. Recommendation
18.5. Opportunity Analysis
Discuss a Customized Research Scope
Custom research scope • Tailored insights • Industry expertise
Research Methodology
Step 1: Ecosystem Creation
Map the ecosystem and identify all the demand side and supply side entities for Japan Cold Chain Market. Basis this ecosystem, we will shortlist leading 5-6 producers in the country based upon their financial information, infrastructure capacity, and regional presence.
Sourcing is made through industry articles, multiple secondary, and proprietary databases to perform desk research around the market to collate industry-level information.
Step 2: Desk Research
Subsequently, we engage in an exhaustive desk research process by referencing diverse secondary and proprietary databases. This approach enables us to conduct a thorough analysis of the market, aggregating industry-level insights. We delve into aspects like the cold storage capacity, logistics volume, number of market players, application-wise demand, pricing models, and other variables. We supplement this with detailed examinations of company-level data, relying on sources like press releases, annual reports, financial statements, and similar documents. This process aims to construct a foundational understanding of both the market and the entities operating within it.
Step 3: Primary Research
We initiate a series of in-depth interviews with C-level executives and other stakeholders representing various Japan Cold Chain Market companies and end-users. This interview process serves a multi-faceted purpose: to validate market hypotheses, authenticate statistical data, and extract valuable operational and financial insights from these industry representatives. Bottom to top approach is undertaken to evaluate volume and capacity for each player thereby aggregating to the overall market.
As part of our validation strategy, our team executes disguised interviews wherein we approach each company under the guise of potential customers. This approach enables us to validate the operational and financial information shared by company executives, corroborating this data against what is available in secondary databases. These interactions also provide us with a comprehensive understanding of revenue streams, value chain, process, pricing, and other factors.
Step 4: Sanity Check
- Bottom to top and top to bottom analysis along with market size modeling exercises is undertaken to assess sanity check process.
See What's Inside the Report
Get a preview of key findings, methodology and report coverage
Frequently Asked Questions
The Japan Cold Chain Market is positioned for consistent growth, reaching a valuation of JPY 2.1 Trillion in 2023. This growth is fueled by increasing demand for temperature-sensitive food and pharmaceutical products, the rise in online grocery and e-commerce delivery, and Japan’s strong regulatory emphasis on food safety and medical logistics. Technological advancements and government support for sustainable logistics further enhance the market's potential.
The Japan Cold Chain Market is led by key players such as Yamato Transport, Sagawa Express, and Nichirei Logistics Group. These companies dominate the space with their advanced cold storage infrastructure, nationwide delivery networks, and strong compliance with safety standards. Other notable players include Mitsubishi Logistics, AEON Logistics, and Senko Group Holdings.
Key growth drivers include the rising demand for pharmaceutical cold chains due to an aging population, increasing online food purchases, and strict regulatory mandates for food safety and drug logistics. Additionally, the integration of IoT, AI, and automation in cold chain operations is improving efficiency, reliability, and scalability across the sector.
The Japan Cold Chain Market faces several challenges, including high energy and operational costs, labor shortages due to an aging workforce, and limited cold chain infrastructure in rural and remote areas. Moreover, the transition toward green logistics requires significant upfront investments, posing hurdles for small and mid-sized operators.
License Options
PDF + Excel
Complete report package
$4,000
Excel Only
Data and analytics
$2,500
Custom Sections
Starts from $100
$0