Japan Logistics and Warehousing Market Outlook to 2029
By Market Structure, By Transport Mode, By Storage Type, By End-User Industry, By Warehousing Technology, and By Region
Report Overview
Report Code
TDR0173
Coverage
Asia
Published
May 2025
Pages
80
Flexible Purchase Options
Select and purchase only the chapters you need for your strategic decisions
On This Page
Report Overview
The report titled “Japan Logistics and Warehousing Market Outlook to 2029 - By Market Structure, By Transport Mode, By Storage Type, By End-User Industry, By Warehousing Technology, and By Region” provides a comprehensive analysis of the logistics and warehousing sector in Japan. The report covers an overview and genesis of the industry, overall market size in terms of revenue, market segmentation; trends and developments, regulatory landscape, customer level profiling, issues and challenges, and comparative landscape including competition scenario, cross comparison, opportunities and bottlenecks, and company profiling of major players in the logistics and warehousing ecosystem.
Report Coverage
Verified Market Sizing
Multi-layer forecasting with historical data and 5–10 year outlook
Deep-Dive Segmentation
Cross-sectional analysis by product type, end user, application and region
Competitive Benchmarking & Positioning
Market share, operating model, pricing and competition matrices
Actionable Insights & Risk Assessment
High-growth white spaces, underserved segments, technology disruptions and demand inflection points
Review Methodology & Data Structure
Preview report structure, data sources and research framework
Executive Summary
The report titled “Japan Logistics and Warehousing Market Outlook to 2029 - By Market Structure, By Transport Mode, By Storage Type, By End-User Industry, By Warehousing Technology, and By Region” provides a comprehensive analysis of the logistics and warehousing sector in Japan. The report covers an overview and genesis of the industry, overall market size in terms of revenue, market segmentation; trends and developments, regulatory landscape, customer level profiling, issues and challenges, and comparative landscape including competition scenario, cross comparison, opportunities and bottlenecks, and company profiling of major players in the logistics and warehousing ecosystem. The report concludes with future market projections based on revenue, by market structure, segment type, geography, cause-and-effect relationships, and success case studies highlighting key opportunities and risks.
Japan Logistics and Warehousing Market Overview and Size
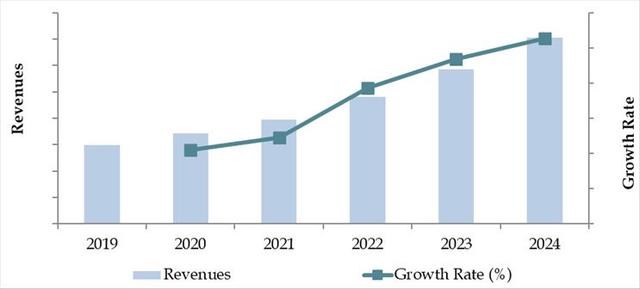
The Japan logistics and warehousing market was valued at JPY 28.5 Trillion in 2023, driven by robust demand from the e-commerce sector, advancements in supply chain technology, and Japan’s strategic position in global trade routes. The market is characterized by prominent players such as Yamato Holdings, Nippon Express, SG Holdings, Kintetsu World Express, and Hitachi Transport System, all of which leverage advanced logistics solutions and nationwide warehousing networks.
In 2023, Nippon Express launched a fully automated distribution center in Osaka, integrating AI and robotics to enhance operational efficiency. Tokyo, Osaka, and Nagoya remain key logistics hubs due to their dense consumer bases and proximity to ports and industrial zones.
Market Size for Japan Logistics and Warehousing Industry on the Basis of Revenue in USD Billion, 2018-2023
What Factors are Leading to the Growth of Japan Logistics and Warehousing Market:
Boom in E-commerce: The rapid growth of e-commerce in Japan has led to increased demand for last-mile delivery, real-time tracking, and faster fulfillment. In 2023, over 35% of logistics activities in urban Japan were directly linked to e-commerce orders. Retail giants such as Rakuten and Amazon Japan have significantly expanded their logistics networks.
Aging Workforce & Automation Push: Japan’s aging population has created labor shortages in traditional logistics roles. In response, companies have accelerated adoption of automated guided vehicles (AGVs), robotics, and warehouse management systems (WMS) to optimize operations and reduce dependency on manual labor.
Government Investments & Smart Infrastructure: The Japanese government has committed to investing over JPY 1 Trillion by 2025 into smart logistics infrastructure, including intelligent transport systems (ITS), cold-chain enhancements, and regional logistics hubs aimed at revitalizing rural economies and reducing urban congestion.
Which Industry Challenges Have Impacted the Growth for Japan Logistics and Warehousing Market
Labor Shortage and Rising Wages: One of the most significant challenges facing the Japanese logistics sector is an acute shortage of skilled labor due to the country’s aging population. According to the Japan Institute for Logistics Systems, over 32% of logistics companies reported difficulties in hiring drivers and warehouse workers in 2023. This shortage has driven up labor costs and created delivery delays, particularly during peak seasons, affecting overall supply chain efficiency.
High Real Estate and Urban Congestion Costs: Warehousing space, especially in metropolitan areas such as Tokyo and Osaka, commands premium rents. In 2023, the average logistics facility rent in Greater Tokyo rose by 6.4% YoY, making it difficult for small and mid-sized operators to maintain profitability. Furthermore, urban congestion has led to increased last-mile delivery times and higher fuel consumption.
Fragmented Logistics Ecosystem: Despite technological advancements, the Japanese logistics ecosystem remains highly fragmented with many small and mid-sized players operating in silos. Over 60% of domestic freight is handled by operators with fewer than 50 vehicles, leading to inefficiencies in route planning, warehousing utilization, and load optimization.
What are the Regulations and Initiatives which have Governed the Market
Decarbonization and Green Logistics Policies: As part of Japan’s target to achieve carbon neutrality by 2050, the government has implemented a range of sustainability regulations affecting logistics operations. These include mandates on reducing carbon emissions per ton-km transported and encouraging a modal shift from road to rail and maritime freight. In 2023, over 12% of long-distance freight shifted from trucks to eco-friendly alternatives, backed by government subsidies.
Digital Transformation Initiatives (Smart Logistics): The Ministry of Land, Infrastructure, Transport and Tourism (MLIT) has launched the Smart Logistics Initiative, which incentivizes the adoption of IoT-enabled tracking, WMS (Warehouse Management Systems), and autonomous delivery trials. In 2023, more than 45% of medium to large logistics companies adopted AI-based warehouse or routing solutions under this initiative.
Revised Labor Standards Law (2024 Reforms): Effective April 2024, Japan’s amended labor law placed stricter caps on overtime for truck drivers, known as the "2024 Problem" in the logistics industry. This reform limits the total annual driving hours, potentially reducing freight capacity by up to 14%, prompting urgent adaptation through automation, better route planning, and collaboration among logistics partners.
Japan Logistics and Warehousing Market Segmentation
By Market Structure: The Japanese logistics market is dominated by organized players, including large 3PL providers and integrated logistics firms, due to their strong infrastructure, regulatory compliance, and advanced technology adoption. These firms handle everything from freight forwarding and inventory management to last-mile delivery. Unorganized players, including small-scale operators and regional transporters, still contribute to intra-city deliveries but face challenges due to rising compliance costs and limited digitization.
By Transport Mode: Road freight continues to be the primary mode of logistics in Japan, supported by a dense expressway network and suitability for short-haul and last-mile deliveries. Rail freight has gained traction due to environmental regulations and government incentives for modal shift. Air cargo is primarily used for high-value and time-sensitive goods, while maritime freight dominates international trade, with Japan’s port cities such as Yokohama and Kobe serving as key logistics nodes.
By Storage Type: Ambient warehouses form the backbone of the warehousing market, serving general consumer goods and industrial storage. Cold storage warehouses are rapidly expanding, driven by the demand from pharmaceuticals, food, and fresh produce sectors. Automated warehouses are seeing increased investment as companies aim to improve efficiency and reduce labor dependency through robotics and WMS systems.
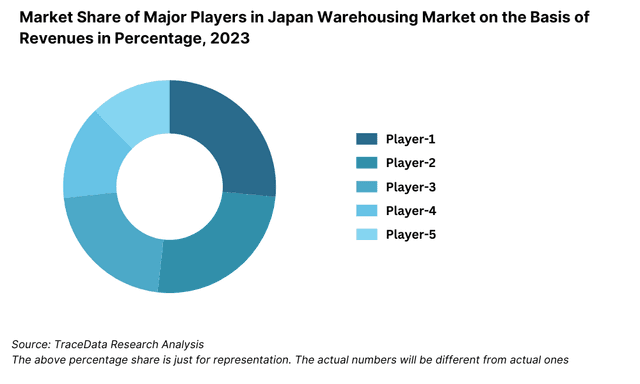
Competitive Landscape in Japan Logistics and Warehousing Market
The Japan logistics and warehousing market is moderately consolidated, with several major players commanding substantial market share, especially in urban and international logistics. However, the rise of tech-enabled logistics startups and specialized 3PL providers has added competitive diversity in recent years. Key players in the market include Yamato Holdings, Nippon Express, SG Holdings (Sagawa), Kintetsu World Express, Hitachi Transport System, and newer entrants like Hacobu and Logizard that are driving digitization and automation.
| Company Name | Founding Year | Original Headquarters |
| Nippon Express | 1937 | Tokyo, Japan |
| Yamato Holdings (Yamato Transport) | 1919 | Tokyo, Japan |
| Sagawa Express | 1957 | Kyoto, Japan |
| Japan Post | 2007 | Tokyo, Japan |
| Kintetsu World Express (KWE) | 1970 | Tokyo, Japan |
| Mitsubishi Logistics | 1887 | Tokyo, Japan |
| Yusen Logistics | 1955 | Tokyo, Japan |
| MOL Logistics | 1960 | Tokyo, Japan |
| Konoike Transport | 1880 | Osaka, Japan |
| Kuehne + Nagel Japan | 1890 | Osaka, Japan |
Some of the recent competitor trends and key information about competitors include:
Yamato Holdings: Japan’s leading parcel delivery provider, Yamato handled over 1.7 billion parcels in 2023. The company launched its “NEKO Project” to deploy autonomous delivery robots and achieve carbon neutrality across last-mile operations by 2030.
Nippon Express: A global logistics giant, Nippon Express invested over JPY 40 billion in automation and cold chain logistics in 2023. Their expansion in pharma and temperature-controlled logistics has strengthened their footprint in high-value goods transport.
SG Holdings (Sagawa): Sagawa enhanced its warehousing capacity by 15% in 2023 through new fulfillment centers near Osaka and Fukuoka. The company is actively collaborating with tech firms to implement IoT-enabled freight monitoring systems.
Kintetsu World Express: Focused on international freight forwarding, KWE expanded its operations in Southeast Asia and initiated end-to-end logistics integration platforms for Japanese exporters in 2023.
Hitachi Transport System: A key player in contract logistics and SCM, Hitachi launched a digital twin logistics system that enables real-time inventory management and predictive demand forecasting, particularly in the electronics and automotive sectors.
Hacobu: A logistics SaaS startup, Hacobu saw 90% YoY growth in 2023, driven by its “MOVO” platform which optimizes vehicle dispatching and dock scheduling for B2B operations. The firm is gaining traction with mid-sized manufacturers.
Logizard: Specializing in cloud-based warehouse management solutions, Logizard’s customer base grew by 40% in 2023, with strong uptake among SMEs and cross-border e-commerce players needing agile warehouse systems.

What Lies Ahead for Japan Logistics and Warehousing Market?
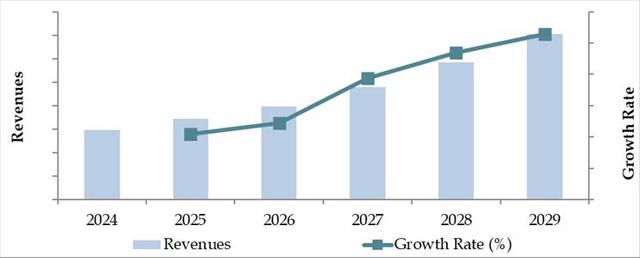
The Japan logistics and warehousing market is projected to grow steadily by 2029, recording a moderate yet stable CAGR over the forecast period. Growth will be driven by continued digital transformation, infrastructure modernization, rising demand for last-mile delivery solutions, and the adoption of sustainable logistics practices across the industry.
Expansion of E-commerce Fulfillment Infrastructure: As online retail continues to gain momentum, particularly in the consumer electronics, fashion, and grocery segments, there will be a significant rise in demand for urban fulfillment centers and dark stores. By 2029, Japan’s e-commerce-linked warehousing demand is expected to grow by over 40%, led by giants like Rakuten, Amazon Japan, and emerging D2C brands.
Acceleration in Warehouse Automation: The integration of robotics, AI-driven WMS, and AGVs (automated guided vehicles) will transform warehousing operations. This trend is expected to significantly reduce labor dependency and improve throughput efficiency. By 2029, over 60% of newly built warehouses in Japan are projected to be semi- or fully automated.
Focus on Cold Chain Expansion: Rising demand for temperature-sensitive goods including pharmaceuticals, fresh produce, and seafood is set to drive massive investments in cold chain logistics. Japan’s aging population and increased medical needs are also contributing factors, with cold storage capacity expected to grow by 25% through 2029.
Green Logistics and Sustainability Integration: Sustainability will become a core pillar of logistics operations, with firms investing in electric delivery fleets, solar-powered warehouses, and carbon offset programs. The government's green logistics certification schemes will push companies toward reducing their carbon footprint and adopting circular practices in packaging and transport.
Future Outlook and Projections for Japan Logistics and Warehousing Market on the Basis of Revenues in USD Billion, 2024-2029
Japan Logistics and Warehousing Market Segmentation
- By Market Structure:
o 3PL (Third Party Logistics Providers)
o Freight Forwarders
o Integrated Logistics Providers
o In-house Logistics
o Organized Sector
o Unorganized Sector
o Domestic Logistics
o International Logistics - By Transport Mode:
o Road Freight
o Rail Freight
o Air Cargo
o Maritime Freight
o Multimodal Transport - By Storage Type:
o Ambient Storage
o Cold Storage
o Automated Warehousing
o Bonded Warehousing
o Hazardous Goods Storage - By End-User Industry:
o Retail and E-commerce
o Automotive
o Food and Beverage
o Pharmaceuticals and Healthcare
o Electronics and High-tech
o Industrial and Manufacturing
o Agriculture and Chemicals - By Technology Adoption:
o Warehouse Management Systems (WMS)
o Transportation Management Systems (TMS)
o Robotics and Automation
o IoT-based Tracking Systems
o Blockchain and Digital Freight Matching Platforms By Region:
o Kanto (Tokyo, Yokohama)
o Kansai (Osaka, Kyoto)
o Chubu (Nagoya, Shizuoka)
o Kyushu (Fukuoka, Kumamoto)
o Tohoku
o HokkaidoPlayers Mentioned in the Report:
Freight Forwarding Companies
- Nippon Express
- Kintetsu World Express
- Yusen Logistics
- Kokusai Express Japan
- Schenker-Seino
- Rhenus Japan
- Panalpina World Transport (Japan) Ltd.
- DFH Global Logistics
- FWT Logistics
- Shine Express
Warehousing Companies
- Nippon Express
- Yusen Logistics
- Kokusai Express Japan
- Inui Global Logistics
- JP Logistics Hub
- Omni Logistics
- Nichirei Logistics
- Sumitomo Warehouse Co. Ltd
E-Commerce Logistics Companies
- Yamato Transport
- Sagawa Express
- Rakuten Logistics
- Amazon Japan Logistics
- JP Logistics Hub
- eStore Logistics
- Ship&co
- Ezbuy Japan
Express Logistics Companies
- Yamato Transport
- Sagawa Express
- Japan Post
- FedEx Japan
- DHL Japan
- UPS Japan
- Seino Transportation
- Toll Express Japan
Key Target Audience:
- Logistics and 3PL Providers
- E-commerce Companies
- Warehousing Infrastructure Developers
- Cold Chain Operators
- Government and Regulatory Bodies (e.g., MLIT - Ministry of Land, Infrastructure, Transport and Tourism)
- Supply Chain Technology Firms
- Institutional Investors and Real Estate Funds
- Research and Policy Institutions
Time Period:
- Historical Period: 2018–2023
- Base Year: 2024
- Forecast Period: 2024–2029
Explore Flexible Purchase Options or Have Limited Budget?
Pay only for relevant chapters • Customizable report sections
Table of Contents
Choose individual sections to purchase. Mix and match as you like.
4.1. Macroeconomic Framework for Japan Including GDP, GDP Growth, GDP Contribution by Sector
4.2. Logistics Sector Contribution to GDP and Historical Evolution
4.3. Ease of Doing Business in Japan (Business environment, contract enforcement, trading-across-borders indicators and logistics implications)
4.4. LPI Index of Japan and Improvements in the Last 10-15 Years
4.5. Customs Procedures and Customs Charges in Japan Logistics Market
5.1. Landscape of Investment Parks and Free Trade Zones in Japan
5.2. Current Scenario for Logistics Infrastructure in Japan
5.3. Road Infrastructure in Japan including Road Network, Toll Charges and Toll Network, Major Goods Traded through Road, Major Flow Corridors for Road (Inbound and Outbound)
5.4. Air Infrastructure in Japan including Total Volume Handled, FTK for Air Freight, Major Inbound and Outbound Flow Corridors, Major Goods traded through Air, Number of Commercial and passenger Airports, Air Freight Volume by Ports and other Parameters
5.5. Sea Infrastructure in Japan including Total Volume Handled, FTK for Sea Freight, Major Inbound and Outbound Flow Corridors, Major Goods Traded through Sea, Number of Ports for Coastal and Ocean Freight, Number of Vessels, Sea Freight Volume by Ports and other Parameters
5.6. Rail Infrastructure in Japan including Total Volume Handled, FTK for Rail Freight, Major Inbound and Outbound Flow Corridors, Major Goods Traded through Rail and others
6.1. Market Size on the Basis of Revenues, 2018-2024P
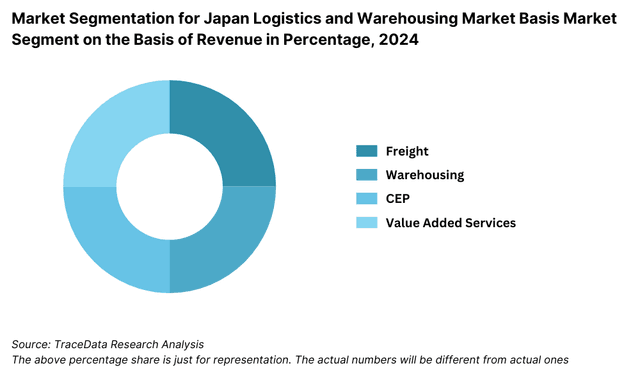
7.1. Market Segmentation by Segment-Freight Forwarding, Warehousing, CEP and Value-Added Services, 2018-2024P
7.2. Market Segmentation by End User Industries, 2018-2024P
8.1. Market Overview and Genesis
8.2. Japan Freight Forwarding Market Size by Revenues, 2018-2024P
8.3. Japan 3PL Freight Forwarding Market Segmentation, 2018-2024P
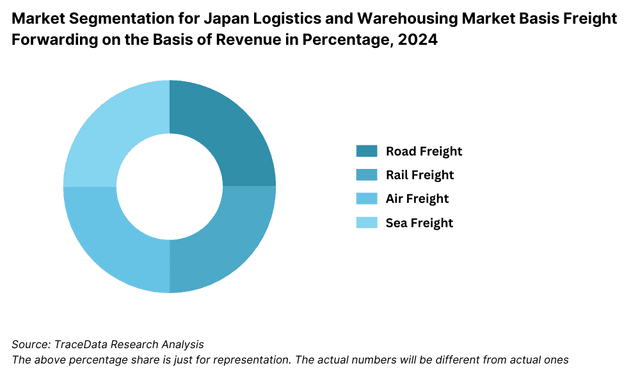
8.3.1. Segmentation by Mode of Freight Transport-Road, Sea, Air and Rail, 2018-2024P (Share by revenue, FTK and shipment volume)
8.3.1.1. Price per FTK for Road, Air, Sea and Rail in Japan
8.3.1.2. Road Freight-Domestic and International Volume, FTK and Revenue; Number of Registered Vehicles
8.3.1.3. Road Freight Domestic and International Corridors
8.3.1.4. Ocean Freight-Domestic and International Volume, FTK and Revenue; Volume by Commodity; Seaport Key Statistics
8.3.1.5. Air Freight-Domestic and International Volume, FTK and Revenue
8.3.1.6. Rail Freight-Domestic Volume, FTK and Revenue; Volume by Commodity and Region
8.3.1.7. Export-Import Scenario-Value by Mode of Transport, Commodity and Country; Volume by Principal Commodities
8.3.2. Segmentation by Intercity Road Freight Corridors, 2018-2024P
8.3.3. Segmentation by International Road / Intermodal Freight Corridors, 2018-2024P
8.3.4. Segmentation by End User-Industrial, FMCG, F&B, Retail and Others, 2018-2024P (Vertical-specific freight characteristics and service requirements)
8.4. Snapshot of Freight Truck Aggregators in Japan
8.5. Competitive Landscape in Japan Freight Forwarding Market, 2024
8.5.1. Heat Map of Major Players in Japan Freight Forwarding on the Basis of Service Offering
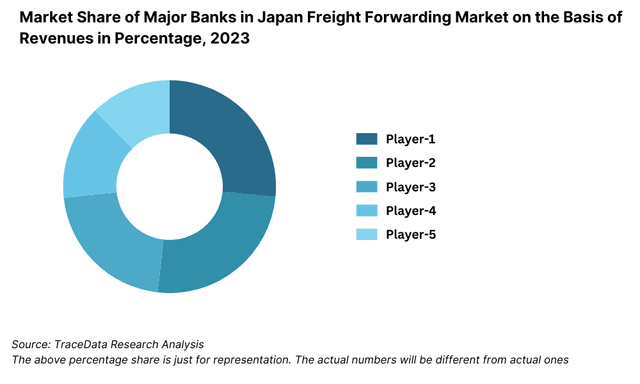
8.5.2. Market Share of Major Players in Japan Freight Forwarding Market, 2024
8.5.3. Cross Comparison of Major Freight Forwarding Companies-Parameters Including Total Freight Volume by Mode, Network Coverage (Domestic and International), Owned vs Chartered Fleet, Number of Logistics Facilities and GFA, Key Industry Verticals Served, Technology Adoption (TMS/WMS/visibility platforms), Revenue Scale and Profitability, Strategic Partnerships and Alliances, 2024
8.5.4. Detailed Profiles of Leading Logistics and Freight Forwarding Companies in Japan (Company overview, service portfolio, assets, clients, strategy)
8.6. Japan Freight Forwarding Future Market Size by Revenues, 2025-2029
8.7. Japan Freight Forwarding Market Future Segmentation, 2025-2029
8.7.1. Future Segmentation by Mode of Freight Transport-Road, Sea, Air and Rail, 2025-2029 (Projected volume and revenue shares)
8.7.2. Future Segmentation by International Road / Intermodal Freight Corridors, 2025-2029 (Growth in intermodal, cross-border and regional lanes)
8.7.3. Future Segmentation by End User-Industrial, FMCG, F&B, Retail and Others, 2025-2029 (Growth pockets and emerging sectors)
9.1. Market Overview and Genesis
9.2. Value Chain Analysis in Japan Warehousing Market Including Entities, Margins, Role of Each Entity, Process Flow, Challenges and Other Aspects
9.3. Japan Warehousing Market Size on the Basis of Revenues and Warehousing Space, 2018-2024P
9.4. Japan Warehousing Market Segmentation
9.4.1. Japan Warehousing Revenue by Business Model-Industrial/Retail, ICD/CFS and Cold Storage, 2018-2024P
9.4.2. Japan Warehousing Revenue by Type of Warehouse-General, Open Yard, Freezer/Chiller, Ambient and Bonded Warehouses, 2018-2024P
9.4.3. Japan Warehousing Revenue by End User-Industrial & Construction, FMCG, Retail, Food & Beverage and Others, 2018-2024P
9.4.4. 3PL Warehousing Space by Region, 2024P
9.5. Competitive Landscape in Japan Warehousing Market
9.5.1. Market Share of Top 10 Companies in Japan Warehousing Market, 2024
9.5.2. Cross Comparison of Top Warehousing Companies-Parameters Including Company Overview, USP, Business Strategy, Future Plans, Technology Adoption, Revenues from Warehousing, Number of Warehouses, Total Warehousing Space, Location and Regional Coverage, Type of Warehouses (General, Bonded, Cold, ICD/CFS), Occupancy Rate, Rental Levels, Major Clients and Contract Structures, 2024
9.6. Japan Warehousing Future Market Size on the Basis of Revenues, 2025-2029
9.7. Japan Warehousing Market Future Segmentation, 2025-2029
9.7.1. Japan Warehousing Future Revenue by Business Model-Industrial/Retail, ICD/CFS and Cold Storage, 2025-2029
9.7.2. Japan Warehousing Future Revenue by Type of Warehouse-General, Open Yard, Freezer/Chiller, Ambient and Bonded Warehouses, 2025-2029
9.7.3. Japan Warehousing Future Revenue by End User-Industrial & Construction, FMCG, Retail, Food & Beverage and Others, 2025-2029
10.1. Market Overview and Genesis
10.2. Value Chain Analysis in Japan CEP Market Including Entities, Margins, Role of Each Entity, Process Flow, Challenges and Other Aspects
10.3. Revenue Composition and Contribution Between First Mile/Mid Mile and Last Mile Delivery-Analysis for Domestic and International Shipments
10.4. Japan CEP Market Size on the Basis of Revenues and Shipments, 2018-2024P
10.5. Japan CEP Market Segmentation, 2024 (Product, direction, customer, service level)
10.5.1. Segmentation by Mails and Documents, E-Commerce Shipments and Express Cargo, 2023-2024P (Volume and revenue mix)
10.5.2. Segmentation by International and Domestic Express, 2023-2024P
10.5.3. Segmentation by B2B, B2C and C2C, 2023-2024P
10.5.4. Segmentation by Period of Delivery, 2023-2024P
10.6. Competitive Landscape in Japan CEP Market, 2024
10.6.1. Overview and Genesis, Market Nature, Market Stage and Major Competing Parameters
10.6.2. Market Share of Companies in Japan CEP Market on the Basis of Revenues/Number of Shipments, 2024
10.6.3. Market Share of Top 5 Companies in Japan E-Commerce Shipment Market on the Basis of Revenues/Number of Shipments, 2024
10.6.4. Cross Comparison of Top Japan CEP Companies-Parameters Including Company Overview, USP, Business Strategy, Future Plans, Technology Platforms, Number of Last Mile Delivery Shipments, Revenues, Major E-commerce and Enterprise Clients, Number of Fleets and Riders, Network Coverage (Prefectures, Cities and Postcodes), Major Service Offerings and Value-Added Services
10.7. Japan CEP Market Size on the Basis of Revenues and Shipments, 2025-2029
10.8. Japan CEP Market Future Segmentation, 2025-2029
10.8.1. Future Segmentation by Mails and Documents, E-Commerce Shipments and Express Cargo, 2025-2029
10.8.2. Future Segmentation by International and Domestic Express, 2025-2029
10.8.3. Future Segmentation by B2B, B2C and C2C, 2025-2029
10.8.4. Future Segmentation by Period of Delivery, 2025-2029
11.1. Customer Cohort Analysis and End User Paradigm for Different Industry Verticals under Logistics Sector-Telecommunications, FMCG, Automotive, Apparel, F&B, Construction and Pharmaceuticals
11.2. Understanding Logistics Spend by End User, 2023-2024P
11.3. End User Preferences in Terms of In-house or Outsourcing Logistics Services and Reason for Selection; Segregated by Size of Company on the Basis of Revenues
11.4. Major Logistics Companies Specialised in Serving Each Type of End User
11.5. Detailed Landscape of Each End User Vertical-Major Products Manufactured and Traded, Emerging Products, Type of Services Required and Outsourced, Major Companies, Contract Duration, Likelihood to Recommend, Market Orientation, Major Clusters, Type of Sourcing Preference, Pain Points, Facilities/Services Required, Future Outlook; Market Size for Each End User Industry Vertical with Growth Rate, 2018-2024P
12.1. Future Market Size on the Basis of Revenues, 2025-2029
13.1. Future Market Segmentation by Segment-Freight Forwarding, Warehousing, CEP and Value-Added Services, 2025-2029
13.2. Future Market Segmentation by End User Industries, 2025-2029
13.3. Recommendation
13.4. Opportunity Analysis
5.1. Landscape of Industrial Parks, Logistics Parks and Free Trade / Special Zones in Japan
5.2. Current Scenario for Logistics Infrastructure in Japan
5.3. Road Infrastructure in Japan Including Road Network, Toll Charges and Toll Network, Major Goods Traded Through Road, Major Flow Corridors for Road
5.4. Air Infrastructure in Japan Including Total Volume Handled, FTK for Air Freight, Major Inbound and Outbound Flow Corridors, Major Goods Traded Through Air, Number of Commercial and Passenger Airports, Air Freight Volume by Airports and Other Parameters
5.5. Sea Infrastructure in Japan Including Total Volume Handled, FTK for Sea
5.6. Rail Infrastructure in Japan Including Total Volume Handled, FTK for Rail Freight, Major Inbound and Outbound Flow Corridors, Major Goods Traded Through Rail and Others
Discuss a Customized Research Scope
Custom research scope • Tailored insights • Industry expertise
Research Methodology
Step 1: Ecosystem Creation
Map the ecosystem and identify all the demand side and supply side entities for Japan Logistics and Warehousing Market. Basis this ecosystem, we will shortlist leading 5-6 providers in the country based upon their financial information, warehousing capacity, fleet size, and operational coverage.
Sourcing is made through industry articles, multiple secondary, and proprietary databases to perform desk research around the market to collate industry-level information.
Step 2: Desk Research
Subsequently, we engage in an exhaustive desk research process by referencing diverse secondary and proprietary databases. This approach enables us to conduct a thorough analysis of the market, aggregating industry-level insights. We delve into aspects like revenue from logistics and warehousing operations, number of market players, fleet size, warehousing infrastructure, regional presence, pricing, and other variables. We supplement this with detailed examinations of company-level data, relying on sources like press releases, annual reports, financial statements, and similar documents. This process aims to construct a foundational understanding of both the market and the entities operating within it.
Step 3: Primary Research
We initiate a series of in-depth interviews with C-level executives and other stakeholders representing various Japan Logistics and Warehousing Market companies and end-users. This interview process serves a multi-faceted purpose: to validate market hypotheses, authenticate statistical data, and extract valuable operational and financial insights from these industry representatives. Bottom to top approach is undertaken to evaluate volume handled and capacity utilized for each player thereby aggregating to the overall market.
As part of our validation strategy, our team executes disguised interviews wherein we approach each company under the guise of potential customers. This approach enables us to validate the operational and financial information shared by company executives, corroborating this data against what is available in secondary databases. These interactions also provide us with a comprehensive understanding of revenue streams, value chain, warehousing process, transportation practices, and other factors.
Step 4: Sanity Check
Bottom to top and top to bottom analysis along with market size modeling exercises is undertaken to assess sanity check process.
See What's Inside the Report
Get a preview of key findings, methodology and report coverage
Frequently Asked Questions
The Japan logistics and warehousing market holds significant growth potential, reaching a valuation of JPY 28.5 Trillion in 2023. This growth is driven by rising e-commerce demand, digital transformation, and strategic government investments in infrastructure. The market's potential is further enhanced by the push for automation and green logistics, along with Japan’s critical role in regional and global supply chains.
The Japan Logistics and Warehousing Market is dominated by major players including Yamato Holdings, Nippon Express, and SG Holdings. These companies possess extensive national networks, advanced warehousing infrastructure, and integrated logistics solutions. Other prominent players include Kintetsu World Express, Hitachi Transport System, Hacobu, and Logizard, who contribute to innovation and specialized services across various logistics functions.
The primary growth drivers include the expansion of e-commerce, increased investment in automation and warehouse management technologies, and supportive government policies aimed at smart and green logistics. Rising demand for cold chain logistics in the pharmaceutical and food sectors, along with shifting consumer expectations for faster delivery, are also accelerating market expansion.
The market faces several challenges such as acute labor shortages due to Japan’s aging population, high warehousing costs in urban areas, and fragmented operations among small-scale logistics providers. Regulatory changes like the 2024 labor reforms also pose capacity constraints, while the need for technological integration remains a hurdle for many mid-sized operators.
License Options
PDF + Excel
Complete report package
$4,000
Excel Only
Data and analytics
$2,500
Custom Sections
Starts from $100
$0