Jordan Cold Chain Market Outlook to 2029
By Market Type (Cold Storage, Cold Transportation), By End-User (Pharmaceuticals, Food & Beverages, Agriculture, Others), By Temperature Type (Chilled, Frozen), By Ownership (3PL, Owned), and By Region
Report Overview
Report Code
TDR0203
Coverage
Asia
Published
June 2025
Pages
80
Flexible Purchase Options
Select and purchase only the chapters you need for your strategic decisions
On This Page
Report Overview
The report titled “Jordan Cold Chain Market Outlook to 2029 – By Market Type (Cold Storage, Cold Transportation), By End-User (Pharmaceuticals, Food & Beverages, Agriculture, Others), By Temperature Type (Chilled, Frozen), By Ownership (3PL, Owned), and By Region” provides a comprehensive analysis of the cold chain market in Jordan. The report includes an overview and genesis of the industry, market size in terms of revenue, market segmentation, trends and developments, regulatory landscape, customer profiling, challenges, competitive landscape, cross-comparative analysis, opportunities, and company profiles of major players in the Jordan Cold Chain Market.
Report Coverage
Verified Market Sizing
Multi-layer forecasting with historical data and 5–10 year outlook
Deep-Dive Segmentation
Cross-sectional analysis by product type, end user, application and region
Competitive Benchmarking & Positioning
Market share, operating model, pricing and competition matrices
Actionable Insights & Risk Assessment
High-growth white spaces, underserved segments, technology disruptions and demand inflection points
Review Methodology & Data Structure
Preview report structure, data sources and research framework
Executive Summary
The report titled “Jordan Cold Chain Market Outlook to 2029 – By Market Type (Cold Storage, Cold Transportation), By End-User (Pharmaceuticals, Food & Beverages, Agriculture, Others), By Temperature Type (Chilled, Frozen), By Ownership (3PL, Owned), and By Region” provides a comprehensive analysis of the cold chain market in Jordan. The report includes an overview and genesis of the industry, market size in terms of revenue, market segmentation, trends and developments, regulatory landscape, customer profiling, challenges, competitive landscape, cross-comparative analysis, opportunities, and company profiles of major players in the Jordan Cold Chain Market. It concludes with projections based on revenue, market segments, regions, and strategic developments influencing future growth.
Jordan Cold Chain Market Overview and Size
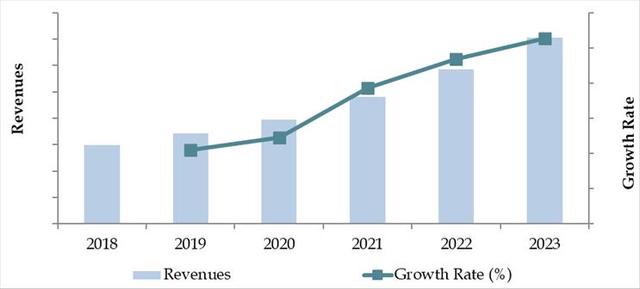
The Jordan cold chain market was valued at approximately JOD 220 Million in 2023. This growth is driven by rising demand for temperature-sensitive products in sectors such as pharmaceuticals and agriculture, the expansion of modern retail, and government efforts to reduce food waste. Key players include Agility Logistics, Petra Cold Chain, Gulf Agency Company (GAC), Naouri Group, and Aramex. These firms are recognized for their infrastructure capabilities, regulatory compliance, and tailored cold chain solutions.
In 2023, Petra Cold Chain expanded its frozen warehousing capacity in Amman, reflecting growing demand for perishable goods storage, especially in urban regions such as Amman, Zarqa, and Irbid.
Market Size for Jordan Cold Chain Industry on the Basis of Revenues in USD Million, 2018-2024
What Factors are Leading to the Growth of Jordan Cold Chain Market:
Growing Pharmaceutical Demand: Jordan's pharmaceutical exports are among the highest in the region. The need for GDP-compliant (Good Distribution Practices) storage and transport of medicines, vaccines, and biologicals has significantly contributed to the expansion of cold chain services.
Agricultural Export and Food Security: With agriculture contributing significantly to exports (especially citrus fruits and vegetables), cold chain infrastructure plays a key role in reducing post-harvest losses. In 2023, post-harvest losses were reduced by ~12% in export-oriented supply chains due to improved cold logistics.
Government Initiatives and Trade Routes: Jordan is strategically positioned as a logistics hub between the Gulf, Levant, and Europe. Government incentives for agri-exporters and infrastructure investment under the National Logistics Strategy 2025 have supported the sector’s development.
Which Industry Challenges Have Impacted the Growth for Jordan Cold Chain Market
High Energy and Utility Costs: Cold chain operations are energy-intensive, especially in a country like Jordan where electricity and fuel prices are relatively high. In 2023, energy expenses accounted for nearly 30% of operational costs for cold storage facilities, limiting profitability and discouraging capacity expansion.
Limited Infrastructure Outside Urban Areas: The cold chain infrastructure in Jordan is largely concentrated around Amman and Zarqa. Lack of reliable cold storage and refrigerated transport in rural and agricultural zones leads to significant post-harvest losses. According to industry estimates, approximately 18–22% of perishable produce is wasted due to inadequate cold chain coverage in regional areas.
Technology Adoption Gaps: Many cold chain operators still rely on outdated equipment and manual tracking methods. A 2023 industry survey found that only 35% of cold storage facilities in Jordan were equipped with temperature monitoring and control automation, resulting in inefficiencies and higher spoilage risks.
What are the Regulations and Initiatives which have Governed the Market:
Ministry of Agriculture Cold Storage Standards: The Ministry of Agriculture has issued updated compliance standards for cold storage facilities, focusing on temperature control, hygiene, and traceability. As of 2023, over 60% of licensed cold storage units in Jordan had implemented these basic regulatory standards.
Customs Guidelines for Perishable Imports: The Jordan Customs Department mandates that all perishable food imports must be transported using temperature-controlled containers with valid calibration certificates. In 2023, compliance checks increased by 25%, leading to faster clearance for certified shipments but delays for non-compliant carriers.
Incentives for Modernization of Cold Chain Facilities: To support the modernization of agro-logistics, the Jordan Enterprise Development Corporation (JEDCO) introduced a funding scheme in 2022 offering up to 30% subsidy for businesses investing in energy-efficient cold chain equipment. By end of 2023, over 90 companies had registered under this program, covering upgrades in both storage and refrigerated transport.
Jordan Cold Chain Market Segmentation
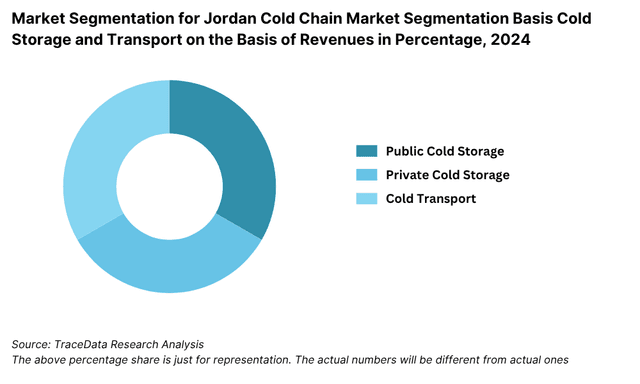
By Market Type: Cold storage dominates the market due to increasing demand for long-term storage of meat, dairy, fruits, and vegetables. Facilities are concentrated in major urban hubs like Amman and Zarqa, serving both domestic distribution and regional exports. Cold transportation is gaining momentum with rising pharmaceutical logistics and food delivery services requiring temperature-controlled vehicles and packaging solutions. The demand for reefer trucks and last-mile cold logistics is projected to grow significantly with the expansion of modern retail and online grocery platforms.
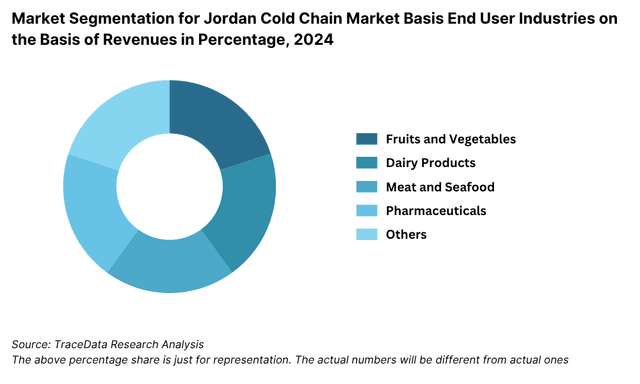
By End-User: The Food and Beverage segment leads due to the increasing consumption of frozen and packaged foods, followed by the Pharmaceutical sector, which has witnessed growth due to the export of medical supplies and vaccines. Agriculture also contributes a significant share, particularly in the export of citrus fruits and vegetables, supported by cold storage infrastructure in production clusters. Other segments include chemicals and specialty logistics requiring temperature control.
By Temperature Type: Frozen segment holds the majority share owing to the extensive use in meat, poultry, and seafood preservation. Chilled segment is growing with rising urban demand for dairy products, fresh produce, and bakery items. As of 2023, over 60% of operational cold storage capacity in Jordan was allocated to frozen items.
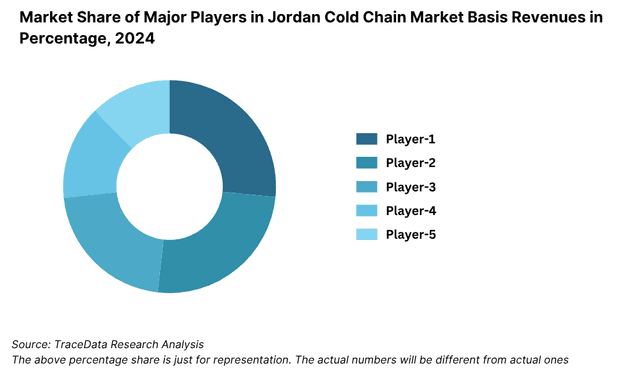
Competitive Landscape in Jordan Cold Chain Market
The Jordan cold chain market is moderately fragmented, with a few major players holding significant market share, while several regional operators and logistics providers continue to expand operations. The growth of pharmaceutical exports and increasing demand for temperature-sensitive food products has encouraged investments from both domestic and international players. Key companies operating in the market include Agility Logistics, Naouri Group, Petra Express, Cold Chain Logistics Jordan, and Aramex. These companies are recognized for their warehousing infrastructure, end-to-end cold chain services, and regional transportation networks.
| Company Name | Founding Year | Original Headquarters |
| Nuqul Logistics (Cold Chain Division) | 2007 | Amman, Jordan |
| International Cold Stores Company | 1995 | Amman, Jordan |
| Aramex Jordan (Temperature-Controlled Services) | 1982 | Dubai, UAE (Jordan origins) |
| Tameem Cold Chain Logistics | 2012 | Amman, Jordan |
| Al Jazeera Agricultural Co. (Cold Storage) | 1990s | Amman, Jordan |
| Sadeen Cold Stores and Logistics | 2006 | Amman, Jordan |
| Jordan Ice & Aerated Water Co. Ltd. (Pepsi Jordan - Cold Chain) | 1956 | Amman, Jordan |
| Golden Mills Company (Frozen Foods Logistics) | 1998 | Amman, Jordan |
| DHL Global Forwarding Jordan | 1969 (Jordan: ~1980s) | Bonn, Germany |
| Kuehne + Nagel Jordan (Cold Chain & Pharma) | 1890 (Jordan: ~2000s) | Schindellegi, Switzerland |
| DB Schenker Jordan | 1872 (Jordan: ~2000s) | Essen, Germany |
| CEVA Logistics Jordan | 2006 (Jordan: ~2010s) | Marseille, France |
| Maersk Jordan (Reefer Logistics) | 1904 (Jordan: ~2000s) | Copenhagen, Denmark |
| Agility Logistics Jordan | 1979 (Jordan: ~2005) | Kuwait City, Kuwait |
| FedEx Jordan (via local partner) | 1971 (Jordan: ~1990s) | Memphis, USA |
| UPS Jordan (via authorized agent) | 1907 (Jordan: ~1990s) | Atlanta, USA |
Some of the recent competitor trends and key information about competitors include:
Agility Logistics: A global player with significant cold storage capacity in Jordan's free zones, Agility expanded its pharmaceutical logistics operations in 2023 to support regional vaccine distribution. The company invested in temperature-controlled warehousing and is a preferred partner for large multinationals.
Naouri Group: One of the leading logistics providers in Jordan, Naouri Group reported a 22% increase in demand for cold chain transport in 2023. The company strengthened its reefer fleet and introduced a temperature monitoring system integrated with mobile alerts.
Petra Express: Known for domestic cold chain transport, Petra Express expanded its fleet of refrigerated vehicles in 2023 by 18% to support growth in the F&B sector. Its rapid delivery network has made it a preferred logistics partner for local dairy and meat processors.
Cold Chain Logistics Jordan: A specialized service provider focused entirely on temperature-sensitive cargo, the company launched a 6,000-pallet frozen warehouse in Zarqa Industrial Area in 2023. It has become a key storage partner for agricultural exporters.
Aramex: Leveraging its global logistics infrastructure, Aramex has strengthened its regional cold chain services, particularly in last-mile pharmaceutical delivery. In 2023, the company piloted a cold chain tracking system to improve shipment traceability and compliance.
What Lies Ahead for Jordan Cold Chain Market?
The Jordan cold chain market is projected to witness consistent growth through 2029, supported by rising demand in the pharmaceutical, food, and agricultural sectors, as well as increased regional trade connectivity. The market is expected to register a healthy CAGR driven by improvements in infrastructure, regulatory reforms, and technological advancements.
Expansion of Pharmaceutical Logistics: With Jordan positioning itself as a hub for pharmaceutical manufacturing and exports in the MENA region, the need for advanced cold chain solutions is expected to rise. Companies are increasingly investing in GDP-compliant storage and transport facilities to serve both domestic needs and exports to the Gulf and African markets.
Rising Demand from Food Retail and Quick Commerce: The surge in modern retail, online grocery platforms, and QSR (Quick Service Restaurant) chains is fueling the demand for reliable cold chain logistics. Urban consumers are demanding higher quality and safer food, requiring end-to-end temperature control from farm to shelf.
Technological Modernization: The integration of IoT, real-time temperature tracking, and warehouse automation is anticipated to play a major role in enhancing transparency and operational efficiency. Operators that adopt smart cold chain technologies will likely gain a competitive advantage and build customer trust.
Government Support and Regulatory Alignment: The Jordanian government has initiated steps to improve logistics infrastructure and align food safety standards with international norms. Supportive policies and possible incentives for cold chain operators under Jordan's National Logistics Strategy are expected to encourage private sector participation and foreign investment.
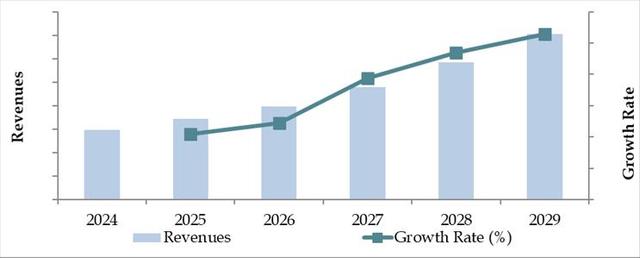
Future Outlook and Projections for Jordan Cold Chain Market on the Basis of Revenues in USD Million, 2024-2029
Jordan Cold Chain Market Segmentation
• By Market Type:
o Cold Storage
o Cold Transportation
• By End-User:
o Food & Beverages
o Pharmaceuticals
o Agriculture
o Chemicals & Industrial Applications
o Others
• By Temperature Type:
o Chilled (0°C to 15°C)
o Frozen (Below 0°C)
• By Ownership:
o Third-Party Logistics (3PL)
o Owned/Private Cold Chain Infrastructure
• By Region:
o Amman
o Zarqa
o Irbid
o Aqaba
o Other Northern & Southern Governorates
Players Mentioned in the Report:
- Agility Logistics
- Maersk Cold Chain
- SEKO Logistics
- Naouri Logistics
- Unilink Logistics Group
- Rhenus Jordan
- DHL Global Forwarding (Cold Chain)
- Kuehne + Nagel Jordan
- Freshlab Cold Storage (Jordan)
- Al‑Warad Cold Storage
Key Target Audience:
• Cold Chain Logistics Providers
• Food Processing and Export Companies
• Pharmaceutical Manufacturers and Distributors
• Retail and E-Commerce Chains
• Regulatory Bodies (e.g., Jordan Food and Drug Administration)
• Investment and Infrastructure Development Authorities
Time Period:
• Historical Period: 2018–2023
• Base Year: 2024
• Forecast Period: 2024–2029
Explore Flexible Purchase Options or Have Limited Budget?
Pay only for relevant chapters • Customizable report sections
Table of Contents
Choose individual sections to purchase. Mix and match as you like.
6.1. Revenues, 2018-2024P
7.1. By Cold Storage and Cold Transport, 2023-2024P
7.2. By End-User Application (Dairy Products, Meat and Seafood, Pharmaceuticals, Fruits and Vegetables and Others), 2023-2024P
7.3. By Ownership (Owned and 3PL Cold Chain Facilities), 2023-2024P
10.1. Jordan Cold Storage Market Size
10.1.1. By Revenue, 2018-2024P
10.1.2. By Number of Pallets, 2018-2024P
10.2. Jordan Cold Storage Market Segmentation
10.2.1. By Temperature Range (Ambient, Chilled and Frozen), 2023-2024P
10.2.2. By End-User Application (Dairy Products, Meat and Seafood, Pharmaceuticals, Fruits and Vegetables and Others), 2023-2024P
10.2.3. By Major Cities, 2023-2024P
10.3. Jordan Cold Storage Market Future Outlook and Projections, 2025-2029
10.3.1. By Temperature Range (Ambient, Chilled and Frozen), 2025-2029
10.3.2. By Major Cities, 2025-2029
11.1. Jordan Cold Transport Market Size (By Revenue and Number of Reefer Trucks), 2018-2024P
11.2. Jordan Cold Transport Market Segmentation
11.2.1. By Mode of Transportation (Land, Sea and Air), 2023-2024P
11.2.2. By Location (Domestic and International), 2023-2024P
11.3. Jordan Cold Transport Market Future Outlook and Projections, 2025-2029
11.3.1. By Mode of Transport (Land, Sea and Air), 2025-2029
11.3.2. By Location (Domestic and International), 2025-2029
12.1. Trends and Developments in Jordan Cold Chain Market
12.2. Issues and Challenges in Jordan Cold Chain Market
12.3. Decision Making Parameters for End Users in Jordan Cold Chain Market
12.4. SWOT Analysis of Jordan Cold Chain Industry
12.5. Government Regulations and Associations in Jordan Cold Chain Market
12.6. Macroeconomic Factors Impacting Jordan Cold Chain Market
13.1. Parameters to be covered for Each End Users to Determine Business Potential:
13.1.1. Production Clusters
13.1.2. Market Demand, Major Products Stored, Cold Storage Companies in Guwahati catering to End Users
13.1.3. Location Preference for Each End User and their Production Plants, Preferences for Outsourcing and Captive Facility, Services Required, Facility Preferences, Decision Making Parameters
13.1.4. Cross comparison of leading end users/companies based on Headquarters, Manufacturing Plants, Products Stored, Major Products, Total Production, Cold Chain Partner, Facility Outsourced/Captive, Pallets Owned/Hired, Contact Person, Address and others
16.1. Competitive Landscape in Jordan Cold Chain Market
16.2. Competition Scenario in Jordan Cold Chain Market (Competition Stage, Major Players, Competing Parameters)
16.3. Key Metrics (Temperature Range, Pallet Position, Prices Charged, Occupancy Rate, Revenue (2023) and Employee Base) for Major Players in Jordan Cold Chain Market
16.4. Company Profiles of Major Companies in Jordan Cold Chain Market (Year of Establishment, Company Overview, Service Offered, USP, Warehousing Facilities, Warehousing Price, Cold Storage by location, Occupancy Rate, Major Clientele, Industries Catered, Employee Base, Temperature Range, Topline OPEX*, Revenue, Recent Developments, Future Strategies)
16.5. Strength and Weakness
16.6. Operating Model Analysis Framework
16.7. Gartner Magic Quadrant
16.8. Bowmans Strategic Clock for Competitive Advantage
17.1. Revenues, 2025-2029
18.1. By Cold Storage and Cold Transport, 2025-2029
18.2. By End-User Application (Dairy Products, Meat and Seafood, Pharmaceuticals, Fruits and Vegetables and Others), 2025-2029
18.3. By Ownership (Owned and 3PL Cold Chain Facilities), 2025-2029
18.4. Recommendation
18.5. Opportunity Analysis
Discuss a Customized Research Scope
Custom research scope • Tailored insights • Industry expertise
Research Methodology
Step 1: Ecosystem Creation
Map the ecosystem and identify all the demand side and supply side entities for the Jordan Cold Chain Market. Based on this ecosystem, we shortlist the leading 5–6 service providers and infrastructure owners in the country, taking into account their warehousing capacity, transportation fleet, service offerings, and geographical coverage.
Sourcing is done through industry articles, regulatory publications, trade association reports, and proprietary databases to conduct desk research and gather market-level information.
Step 2: Desk Research
An exhaustive desk research process is initiated using diverse secondary and proprietary databases. This helps analyze industry-level indicators such as storage capacity, reefer fleet size, pricing benchmarks, operational costs, and demand distribution across end-user segments.
Company-specific data is extracted from press releases, financial reports, government tenders, logistics association publications, and credible news sources. This phase builds the foundational understanding of key players and structural dynamics in the cold chain ecosystem.
Step 3: Primary Research
A series of detailed interviews are conducted with supply chain managers, facility operators, logistics service providers, and industry experts involved in the Jordan Cold Chain Market. These conversations help validate assumptions, quantify the market, and extract insights into service models, pricing practices, and operational challenges.
Disguised interviews are also undertaken by posing as potential customers to cross-verify data on cold storage pricing, utilization levels, transportation practices, and technology deployment. These interactions also yield insights on pain points, regulatory impact, and client expectations.
Step 4: Sanity Check
- Bottom-up and top-down modeling frameworks are used to validate the estimated market size and future projections. This includes triangulating primary responses, infrastructure data, and import/export volumes to ensure consistency and accuracy in the final findings.
See What's Inside the Report
Get a preview of key findings, methodology and report coverage
Frequently Asked Questions
The Jordan cold chain market is poised for steady growth, reaching an estimated valuation of JOD 210 million in 2023. This growth is driven by rising demand for temperature-controlled logistics in pharmaceuticals, agriculture, and the food and beverage sector. Jordan’s strategic location as a trade and distribution hub for the Middle East further supports market expansion. Government initiatives to modernize logistics infrastructure and enhance regional connectivity are also expected to play a significant role in realizing the market's potential.
The Jordan Cold Chain Market features several key players, including Agility Logistics, Naouri Group, Petra Express, Cold Chain Logistics Jordan, and Aramex. These companies dominate the market due to their extensive logistics networks, established infrastructure, and ability to serve critical sectors like pharmaceuticals and food exports. Their investments in compliance, technology, and service expansion have positioned them as leading players.
The primary growth drivers include increasing pharmaceutical production and exports, the expansion of modern retail and quick commerce channels, and the rising consumption of frozen and processed food. Additionally, technological upgrades in cold storage and transportation, coupled with regulatory reforms and government support for logistics development, are further contributing to the market's growth.
The Jordan Cold Chain Market faces several challenges, including high energy and utility costs, infrastructure gaps outside major cities, limited adoption of advanced monitoring technologies, and a fragmented service provider base. Regulatory inconsistencies and the lack of skilled cold chain personnel also pose operational barriers to achieving higher efficiency and quality across the value chain.
License Options
PDF + Excel
Complete report package
$4,000
Excel Only
Data and analytics
$2,500
Custom Sections
Starts from $100
$0