Jordan Logistics and warehousing Market Outlook to 2029
By Market Segments (Freight Transport, Warehousing, Value-Added Services), By End Users (Retail, E-commerce, Pharmaceuticals, Food & Beverage, Manufacturing), By Mode of Transport, and By Region
Report Overview
Report Code
TDR0286
Coverage
Asia
Published
September 2025
Pages
80
Flexible Purchase Options
Select and purchase only the chapters you need for your strategic decisions
On This Page
Report Overview
The report titled “Jordan Logistics and Warehousing Market Outlook to 2029 – By Market Segments (Freight Transport, Warehousing, Value-Added Services), By End Users (Retail, E-commerce, Pharmaceuticals, Food & Beverage, Manufacturing), By Mode of Transport, and By Region” provides a comprehensive analysis of the logistics and warehousing sector in Jordan. The report covers an overview and genesis of the industry, overall market size in terms of revenue, detailed segmentation, key trends and developments, regulatory framework, customer profiling, market challenges, and a competitive landscape analysis.
Report Coverage
Verified Market Sizing
Multi-layer forecasting with historical data and 5–10 year outlook
Deep-Dive Segmentation
Cross-sectional analysis by product type, end user, application and region
Competitive Benchmarking & Positioning
Market share, operating model, pricing and competition matrices
Actionable Insights & Risk Assessment
High-growth white spaces, underserved segments, technology disruptions and demand inflection points
Review Methodology & Data Structure
Preview report structure, data sources and research framework
Executive Summary
The report titled “Jordan Logistics and Warehousing Market Outlook to 2029 – By Market Segments (Freight Transport, Warehousing, Value-Added Services), By End Users (Retail, E-commerce, Pharmaceuticals, Food & Beverage, Manufacturing), By Mode of Transport, and By Region” provides a comprehensive analysis of the logistics and warehousing sector in Jordan. The report covers an overview and genesis of the industry, overall market size in terms of revenue, detailed segmentation, key trends and developments, regulatory framework, customer profiling, market challenges, and a competitive landscape analysis. The report concludes with future projections based on key demand drivers, technological integration, and industry best practices, along with success case studies and strategic recommendations.
Jordan Logistics and Warehousing Market Overview and Size
The Jordan logistics and warehousing market was valued at JOD 1.07 billion in 2023, supported by robust trade flows, infrastructure investments, and rising demand from the retail and e-commerce sectors. The market has seen strong involvement from both domestic and international players such as Aramex, Naouri Group, DHL Jordan, and Agility Logistics. These companies are recognized for their extensive regional reach, end-to-end solutions, and focus on digital transformation in supply chain operations.
In 2023, Aramex launched a centralized logistics hub in Amman to enhance last-mile delivery efficiency and optimize cross-border shipments. Amman and Zarqa continue to dominate due to their strong connectivity and industrial concentration.
%252C%25202019-2024.png&w=640&q=75)
What Factors are Leading to the Growth of the Jordan Logistics and Warehousing Market:
Strategic Geographic Location: Jordan’s central location in the Middle East, acting as a transit gateway to neighboring markets including Iraq, Syria, and the Gulf, has positioned it as a strategic logistics hub. This has increased the demand for storage, distribution, and freight handling services.
E-commerce Boom: The surge in online shopping and digital transactions has significantly increased the need for reliable warehousing and last-mile delivery networks. As of 2023, over 35% of logistics demand was attributed to e-commerce-related fulfillment, with specialized warehousing and express delivery seeing rapid growth.
Government Initiatives & FTZs: The Jordanian government has made strong policy efforts to promote free trade zones (FTZs) and logistics parks. Projects such as the Aqaba Logistics Village and King Hussein Business Park have attracted foreign logistics players and enhanced trade facilitation infrastructure.
Which Industry Challenges Have Impacted the Growth for Jordan Logistics and Warehousing Market
High Logistics Costs: One of the key challenges in Jordan’s logistics sector is the relatively high cost of logistics operations compared to regional peers. Transportation costs contribute up to 30–35% of overall logistics expenses, largely due to dependency on imported fuel and limited multimodal transport options. This pricing pressure reduces competitiveness for local businesses and deters regional trade flows.
Limited Infrastructure in Secondary Cities: While Amman and Zarqa are well-equipped, other regions suffer from underdeveloped logistics infrastructure, including lack of advanced warehousing, cold storage, and poor road connectivity. This regional imbalance impacts distribution efficiency and limits service availability across the country.
Skilled Labor Shortage: The logistics sector in Jordan faces a shortage of skilled labor, particularly in areas such as warehouse automation, cold chain management, and customs clearance. According to industry estimates, around 42% of logistics companies report challenges in hiring trained professionals, which hinders the adoption of advanced logistics practices and operational efficiency.
What are the Regulations and Initiatives which have Governed the Market
Jordan Customs Modernization Program: To streamline trade and reduce border delays, the government has implemented an automated customs system (ASYCUDA World) across major ports and borders. As of 2023, average customs clearance times dropped by 22%, significantly improving supply chain reliability for importers and exporters.
National Transport Strategy (2020–2030): The strategy focuses on developing Jordan’s logistics capabilities through investments in road infrastructure, dry ports, and public-private partnerships. By 2024, over JOD 250 million had been committed to infrastructure upgrades in key logistics corridors like Amman–Aqaba and Zarqa–Irbid.
Incentives for Logistics Hubs and Free Zones: The Jordan Investment Commission offers tax exemptions and customs incentives for logistics operators in special economic zones like the King Hussein Business Park and Aqaba Special Economic Zone. These areas have attracted over 40 major logistics and warehousing firms as of 2023, fostering growth and foreign investment in the sector.
Jordan Logistics and Warehousing Market Segmentation
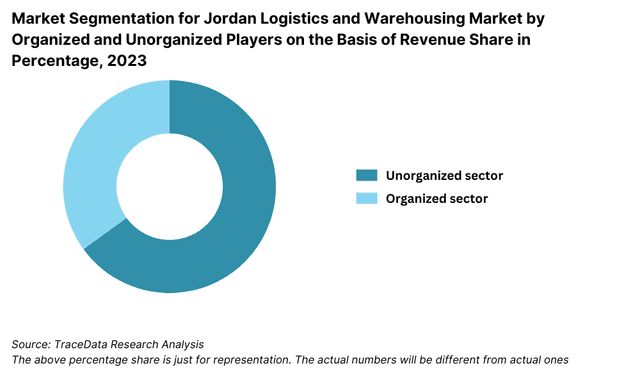
By Market Structure: The logistics market in Jordan is primarily dominated by unorganized players, particularly in road transport and small-scale warehousing segments. These players offer flexibility, lower pricing, and local expertise, especially in intra-city deliveries and distribution. However, organized players including multinational logistics providers and large regional firms are steadily gaining market share due to increasing demand for professionalized, tech-enabled, and value-added services. Organized operators are especially active in e-commerce logistics, pharmaceutical distribution, and cold chain solutions, where quality and compliance are crucial.
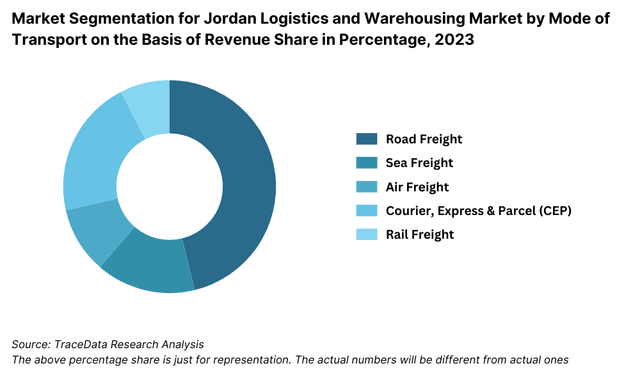
By Mode of Transport: Road transport dominates Jordan's logistics sector, accounting for the majority of domestic freight movement due to its flexibility and extensive road connectivity. Air freight plays a crucial role in time-sensitive and high-value shipments, especially for sectors like electronics and pharmaceuticals. Sea freight is vital for international trade, particularly via the Aqaba Port, Jordan’s primary maritime gateway. While rail transport is minimal at present, strategic projects under the National Railway Network aim to improve intermodal connectivity in the future.
By End User Industry: Retail and E-commerce are the largest contributors to logistics demand, driven by the rise of online shopping and last-mile delivery needs. Food & Beverage and Pharmaceuticals sectors require specialized cold storage and timely distribution, pushing demand for temperature-controlled warehousing and value-added logistics. Industrial manufacturing and construction materials sectors contribute to bulk logistics demand through heavy-duty warehousing and large shipment handling.
Competitive Landscape in Jordan Logistics and Warehousing Market
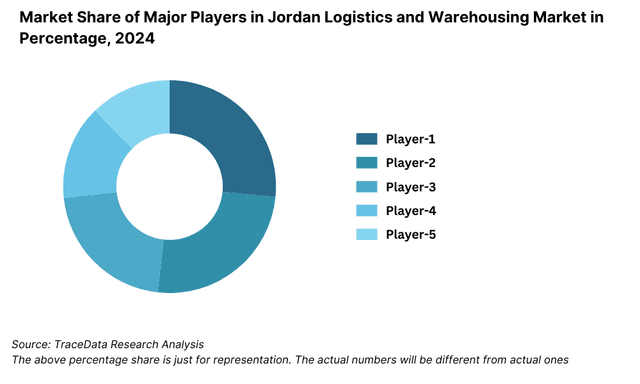
The Jordan logistics and warehousing market is moderately concentrated, with a few major players offering integrated services across freight forwarding, warehousing, and last-mile delivery. However, the rise of tech-driven logistics platforms and regional expansions have intensified competition. Key players include Aramex, Naouri Group, DHL Jordan, Agility Logistics, and TNT Express, which provide a broad range of B2B and B2C logistics services.
Company | Establishment Year | Headquarters |
Aramex | 1982 | Amman, Jordan |
Naouri Group | 1994 | Amman, Jordan |
DHL Jordan | 1979 | Amman, Jordan |
Agility Logistics | 1979 | Safat, Kuwait (Jordan Ops) |
TNT Express | 1946 | Amman, Jordan |
Some of the recent competitor trends and key information about competitors include:
Aramex: A homegrown logistics leader, Aramex continues to be a market leader in Jordan. In 2023, the company launched a new logistics hub in Amman focused on e-commerce fulfillment and cross-border efficiency. Aramex’s same-day delivery services now cover over 90% of Amman.
Naouri Group: A dominant player in freight forwarding and customs clearance, Naouri Group expanded its cold chain services in 2023 to cater to the growing pharmaceutical and F&B sectors. It also signed partnerships with regional players to enhance cross-border logistics.
DHL Jordan: Known for its international logistics strength, DHL has introduced automation at its Amman sorting facility, reducing processing time by 28%. It also expanded its B2B express logistics services, especially for SMEs involved in trade.
Agility Logistics: With operations in Jordan managed through regional branches, Agility offers integrated supply chain solutions. In 2023, Agility invested in digital warehousing and IoT-based inventory tracking, targeting industrial and FMCG clients.
TNT Express: Now part of the FedEx group, TNT Express focuses on express delivery and SME freight. In 2023, the company reported increased demand from the medical supplies segment and expanded its footprint in the Zarqa industrial area.
What Lies Ahead for Jordan Logistics and Warehousing Market?
The Jordan logistics and warehousing market is expected to grow steadily through 2029, registering a healthy CAGR, driven by infrastructure development, digital transformation, and the country's strategic location as a trade gateway to the Levant region.
Expansion of E-commerce Logistics: With a growing digital consumer base and increasing smartphone penetration, e-commerce logistics is expected to be a major growth driver. The demand for efficient last-mile delivery, real-time tracking, and seamless return logistics is projected to rise, particularly in urban centers like Amman and Irbid.
Development of Multimodal Infrastructure: Government-backed initiatives such as the National Railway Network and road upgrades are expected to improve multimodal transport capabilities. This will reduce logistics costs, enhance connectivity to neighboring countries, and attract regional trade and investment, especially in the Aqaba port corridor.
Increased Investment in Cold Chain and Pharma Logistics: With Jordan positioning itself as a hub for pharmaceutical manufacturing and medical exports, demand for temperature-controlled logistics and GDP-compliant warehousing is expected to rise. This will fuel investments in cold storage, insulated transport, and specialized last-mile delivery solutions.
%252C%25202024-2030.png&w=640&q=75)
Jordan Logistics and Warehousing Market Segmentation
• By Market Structure:
o Integrated Logistics Providers
o Freight Forwarders
o Last-Mile Delivery Firms
o Cold Chain Operators
o 3PL (Third-Party Logistics)
o 4PL (Fourth-Party Logistics)
o Organized Sector
o Unorganized Sector
• By Mode of Transport:
o Road
o Air
o Sea
o Rail (Planned)
o Multimodal
• By End User Industry:
o E-commerce
o Retail
o Food & Beverage
o Pharmaceuticals
o Industrial Manufacturing
o Automotive
o Construction Materials
• By Warehousing Type:
o General Warehousing
o Cold Storage Warehousing
o Bonded Warehousing
o Automated Warehousing
o Fulfillment Centers
• By Region:
o Amman
o Zarqa
o Irbid
o Aqaba
o Mafraq
o Other Northern & Southern Governorates
Players Mentioned in the Report:
• Aramex
• Naouri Group
• DHL Jordan
• Agility Logistics
• TNT Express
• JorAMCo Logistics
• Jo Express
• GlobMed Jordan Logistics
Key Target Audience:
• Logistics Service Providers
• E-commerce and Retail Chains
• Pharmaceutical and Cold Chain Operators
• Transport Infrastructure Authorities
• Government & Regulatory Bodies (e.g., Ministry of Transport, JIC)
• Investors and Private Equity Firms
• Research & Consultancy Firms
Time Period:
• Historical Period: 2018–2023
• Base Year: 2024
• Forecast Period: 2024–2029
Explore Flexible Purchase Options or Have Limited Budget?
Pay only for relevant chapters • Customizable report sections
Table of Contents
Choose individual sections to purchase. Mix and match as you like.
4.1. Value Chain Process-“ Role of Entities, Stakeholders, and Challenges They Face
4.2. Revenue Streams for Jordan Logistics and Warehousing Market
4.3. Business Model Canvas for Jordan Logistics and Warehousing Market
4.4. Buyer Decision-Making Process (Importers, Retailers, Manufacturers)
4.5. Supply Chain and Fulfillment Decision-Making Process
5.1. Volume of Goods Moved Domestically, 2018-“2024
5.2. Share of Logistics by Mode-“ Road, Sea, Air, Rail (Estimated), 2018-“2024
5.3. Spending on Logistics and Supply Chain Services, 2024
5.4. Number of Logistics and Warehousing Companies by Region
8.1. Revenues, 2018-“2024
8.2. Shipment Volume (in tons/TEUs), 2018-“2024
9.1. By Market Structure (Organized and Unorganized), 2023-“2024P
9.2. By Type of Service (Freight, Warehousing, Last-Mile Delivery, Value-Added), 2023-“2024P
9.3. By Average Ticket Size (Per Shipment/Contract), 2023-“2024P
9.4. By Region (Amman, Zarqa, Aqaba, Irbid, Others), 2023-“2024P
9.5. By Mode of Transport (Road, Air, Sea, Rail), 2023-“2024P
9.6. By End User Industry (Retail, E-commerce, Food, Pharma, Manufacturing), 2023-“2024P
9.7. By Warehouse Type (General, Cold Chain, Bonded, Fulfillment Centers), 2023-“2024P
10.1. Client Landscape and Sector-Wise Demand Analysis
10.2. Logistics Provider Selection Criteria
10.3. Supply Chain Needs, Gaps, and Pain Points
10.4. Procurement Process and Contracting Preferences
11.1. Trends and Developments in Jordan Logistics Market
11.2. Growth Drivers for Jordan Logistics and Warehousing Market
11.3. SWOT Analysis
11.4. Issues and Challenges
11.5. Regulatory Landscape (Customs, Free Zones, Transportation Laws)
12.1. Market Size and Future Potential for E-commerce Fulfillment, 2018-“2029
12.2. Business Model and Delivery Partnerships
12.3. Cross Comparison of Leading E-commerce Logistics Players (Reach, Capabilities, Clients)
13.1. Average Rent per SQM by City and Warehouse Type
13.2. New Warehouse Projects and Industrial Parks (2024-“2029)
13.3. Cold Storage Capacity Growth and Utilization Trends
13.4. Role of Free Zones (Aqaba, Mafraq, KHBP)
16.1. Benchmarking Key Players (Overview, Business Segments, Strengths, Weaknesses, Clients)
16.2. Strengths and Weaknesses Matrix
16.3. Operating Model and Coverage Area Analysis
16.4. Strategic Positioning-“ Gartner Magic Quadrant Equivalent
16.5. Bowmans Strategy Clock Analysis
17.1. Revenue Projections, 2025-“2029
17.2. Freight and Storage Volume Projections, 2025-“2029
18.1. By Market Structure, 2025-“2029
18.2. By Type of Service, 2025-“2029
18.3. By Average Ticket Size, 2025-“2029
18.4. By Region, 2025-“2029
18.5. By Mode of Transport, 2025-“2029
18.6. By End User Industry, 2025-“2029
18.7. By Warehouse Type, 2025-“2029
18.8. Key Recommendations
18.9. Opportunity Analysis
Discuss a Customized Research Scope
Custom research scope • Tailored insights • Industry expertise
Research Methodology
Step 1: Ecosystem Creation
Map the ecosystem and identify all demand-side and supply-side entities relevant to the Jordan Logistics and Warehousing Market. This includes freight forwarders, 3PL/4PL providers, warehouse operators, e-commerce players, FMCG and pharmaceutical firms, and government bodies. Based on this mapping, we shortlist 5–6 key logistics providers in Jordan by evaluating their operational scale, warehousing capacity, fleet size, client base, and financial standing.
Initial sourcing is done via industry publications, company press releases, sector-specific journals, and proprietary logistics databases to capture macro-level industry insights and structure the ecosystem.
Step 2: Desk Research
A comprehensive desk research exercise is conducted using multiple sources, including trade associations, Ministry of Transport publications, investment promotion agencies, and regional economic reports. This process helps in aggregating data on logistics volume, warehousing space, pricing benchmarks, trade flow patterns, and demand growth by sector.
Company-level deep-dives are carried out using publicly available resources like financial reports, media coverage, investor presentations, and third-party research. This helps us understand competitive positioning, revenue trends, service offerings, and expansion strategies of major logistics providers in Jordan.
Step 3: Primary Research
In-depth interviews are conducted with stakeholders such as C-level executives, warehouse managers, operations heads, logistics consultants, and clients from high-demand sectors (e.g., retail, pharma, and manufacturing). These interactions validate our market assumptions and fill data gaps not captured through secondary research.
Disguised interviews are also executed—posing as potential clients or business partners—to understand real-time pricing, service quality, warehouse capacity utilization, and delivery SLAs. This offers an unfiltered view into operational challenges, capacity constraints, and customer satisfaction.
Bottom-up evaluation of warehousing square footage, fleet movement, and shipment frequency is used to estimate total market volume and revenue, aggregated across all identified market players.
Step 4: Sanity Check
A dual approach—bottom-to-top and top-to-bottom modeling—is implemented to validate market size estimates. Key metrics like total warehousing space in square meters, average rental yield, freight volume in TEUs or tons, and cost per shipment are modeled.
Final triangulation is performed using benchmarks from similar regional markets, cross-validation from industry experts, and reconciliation with historical trends to ensure accuracy and consistency of the final market sizing.
See What's Inside the Report
Get a preview of key findings, methodology and report coverage
Frequently Asked Questions
The Jordan logistics and warehousing market is positioned for consistent growth, reaching a valuation of JOD 1.07 billion in 2023. Its potential is driven by the country’s strategic geographic location, serving as a key gateway to the Levant region. Growth is further supported by increasing trade activity, e-commerce expansion, infrastructure investments, and a rising need for specialized logistics services such as cold chain and pharma logistics.
Major players in the Jordan logistics and warehousing market include Aramex, Naouri Group, DHL Jordan, Agility Logistics, and TNT Express. These companies maintain competitive advantages through their broad service portfolios, technological capabilities, and established client networks. They play a significant role in shaping market dynamics and setting industry benchmarks.
Key growth drivers include rising e-commerce activity, which demands fast and reliable last-mile delivery; investments in multimodal infrastructure, particularly roads and dry ports; and expansion of cold chain capacity to support pharmaceuticals and food logistics. Additionally, digital transformation in warehouse and fleet operations is improving efficiency and attracting international partnerships.
The market faces challenges such as high logistics costs, especially due to fuel dependency and underdeveloped multimodal options. Infrastructure gaps in secondary cities, a shortage of skilled logistics personnel, and limited rail connectivity also hinder operational scalability. Regulatory delays at borders and fragmented warehousing standards further impact overall market efficiency.
License Options
PDF + Excel
Complete report package
$4,000
Excel Only
Data and analytics
$2,500
Custom Sections
Starts from $100
$0