Kenya Agrochemical Market Outlook to 2030
By Product Type, By Crop Sector, By Formulation, By Application Method, By Distribution Channel, and By Region
Report Overview
Report Code
TDR0320
Coverage
Africa
Published
September 2025
Pages
80
Flexible Purchase Options
Select and purchase only the chapters you need for your strategic decisions
On This Page
Report Overview
The report titled “Kenya Agrochemical Market Outlook to 2030 – By Product Type, By Crop Sector, By Formulation, By Application Method, By Distribution Channel, and By Region” provides a comprehensive analysis of the agrochemical market in Kenya. The report covers an overview and genesis of the industry, overall market size in terms of revenue, market segmentation; trends and developments, regulatory landscape, customer level profiling, issues and challenges, and competitive landscape including competition scenario, cross-comparison, opportunities and bottlenecks, and company profiling of major players in the agrochemical market.
Report Coverage
Verified Market Sizing
Multi-layer forecasting with historical data and 5–10 year outlook
Deep-Dive Segmentation
Cross-sectional analysis by product type, end user, application and region
Competitive Benchmarking & Positioning
Market share, operating model, pricing and competition matrices
Actionable Insights & Risk Assessment
High-growth white spaces, underserved segments, technology disruptions and demand inflection points
Review Methodology & Data Structure
Preview report structure, data sources and research framework
Executive Summary
The report titled “Kenya Agrochemical Market Outlook to 2030 – By Product Type, By Crop Sector, By Formulation, By Application Method, By Distribution Channel, and By Region” provides a comprehensive analysis of the agrochemical market in Kenya. The report covers an overview and genesis of the industry, overall market size in terms of revenue, market segmentation; trends and developments, regulatory landscape, customer level profiling, issues and challenges, and competitive landscape including competition scenario, cross-comparison, opportunities and bottlenecks, and company profiling of major players in the agrochemical market. The report concludes with future market projections based on product families, crop sectors, formulations, application technologies, distribution channels, regions, cause-and-effect relationships, and success case studies highlighting the major opportunities and cautions.
Kenya Agrochemical Market Overview and Size
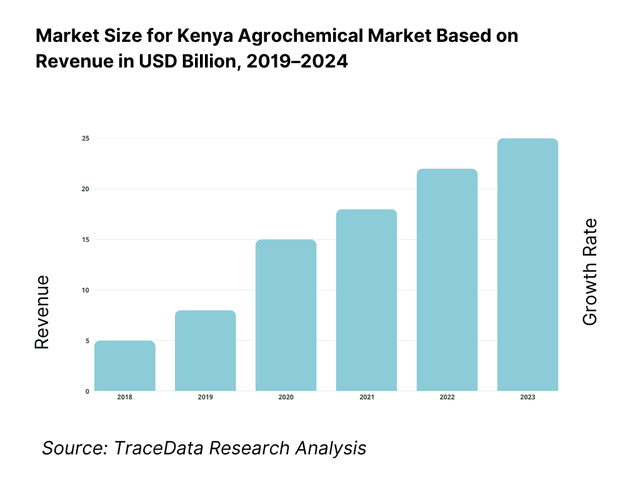
The Kenya agrochemical market is anchored by an estimated USD 177 million worth of pesticide imports for 2024, based on TraceData recording Kenya as one of the notable global importers of pesticides. Over the preceding years, imports grew from USD 109 million in 2020 to USD 177 million in 2023, implying a compound annual growth rate of approximately 17.6%, driven by expanding smallholder agricultural intensification, higher pest incidence such as fall armyworm, and rising demand for horticultural and staple-crop protection chemicals.
Within Kenya, agrochemical usage concentrates around regions with intensive commercial farming and export-oriented crop production—particularly the Rift Valley and Central regions, where maize, tea, and floriculture dominate. Kenya as a whole holds regional importance across East Africa due to its developed regulatory framework (PCPB, KEPHIS), strong export linkages to the EU, and relatively well-developed agro-dealer networks servicing both estates and smallholders—factors that collectively drive its dominance in the regional agrochemical sphere.
What Factors are Leading to the Growth of the Kenya Agrochemical Market:
Large, agriculture-reliant population and sectoral output creating steady input demand: Kenya’s farm economy underpins everyday livelihoods, anchoring recurrent demand for crop protection. The World Bank reports total population at 56,432,944 and rural population at 39,475,409—a very large base of farm households purchasing seasonally recurring inputs like herbicides and fungicides. In parallel, agriculture, forestry and fishing generated USD 26,577,958,300 in value added, signalling a sizable production system that must be defended against weeds, insects and diseases to protect output and incomes. Together, these real-economy volumes—people actually farming and value actually produced—translate into regular need for agrochemicals to maintain yields and quality across staple cereals and export horticulture.
Export horticulture scale and phytosanitary throughput reinforcing compliance-driven spraying: Export horticulture sustains intensive, residue-compliant crop protection programs. Kenya’s official promotion agency notes horticulture exports worth KSh 153,700,000,000 in produce value, reflecting large flows that require disease and pest control aligned to EU and UK market rules. On the licensing side, the plant health authority issued 373,312 phytosanitary certificates and 47,638 import permits in a recent reporting period—real, transactional volumes that necessitate field-level and packhouse-level crop protection to keep consignments compliant and on schedule. The combination of high-value exports and heavy certification traffic structurally sustains demand for fungicides, insecticides and pre-harvest interval management tools.
Input intensification and land constraints concentrating spend per hectare: Two macro indicators explain the intensification imperative that favours agrochemicals. First, fertilizer use stands at 35.1 kilograms per hectare of arable land—still low relative to high-input systems and therefore co-evolving with pesticide adoption as farmers push yields. Second, arable land is limited; using World Bank land area (569,140 sq. km) and arable-land share (11.05), Kenya has roughly 6,288,997 hectares of arable land—finite acreage that must be protected and intensified rather than expanded. With finite hectares and growing output targets, producers rely on crop protection to safeguard each cropped hectare against pests like FAW and Tuta.
Which Industry Challenges Have Impacted the Growth of the Kenya Agrochemical Market:
Counterfeit inputs and packaging infiltrating value chains: Illicit agro-inputs erode grower trust, crop outcomes and registrant investments. Kenya’s Anti-Counterfeit Authority reported a seizure of counterfeit agricultural products valued at KSh 3,400,000 in Kitengela and a separate raid confiscating 190,000 counterfeit fertilizer packaging bags in Nairobi—hard numbers that evidence active infiltration risks to the agrochemical trade. Such seizures represent only detected cases, implying an enforcement and stewardship burden for registrants and dealers, and real yield risks for farmers who unknowingly apply sub-standard or fake products during critical spray windows.
Finite arable land concentrating weather and pest shocks on limited hectares: Kenya’s land constraint magnifies the impact of droughts, floods and pest waves on each cropped hectare. Using World Bank land area (569,140 sq. km) and arable share (11.05), arable land is about 6,288,997 hectares. With this finite base, episodic shocks translate into immediate yield and quality losses unless fields are protected. Limited scope for area expansion means farmers must intensify protection on existing plots, yet any disruption in the supply of approved actives or spray services can suppress output across millions of planted hectares in a single season.
Sub-optimal input intensity limiting yield resilience: Macro indicators show input use remains modest for a system facing rising pest pressure. Fertilizer consumption is 35.1 kilograms per hectare, a signal of broader input constraints (credit, logistics, advisory) that also affect pesticide programs—fewer spray rounds, delayed purchases, or under-dosing. At the same time, agriculture still produces USD 26,577,958,300 in value added, indicating large output at risk if fields are under-protected in peak windows. Aligning finance, distribution and stewardship to raise timely input intensity is therefore essential to stabilize yields and reduce losses to insects, weeds and fungal diseases.
What are the Regulations and Initiatives which have Governed the Market:
PCPB Inspection & Certification Regulations—premises licensing, sampling and seizure procedures: Kenya gazetted the Pest Control Products (Inspection and Certification) Regulations, 2024 (Legal Notice No. 193) to govern quality assurance and licensing. The rules set out procedures for sampling products, the requirements for certification of businesses handling pesticides, minimum academic qualifications for operators, and the seizure and suspension processes for non-compliant stock—codifying a full enforcement chain from store inspection to product removal. For market participants, these quantified procedural hooks translate into compliance actions at every licensed outlet and warehouse.
PCPB Registration Rules—application forms and agent requirements for every product: Under the Pest Control Products (Registration) Regulations (Legal Notice No. 46), every product must be filed using specified forms (A, A1, A2, A3, A3a, A3b, A4, A5, plus A6/A7 for agency changes). Non-resident applicants must appoint a permanent Kenyan agent, and each dossier must include five label copies. These numerically explicit requirements shape dossier preparation, local representation and labelling workflows for all registrants—multinationals and local formulators alike—before any sales can legally occur.
Phytosanitary certification throughput—KEPHIS permits and export certificates driving compliance: Plant health licensing interacts directly with agrochemical use through export compliance. KEPHIS reported issuance of 47,638 Plant Import Permits and 373,312 phytosanitary certificates in a recent year, evidencing heavy regulatory throughput that requires audited spray records, pre-harvest intervals and pesticide traceability. This numeric workload, paired with horticulture export value of KSh 153,700,000,000, enforces disciplined use of registered actives and label-compliant applications across farms and packhouses supplying EU and other markets.
Kenya Agrochemical Market Segmentation
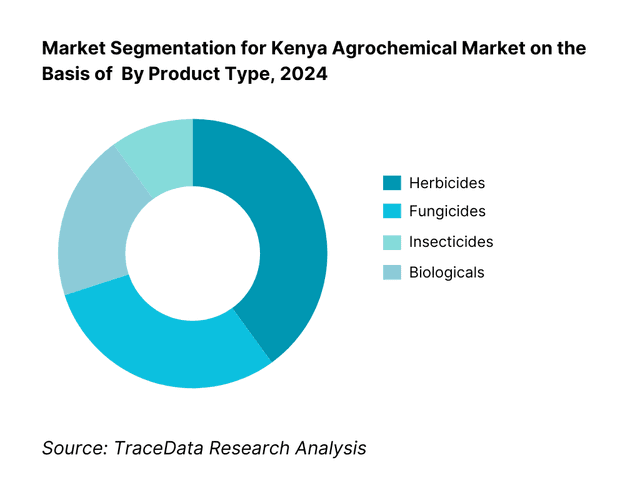
By Product Type: The Kenya agrochemical market is segmented into herbicides, insecticides, fungicides, and biologicals/biopesticides. Currently, herbicides dominate the market share, accounting for roughly 38.8% of registrations and usage volume. This dominance is attributable to widespread weed pressure in key crops like maize and sugarcane, where herbicides remain the most efficient control method. Established farmer familiarity, simpler application, and faster action contribute to herbicide preference. The relatively low penetration of biologicals—though growing—is constrained by limited availability, higher cost, and lower farmer awareness, keeping conventional herbicides in the lead.
By Crop Sector: The market is divided across maize, horticulture (vegetables and floriculture), tea and coffee estates, and other crops. Maize dominates agrochemical usage due to its status as Kenya’s staple food, high acreage, and vulnerability to multiple pests and weeds, necessitating frequent agrochemical interventions. Horticulture, especially vegetables and flowers for export, also commands a substantial share due to stringent residue compliance needs and intensive protection procedures. Tea and coffee follow, with estates applying regular fungicides and insecticides to ensure quality and yield stability. Other crops such as wheat, potatoes, and pulses constitute the remainder, often managed with lower-frequency treatments.

Competitive Landscape in Kenya Agrochemical Market
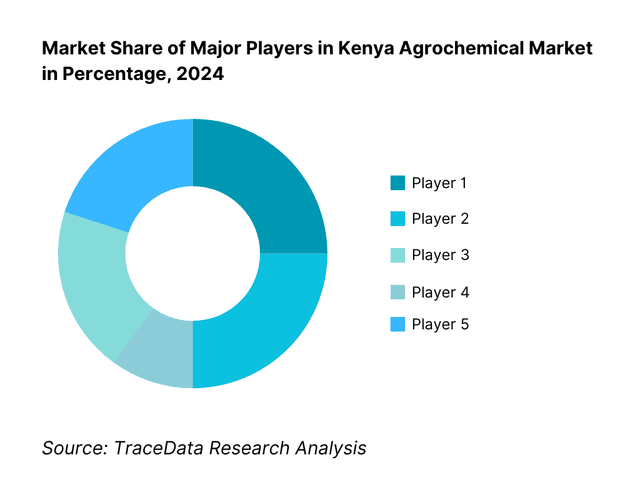
The Kenya agrochemical market is controlled by a few multinationals—Syngenta, Bayer, Corteva, FMC—alongside strong local formulators and re-packagers, indicating a moderately consolidated competitive landscape.
Name | Founding Year | Original Headquarters |
Syngenta | 2000 | Basel, Switzerland |
Bayer (Crop Science) | 1863 | Leverkusen, Germany |
Corteva Agriscience | 2018 | Indianapolis, USA |
FMC Corporation | 1883 | Philadelphia, USA |
BASF | 1865 | Ludwigshafen, Germany |
UPL Limited | 1969 | Mumbai, India |
Koppert Biological Systems | 1967 | Berkel en Rodenrijs, Netherlands |
Twiga Chemical Industries Ltd | 1949 | Nairobi, Kenya |
Osho Chemical Industries Ltd | 1993 | Nairobi, Kenya |
Juanco SPS Ltd | 1996 | Nairobi, Kenya |
HighChem Group | 1999 | Nairobi, Kenya |
Elgon Kenya Ltd | 1898 | Nairobi, Kenya |
Amiran Kenya Ltd | 1963 | Nairobi, Kenya |
Greenlife Crop Protection Africa Ltd | 2012 | Nairobi, Kenya |
Real IPM Kenya Ltd | 2003 | Thika, Kenya |
Some of the Recent Competitor Trends and Key Information About Competitors Include:
Syngenta East Africa: One of the largest multinational agrochemical players in Kenya, Syngenta recently expanded its stewardship programs and introduced new fungicide formulations tailored for horticultural exports, aligning with EU residue compliance requirements.
Bayer East Africa: Bayer has strengthened its crop protection portfolio in Kenya by rolling out integrated pest management (IPM) solutions and supporting farmer training initiatives to promote safe and effective use of high-value fungicides and insecticides.
Corteva Agriscience Kenya: Corteva has focused on maize and horticultural solutions, launching new hybrid seed treatment offerings alongside selective insecticides, addressing pest resistance issues such as fall armyworm.
FMC East Africa: FMC has enhanced its presence in the Kenyan market by promoting pre-mix insecticides and herbicides, designed to manage resistance and improve yield reliability for both smallholders and large estates.
UPL Kenya: UPL has reinforced its strategy around affordable crop protection products, expanding small-pack agrochemical solutions to reach underserved smallholder farmers while simultaneously scaling its biologicals line.
What Lies Ahead for Kenya Agrochemical Market?
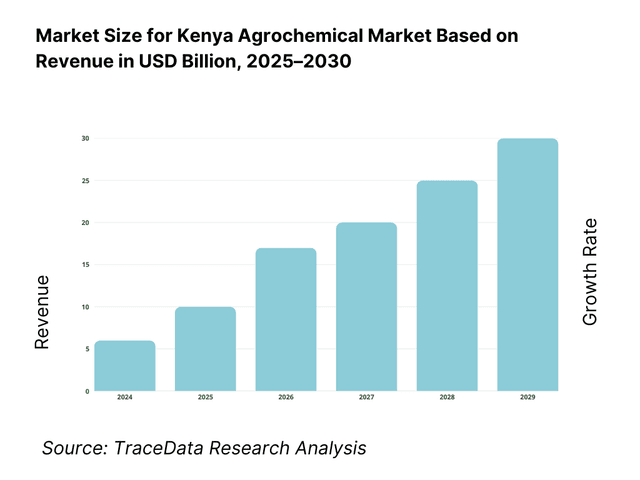
The Kenya agrochemical market is expected to expand steadily over the next five years, supported by strong agricultural fundamentals, export-driven horticulture demand, and evolving regulatory frameworks that prioritize safe and compliant pesticide use. Growth will be reinforced by Kenya’s large rural farming base, intensification of staple crops like maize, and continued investment in horticulture exports to the EU and UK.
Shift Toward Sustainable and Biological Solutions: The future of the Kenya agrochemical market will be shaped by rising adoption of biologicals and integrated pest management (IPM). Export markets are tightening residue limits, and global buyers are rewarding growers who comply with sustainability standards. This trend will push both multinationals and local firms to diversify portfolios with biopesticides, predatory insects, and biostimulants, reducing reliance on conventional chemistries.
Digital Advisory and Precision Application Growth: Digital platforms and precision tools are poised to transform farm-level decision-making in Kenya. From mobile advisory apps for smallholders to drone spraying services for estates, digital technologies will make input use more efficient and traceable. This will allow farmers to optimize chemical application, reduce waste, and align with traceability requirements of export buyers and regulators such as KEPHIS and PCPB.
Sector-Specific Crop Protection Expansion: Different crop sectors are set to experience tailored agrochemical demand. Maize will continue to dominate pesticide volumes due to its large acreage and vulnerability to pests like fall armyworm. Horticulture and floriculture will attract higher-value, compliance-driven crop protection solutions to safeguard exports worth over KSh 153 billion annually. Tea and coffee estates will demand specialized fungicides and herbicides to maintain quality and resist disease pressure.
Strengthened Regulatory Oversight: Kenya’s regulatory environment is tightening with the enforcement of the Pest Control Products (Inspection and Certification) Regulations, 2024. Stronger compliance checks, licensing, and monitoring of agro-dealers will reduce counterfeit infiltration while driving adoption of approved products. This regulatory strengthening will align Kenya with international best practices, fostering trust among growers, exporters, and international buyers.
Kenya Agrochemical Market Segmentation
By Product Type
Herbicides
Insecticides
Fungicides
Adjuvants & Surfactants
Biologicals/Biopesticides
By Crop Sector
Maize
Horticulture (Vegetables & Fruits)
Floriculture (Flowers & Ornamentals)
Tea
Coffee
By Formulation Type
Emulsifiable Concentrates (EC)
Suspension Concentrates (SC)
Wettable Powders (WP)
Water-Dispersible Granules (WG)
Soluble Liquids (SL)
By Application Method
Knapsack Sprayers (Manual)
Motorized Mist Blowers
Aerial/Drone Spraying
Fertigation & Greenhouse Drip
Greenhouse Fogging/ULV Systems
By Distribution Channel
Agro-dealer / Retail Shops (Agrovets)
Primary Distributors & Importers
Farmer Cooperatives & SACCOs
Direct-to-Estates / Export Growers
Digital Platforms & E-commerce
Players Mentioned in the Report:
Syngenta (Kenya)
Bayer AG (Kenya)
Corteva Agriscience (Kenya)
FMC Corporation (Kenya)
BASF East Africa
UPL Kenya
Twiga Chemical Industries Ltd
Osho Chemical Industries Ltd
Juanco SPS Ltd
HighChem Group
Elgon Kenya Ltd
Amiran Kenya Ltd
Greenlife Crop Protection Africa Ltd
Real IPM Kenya Ltd
Koppert Biological Systems Kenya
Key Target Audience
Large-scale agrochemical distributors in Kenya
Agro-dealer franchise groups and county-level input suppliers
Export crop estates and horticulture exporters (e.g., tea, flowers, vegetables)
Farmer co-operative unions and SACCOs procuring agro-inputs
Agricultural input financiers and credit scheme managers
Investments and venture capitalist firms (focused on agricultural input systems)
Government and regulatory bodies: PCPB (Pest Control Products Board), KEPHIS (Kenya Plant Health Inspectorate Service), ACA (Anti-Counterfeit Authority)
Agribusiness insurance and risk-management service providers
Time Period:
Historical Period: 2019-2024
Base Year: 2025
Forecast Period: 2025-2030
Explore Flexible Purchase Options or Have Limited Budget?
Pay only for relevant chapters • Customizable report sections
Table of Contents
Choose individual sections to purchase. Mix and match as you like.
4.1 Delivery Model Analysis for Agrochemicals including direct to estates, agro dealers, cooperative distribution, and digital or e commerce channels with margins, preferences, strengths, and weaknesses
4.2 Revenue Streams for Agrochemical Market including product sales, service spraying, biological and IPM packages, advisory and training services, and credit linked input bundles
4.3 Business Model Canvas for Agrochemical Market covering registrants, toll formulators, distributors, last mile agro dealers, and input credit enablers
5.1 Multinational Players vs Local Formulators including Bayer, Syngenta, Corteva versus Twiga, Osho, Juanco, and other domestic players
5.2 Investment Model in Agrochemical Market including import based models, toll manufacturing, and local repackaging
5.3 Comparative Analysis of Agrochemical Distribution by Private and Government Linked Channels including private dealer chains and county level supply schemes
5.4 Agrochemical Input Budget Allocation by Farm Size comparing smallholders and estates with average spend per acre per season
8.1 Revenues from historical to present period
8.2 Growth Analysis by product segment and by crop sector
8.3 Key Market Developments and Milestones including fall armyworm outbreak, PCPB regulatory reforms, and expansion of biological products
9.1 By Market Structure including multinational players, local formulators, and generic imports
9.2 By Product Type including herbicides, insecticides, fungicides, adjuvants, and biologicals
9.3 By Crop Sector including maize, tea, coffee, horticulture vegetables, and floriculture
9.4 By Farm Size including smallholders, medium scale farms, and estates
9.5 By Farmer Demographics including youth led agribusinesses, cooperative farmers, and large estate managers
9.6 By Application Method including knapsack spraying, motorized sprayers, aerial spraying, and fertigation or greenhouse drip systems
9.7 By Pack Size including small packs for smallholders and bulk packs for estates
9.8 By Region including Rift Valley, Central, Eastern, Western, and Coastal and Nyanza belts
10.1 Farmer Landscape and Cohort Analysis highlighting smallholder dominance and estate clusters
10.2 Agrochemical Purchase Decision Making influenced by dealer trust, extension advice, and export compliance pressure
10.3 Effectiveness and ROI Analysis measuring yield uplift versus cost per acre and export rejection prevention
10.4 Gap Analysis Framework addressing resistance management, counterfeit infiltration, and adoption lag for biologicals
11.1 Trends and Developments including shift to low hazard actives, drone spraying services, biological uptake, and dealer financing
11.2 Growth Drivers including export horticulture demand, pest pressure, credit access, and input bundling
11.3 SWOT Analysis comparing local and multinational strengths, regulatory rigor, and counterfeit risk
11.4 Issues and Challenges including resistance, affordability constraints, illegal trade, and MRL compliance
11.5 Government Regulations covering PCPB registration, KEPHIS export compliance, and ACA enforcement actions
12.1 Market Size and Future Potential of biopesticides, biostimulants, and digital advisory applications
12.2 Business Models including IPM service packages and bundled advisory with inputs
12.3 Delivery Models and Type of Solutions including mobile based advisory, drone spraying, and contract services
15.1 Market Share of Key Players by revenues and by product segments
15.2 Benchmark of 15 Key Competitors including Bayer, Syngenta, Corteva, UPL, FMC, BASF, Twiga Chemical Industries, Osho Chemical Industries, Juanco SPS, HighChem, Elgon Kenya, Amiran Kenya, Greenlife Crop Protection Africa, Real IPM Kenya, and Koppert Biological Systems Kenya
15.3 Operating Model Analysis Framework comparing import models, toll manufacturing, and repackaging
15.4 Gartner Magic Quadrant positioning multinational leaders and local challengers
15.5 Bowman’s Strategic Clock analyzing competitive advantage through differentiation versus cost focus
16.1 Revenues with projections
17.1 By Market Structure including multinational players, local players, and generics
17.2 By Product Type including herbicides, insecticides, fungicides, and biologicals
17.3 By Crop Sector including maize, tea, coffee, horticulture, and floriculture
17.4 By Farm Size including smallholders, medium farms, and estates
17.5 By Farmer Demographics including youth, cooperatives, and estates
17.6 By Application Method including knapsack, aerial spraying, and fertigation
17.7 By Pack Size including small packs and bulk packs
17.8 By Region including Rift Valley, Central, Eastern, Western, and Coast and Nyanza
Discuss a Customized Research Scope
Custom research scope • Tailored insights • Industry expertise
Research Methodology
Step 1: Ecosystem Creation
We begin by mapping the entire ecosystem of the Kenya Agrochemical Market, identifying both demand-side and supply-side entities. On the supply side, this includes multinational registrants, local formulators, distributors, and agro-dealer networks, while on the demand side, smallholder farmers, export-oriented estates, cooperatives, and input-financing institutions are captured. Based on this ecosystem, we shortlist 5–6 leading agrochemical companies in Kenya such as Syngenta, Bayer, Corteva, UPL, Twiga Chemicals, and Osho Chemicals, evaluating them on financial performance, registration portfolios, distribution footprint, and client coverage. This groundwork ensures that only the most influential players are selected for deeper analysis.
Step 2: Desk Research
An exhaustive desk research process is then undertaken, drawing from government portals (PCPB registration database, KEPHIS annual reports), trade import data, and company-level information. Proprietary databases and industry articles are used to aggregate industry-level insights, covering pesticide registration volumes, import/export activity, distribution patterns, and stewardship initiatives. At the company level, we analyze press releases, annual filings, product registration lists, and sustainability reports to capture granular details such as portfolio mix, geographic reach, and partnership strategies. This step builds the foundation for market sizing, competitive benchmarking, and segmentation analysis across crops, product types, and regions.
Step 3: Primary Research
We then conduct structured primary research involving in-depth interviews with C-level executives, agronomists, regulators (PCPB, KEPHIS), and end-users such as estate farm managers and cooperative representatives. These interviews validate hypotheses around market structure, product demand, and regulatory compliance, while also authenticating secondary data on registrations and distribution volumes. A bottom-up approach is applied to estimate revenue contributions per company, which is cross-checked through disguised client interviews—posing as potential customers to understand pricing, pack-size strategies, and distribution practices. This stage also yields unique insights into value chain bottlenecks, input credit dynamics, and farmer purchasing behavior.
Step 4: Sanity Check
Finally, we conduct a sanity check using both top-to-bottom and bottom-to-top modeling. Aggregate market estimates derived from company-level revenues and import volumes are reconciled against macro-level indicators such as agricultural value added, arable land size, and crop acreage. This triangulation ensures internal consistency across datasets, mitigating risks of overestimation or underestimation. By aligning field-level inputs with macroeconomic realities and regulatory data, we guarantee that the Kenya Agrochemical Market model is both robust and credible, providing a validated foundation for strategic decision-making.
See What's Inside the Report
Get a preview of key findings, methodology and report coverage
Frequently Asked Questions
The Kenya Agrochemical Market demonstrates strong potential, anchored by pesticide imports valued at approximately USD 177 million in 2024. This potential is driven by the country’s heavy reliance on agriculture, with the sector contributing USD 26.5 billion in value added. Rising pest pressures on staple crops like maize, stringent export requirements for horticulture worth over KSh 153 billion, and limited arable land of about 6.3 million hectares reinforce the long-term demand for effective crop protection inputs across smallholders and large-scale estates.
The Kenya Agrochemical Market is led by global and regional players such as Syngenta, Bayer, Corteva Agriscience, FMC, and UPL, alongside established local companies including Twiga Chemical Industries and Osho Chemical Industries. These firms dominate due to their extensive product registrations with the Pest Control Products Board (PCPB), broad distribution networks spanning all major counties, and strong relationships with cooperatives and export estates. Other notable players include Juanco SPS, Elgon Kenya, Greenlife Crop Protection Africa, and Real IPM Kenya, each bringing specialized portfolios in conventional chemicals or biologicals.
Key growth drivers include Kenya’s large agricultural base, with a rural population of 39.4 million engaged in farming (World Bank), necessitating regular use of agrochemicals. Export horticulture further propels demand, as the sector earned KSh 153.7 billion and required over 373,000 phytosanitary certificates to meet EU compliance standards. Intensification pressures also drive adoption, with fertilizer usage at 35.1 kg per hectare indicating growing input reliance. These dynamics combine to create robust, recurring demand for crop protection products across cereals, horticulture, tea, and coffee.
The market faces challenges including counterfeit infiltration, with seizures of KSh 3.4 million worth of fake agrochemicals and 190,000 counterfeit fertilizer bags reported by the Anti-Counterfeit Authority. Limited arable land, only 11.05% of total land area, magnifies the impact of climate shocks and pest outbreaks, creating volatility in yields. Input affordability remains another hurdle, as smallholders with low purchasing power struggle to finance adequate protection programs, despite agriculture contributing USD 26.5 billion to Kenya’s economy. These barriers underscore the need for stronger regulation, financing, and stewardship programs.
License Options
PDF + Excel
Complete report package
$4,000
Excel Only
Data and analytics
$2,500
Custom Sections
Starts from $100
$0