Kenya Alcoholic Drinks Market Outlook to 2029
By Market Structure, By Product Types (Beer, Wine, Spirits, Others), By Consumer Demographics, By Distribution Channels (On-trade, Off-trade), and By Region
Report Overview
Report Code
TDR0063
Coverage
Middle East
Published
November 2024
Pages
80-100
Flexible Purchase Options
Select and purchase only the chapters you need for your strategic decisions
On This Page
Report Overview
The report titled "Kenya Alcoholic Drinks Market Outlook to 2029 - By Market Structure, By Product Types (Beer, Wine, Spirits, Others), By Consumer Demographics, By Distribution Channels (On-trade, Off-trade), and By Region " provides a comprehensive analysis of the alcoholic drinks market in Kenya. The report covers an overview and genesis of the industry, overall market size in terms of revenue, market segmentation; trends and developments, regulatory landscape, customer-level profiling, issues and challenges, and comparative landscape including competition scenario, cross-comparison, opportunities, bottlenecks, and company profiling of major players in Alcoholic Drinks Market.
Report Coverage
Verified Market Sizing
Multi-layer forecasting with historical data and 5–10 year outlook
Deep-Dive Segmentation
Cross-sectional analysis by product type, end user, application and region
Competitive Benchmarking & Positioning
Market share, operating model, pricing and competition matrices
Actionable Insights & Risk Assessment
High-growth white spaces, underserved segments, technology disruptions and demand inflection points
Review Methodology & Data Structure
Preview report structure, data sources and research framework
Executive Summary
The report titled "Kenya Alcoholic Drinks Market Outlook to 2029 - By Market Structure, By Product Types (Beer, Wine, Spirits, Others), By Consumer Demographics, By Distribution Channels (On-trade, Off-trade), and By Region " provides a comprehensive analysis of the alcoholic drinks market in Kenya. The report covers an overview and genesis of the industry, overall market size in terms of revenue, market segmentation; trends and developments, regulatory landscape, customer-level profiling, issues and challenges, and comparative landscape including competition scenario, cross-comparison, opportunities, bottlenecks, and company profiling of major players in Alcoholic Drinks Market. The report concludes with future market projections based on sales revenue, by market, product types, region, and success case studies highlighting the major opportunities and cautions.
Kenya Alcoholic Drinks Market Overview and Size
The Kenya alcoholic drinks market reached a valuation of KES 150 Billion in 2023, driven by the increasing consumption of alcohol across different social and demographic groups, a growing middle-class population, and the expansion of retail distribution channels. The market is characterized by major players such as East African Breweries Limited (EABL), Keroche Breweries, and imported brands like Heineken and Diageo. These companies are recognized for their extensive product portfolios, strong distribution networks, and innovative marketing strategies aimed at a diverse consumer base.
In 2023, EABL launched new flavored alcoholic beverages targeting young urban consumers, tapping into the rising demand for flavored spirits and ready-to-drink cocktails. Nairobi and Mombasa are key markets due to their high urbanization rates, thriving nightlife, and robust retail infrastructure.
Market Size for Kenya Alcoholic Drinks Industry on the Basis of Revenues in USD Billion, 2018-2024
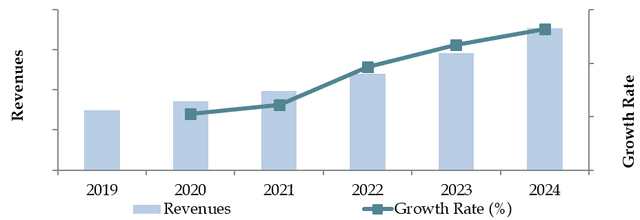
Source: TraceData Research Analysis
What Factors are Leading to the Growth of Kenya Alcoholic Drinks Market:
Economic Factors: The growth of Kenya's economy and the increasing disposable income, especially among the urban population, have significantly contributed to the rise in alcohol consumption. In 2023, alcoholic drinks accounted for a significant portion of the beverage market, driven by the preference for premium and imported products among the affluent population. Local brews, such as traditional liquors and beer, also remain popular among lower-income groups due to their affordability.
Changing Consumer Preferences: A shift in consumer preferences towards premium and craft alcoholic beverages is reshaping the market. Kenyan consumers, particularly millennials and Gen Z, are more health-conscious and are opting for beverages with lower alcohol content, such as ciders, light beers, and non-alcoholic variants. This shift is also driven by global trends towards moderation and mindful drinking, which is expected to continue influencing the market dynamics.
Growth in Retail and Hospitality Sectors: The expansion of retail outlets, supermarkets, and e-commerce platforms has made alcoholic beverages more accessible to consumers. In 2023, over 30% of alcoholic drinks sales in Kenya were attributed to modern trade channels, such as supermarkets and specialized liquor stores, while online platforms are gaining traction. Additionally, the vibrant hospitality industry, with its numerous bars, restaurants, and nightclubs, plays a crucial role in driving on-premise sales of alcoholic drinks.
Which Industry Challenges Have Impacted the Growth for Kenya Alcoholic Drinks Market
High Taxation and Pricing: One of the major challenges faced by the alcoholic drinks market in Kenya is the high taxation on alcohol. The government has imposed heavy excise duties on alcoholic beverages, particularly spirits and beers, which has increased retail prices significantly. In 2023, taxes accounted for approximately 50% of the retail price of alcoholic drinks. This has led to a decline in consumption, particularly among lower-income consumers who are price-sensitive, potentially limiting the growth of the formal alcoholic drinks market.
Regulatory and Compliance Hurdles: Stringent regulations on alcohol production and sales, including restrictions on advertising, licensing challenges, and compliance with health and safety standards, have made it difficult for manufacturers and retailers to operate smoothly. In 2023, around 15% of smaller manufacturers faced operational disruptions due to non-compliance with Kenya's health and safety regulations. These regulatory hurdles can impose significant costs, particularly on smaller players in the market, reducing their ability to compete.
Illicit Alcohol and Counterfeits: The proliferation of illicit alcohol and counterfeit products in Kenya has negatively impacted the formal market. It is estimated that illicit alcohol accounts for over 40% of total alcohol consumption in the country. Consumers, particularly in rural areas, often turn to cheaper, unregulated alcohol options, undermining the revenue growth of legal manufacturers. This issue also poses a serious health risk to consumers, affecting market trust and long-term growth prospects.
What are the Regulations and Initiatives which have Governed the Kenya Alcoholic Drinks Market:
Excise Duty on Alcoholic Beverages: The Kenyan government imposes excise duty on alcoholic beverages, with higher taxes applied to spirits, beers, and wines. In 2023, excise duties on spirits were increased by 15%, making Kenya one of the countries with the highest alcohol taxes in East Africa. This tax hike is part of a broader initiative to reduce alcohol consumption and address related health concerns. However, it has also contributed to the rise in illicit alcohol production as consumers seek cheaper alternatives.
Regulations on Alcohol Advertising and Promotions: To curb excessive alcohol consumption, Kenya has implemented strict regulations on alcohol advertising and promotions. These regulations include restrictions on broadcast timing, bans on outdoor advertising near schools, and mandatory health warnings on alcohol packaging. In 2022, the government banned alcohol promotions offering discounts or free drinks, further tightening control on how alcohol products are marketed to consumers.
Licensing Requirements for Alcohol Manufacturers and Retailers: The Alcoholic Drinks Control Act mandates that all alcohol manufacturers, distributors, and retailers obtain specific licenses to operate. These licenses are issued by county governments and must be renewed annually. In 2023, around 20% of retail outlets faced temporary closures due to non-compliance with licensing regulations, reflecting the government's strict enforcement of these rules to regulate the industry.
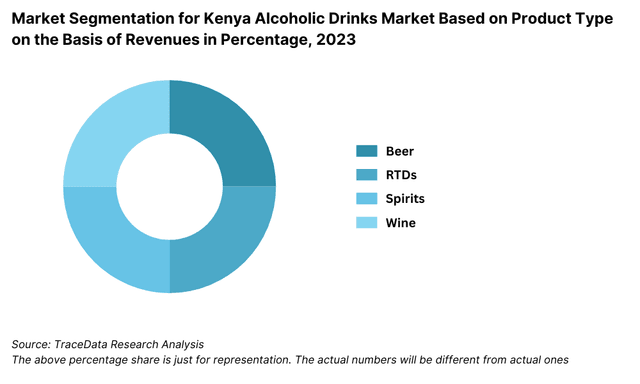
Kenya Alcoholic Drinks Market Segmentation
By Product Type: Beer is the most consumed alcoholic beverage in Kenya, driven by its affordability, wide availability, and strong marketing by major breweries. Spirits, particularly whisky and gin, have seen a rise in popularity, especially among middle- and upper-income consumers in urban areas. Wine consumption, while still relatively low, has been growing as a result of changing consumer preferences and increasing exposure to international products.
By Consumer Age: The Kenyan alcoholic drinks market shows varied consumption patterns across different age groups. Consumers aged 25-34 are the largest segment, as this demographic is highly urbanized and more exposed to nightlife and social drinking cultures. The 18-24 age group, although legally restricted from alcohol consumption under 21 years, is also a key segment due to rising youth alcohol consumption trends, especially in urban areas. Older consumers (45 and above) generally prefer traditional brews and spirits.
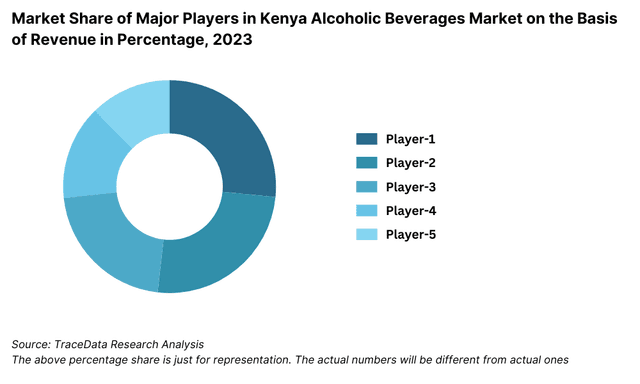
Competitive Landscape in Kenya Alcoholic Drinks Market
The Kenya alcoholic drinks market is relatively concentrated, with a few key players dominating the industry. However, the increasing popularity of local craft breweries and the entrance of international brands have diversified the market, offering consumers more variety and price points. Major players include East African Breweries Limited (EABL), Keroche Breweries, Heineken, Diageo, and several local brewers.
Company Name | Establishment Year | Headquarters |
|---|---|---|
Kenya Breweries Ltd. (Tusker) | 1922 | Nairobi, Kenya |
Heineken East Africa | 1864 | Amsterdam, Netherlands |
Diageo Kenya (EABL) | 1997 | London, United Kingdom |
Carlsberg Group | 1847 | Copenhagen, Denmark |
AB InBev (SABMiller) | 2008 | Leuven, Belgium |
Pernod Ricard Kenya | 1975 | Paris, France |
KWAL (Kenya Wine Agencies) | 1969 | Nairobi, Kenya |
Brown-Forman (Jack Daniel's) | 1870 | Louisville, Kentucky, USA |
Bacardi Limited | 1862 | Hamilton, Bermuda |
Vineyards Holdings (Wines) | 1985 | Nairobi, Kenya |
Some of the recent competitor trends and key information about competitors include:
East African Breweries Ltd (EABL): As the leading alcoholic beverage company in Kenya, EABL recorded over 45% market share in 2023, driven by the popularity of its flagship brands such as Tusker Lager, Guinness, and Johnnie Walker. EABL's strong distribution network and focus on innovation, including the launch of new flavored beverages, have reinforced its dominance in the market.
Keroche Breweries: A local brewing company, Keroche has carved out a niche for itself by offering affordable beer options like Summit Lager. In 2023, Keroche achieved a 10% increase in market share, particularly in rural and semi-urban regions where price sensitivity is higher. The company’s focus on local consumer preferences and its ability to offer competitive prices have contributed to its steady growth.
Heineken: An international player, Heineken has established a strong presence in Kenya, especially in urban areas. The company reported a 15% growth in sales in 2023, fueled by its premium positioning and focus on the urban middle-class and upper-income consumers. The brand's marketing campaigns, targeting social events and nightlife, have enhanced its appeal among younger consumers.
Diageo: As a global beverage giant, Diageo benefits from its ownership stake in EABL, making it a significant player in Kenya’s alcoholic drinks market. In 2023, Diageo's premium spirits brands, such as Johnnie Walker and Smirnoff, saw a 20% increase in sales, particularly among high-income consumers in Nairobi and Mombasa.
Summit Lager (Keroche): Known for its locally produced beer, Summit Lager focuses on affordability while maintaining quality. The brand has expanded its footprint in rural areas, registering a 12% growth in sales in 2023. Summit's competitive pricing and local marketing campaigns have helped it grow its customer base outside major cities.
What Lies Ahead for Kenya Alcoholic Drinks Market?
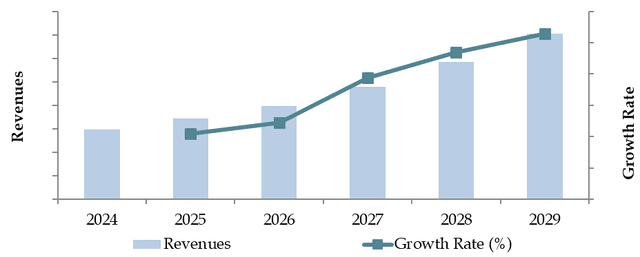
The Kenya alcoholic drinks market is projected to experience steady growth by 2029, with a respectable CAGR during the forecast period. This growth will likely be driven by increasing urbanization, evolving consumer preferences, and a growing middle-class population with rising disposable incomes.
Shift Towards Premium Products: As consumer incomes rise and preferences evolve, there is expected to be a shift towards premium alcoholic beverages, including imported wines, spirits, and craft beers. Consumers, particularly in urban areas, are showing a growing preference for higher-quality drinks, with an increasing focus on international brands and artisanal products.
Expansion of Ready-to-Drink (RTD) and Flavored Beverages: The market for ready-to-drink (RTD) alcoholic beverages, including flavored spirits and cocktails, is projected to expand significantly. These products appeal to young urban consumers who are looking for convenience and new taste experiences. The launch of RTD beverages by major brands in Kenya is anticipated to fuel this growth.
Increased Digitalization in Sales Channels: The integration of digital platforms and e-commerce in alcohol sales is expected to reshape the market. Online sales of alcoholic beverages have gained momentum, particularly during the COVID-19 pandemic, and this trend is expected to continue. Digital platforms offer a convenient way for consumers to purchase alcohol, with home delivery services becoming more prevalent, especially in urban areas.
Rising Health and Wellness Trends: A growing awareness of health and wellness among Kenyan consumers is expected to drive demand for low-alcohol or non-alcoholic alternatives. This includes alcohol-free beers and wines, which are gaining popularity among health-conscious consumers. Major manufacturers are responding to this trend by expanding their portfolios to include these products.
Future Outlook and Projections for Kenya Alcoholic Beverages Market on the Basis of Revenues in USD Billion, 2024-2029
Kenya Alcoholic Drinks Market Segmentation
- By Alcohol Type:
- Beer
- Spirits (Whiskey, Vodka, Rum)
- Wine (Red, White, Sparkling)
- Cider
- Ready-to-Drink (RTD) Cocktails
- By Beer
- Lager
- Dark Beer and others
- By Beer
- Craft
- Standard Beer
- By RTDs
- Malt based RTDs
- Spirit Based RTDs
- Wine Based RTDs
- Non-Alcoholic RTDs and others
- By Spirits
- Brandy
- Dark Rum
- White Rum
- Whiskies
- Gin
- Vodka and others
- By Vodka
- Flavoured
- Non-Flavoured Vodka
- By Wine
- Fortified Wine
- Champagne
- Other Sparkling Wine
- Red Wine
- White Wine and others
- By Distribution Channel:
- On-Trade (Bars, Restaurants, Hotels)
- Off-Trade (Supermarkets, Hypermarkets, Convenience Stores)
- By Price Segment:
- Economy
- Mid-Range
- Premium
- Super Premium
- By Consumer Age:
- 18-24
- 25-34
- 35-54
- 55+
- By Region:
- Nairobi
- Mombasa
- Central Kenya
- Rift Valley
- Nyanza
- Eastern Kenya
- Coastal Region
Players Mentioned in the Report:
- East African Breweries Limited (EABL)
- Kenya Breweries Limited (KBL)
- Kenya Wine Agencies Limited (KWAL)
- Heineken
- Diageo
- Distell Group
- Johnnie Walker
- Richot
- Baileys
- Gilbeys
Key Target Audience:
- Alcoholic Beverage Manufacturers
- Distributors and Wholesalers
- Retail Chains (Supermarkets, Hypermarkets)
- Online Alcoholic Beverage Marketplaces
- Regulatory Bodies (e.g., National Authority for the Campaign Against Alcohol and Drug Abuse, Ministry of Health)
- Research and Development Institutions
Time Period:
- Historical Period: 2018-2023
- Base Year: 2024
- Forecast Period: 2024-2029
Explore Flexible Purchase Options or Have Limited Budget?
Pay only for relevant chapters • Customizable report sections
Table of Contents
Choose individual sections to purchase. Mix and match as you like.
4.1. Value Chain Process-Role of Entities, Stakeholders, Gross Margins, and Challenges they Face
4.2. Business Model Canvas for Kenya Alcoholic Drinks Market
4.3. Consumer Buying Decision Process
5.1. Market Overview and Genesis
5.2. Number of Breweries and Microbreweries, as on Date
8.1. Revenues, 2018-2024
8.2. Sales Volume, 2018-2024
9.1. By Type (Beer, Cider, RTDs, Spirits and Wine), 2018-2023
9.1.1. By Beer (Lager, Dark Beer and others), 2018-2023
9.1.1.1. By Lager (Domestic Premium and Imported Premium), 2018-2023
9.1.1.2. By Craft and Standard Beer, 2018-2023
9.1.1.3. By Price (Super Premium, Premium, Standard and Economy), 2018-2023
9.1.2. By RTDs (Malt based RTDs, Spirit Based RTDs, Wine Based RTDs, Non-Alcoholic RTDs and others), 2018-2023
9.1.2.1. By Price (Super Premium, Premium, Standard and Economy), 2018-2023
9.1.3. By Spirits (Brandy, Dark Rum, White Rum, Whiskies, Gin, Vodka and others), 2018-2023
9.1.3.1. By Price (Super Premium, Premium, Standard and Economy), 2018-2023
9.1.3.2. By Flavoured and Non-Flavoured Vodka, 2018-2023
9.1.4. By Wine (Fortified Wine, Champagne, Other Sparkling Wine, Red Wine, White Wine and others), 2018-2023
9.1.4.1. By Price (Super Premium, Premium, Standard and Economy), 2018-2023
9.2. By Off Trade and On Trade for Each Type of Alcoholic Beverages, 2023
9.2.1. By Distribution Channel for Off Trade, 2023
9.3. By Region, 2023-2024P
10.1. Customer Landscape and Segment Analysis
10.2. Customer Journey and Decision-Making Process
10.3. Consumer Needs, Preferences, and Pain Points
10.4. Gap Analysis Framework
11.1. Trends and Developments in Kenya Alcoholic Drinks Market
11.2. Growth Drivers for Kenya Alcoholic Drinks Market
11.3. SWOT Analysis for Kenya Alcoholic Drinks Market
11.4. Issues and Challenges for Kenya Alcoholic Drinks Market
11.5. Government Regulations for Kenya Alcoholic Drinks Market
14.1. Market Share of Key Players in Alcoholic Beverages Market, 2023
14.2. Market Share of Key Players in Beer Market, 2023
14.3. Market Share of Key Players in Wine Market, 2023
14.4. Market Share of Key Players in Spirits Market, 2023
14.5. Market Share of Key Players in RTDs Market, 2023
14.6. Benchmark of Key Competitors in Kenya Alcoholic Drinks Market Basis 15-20 Operational and Financial Parameters
14.7. Strength and Weakness of Key Competitors
14.8. Operating Model Analysis Framework
14.9. Gartner Magic Quadrant for Market Positioning
14.10. Bowmans Strategic Clock for Competitive Advantage
15.1. Revenues, 2025-2029
15.2. Sales Volume, 2025-2029
16.1. By Type (Beer, Cider, RTDs, Spirits and Wine), 2025-2029
16.1.1. By Beer (Lager, Dark Beer and others), 2025-2029
16.1.1.1. By Lager (Domestic Premium and Imported Premium), 2025-2029
16.1.1.2. By Craft and Standard Beer, 2025-2029
16.1.1.3. By Price (Super Premium, Premium, Standard and Economy), 2025-2029
16.1.2. By RTDs (Malt based RTDs, Spirit Based RTDs, Wine Based RTDs, Non-Alcoholic RTDs and others), 2025-2029
16.1.2.1. By Price (Super Premium, Premium, Standard and Economy), 2025-2029
16.1.3. By Spirits (Brandy, Dark Rum, White Rum, Whiskies, Gin, Vodka and others), 2025-2029
16.1.3.1. By Price (Super Premium, Premium, Standard and Economy), 2025-2029
16.1.3.2. By Flavoured and Non-Flavoured Vodka, 2025-2029
16.1.4. By Wine (Fortified Wine, Champagne, Other Sparkling Wine, Red Wine, White Wine and others), 2025-2029
16.1.4.1. By Price (Super Premium, Premium, Standard and Economy), 2025-2029
16.2. By Off Trade and On Trade for Each Type of Alcoholic Beverages, 2025-2029
16.2.1. By Distribution Channel for Off Trade, 2025-2029
16.3. By Region, 2025-2029
17.1. Strategic Recommendations
17.2. Opportunity Identification
Discuss a Customized Research Scope
Custom research scope • Tailored insights • Industry expertise
Research Methodology
Step 1: Ecosystem Creation
Mapping the Ecosystem: We begin by mapping the ecosystem and identifying all the key demand and supply entities for the Kenya Alcoholic Drinks Market. This includes large-scale manufacturers, distributors, retailers, and consumers. Based on this ecosystem, we shortlist 5-6 major alcoholic beverage producers in the country, selecting them based on their financial performance, production volume, and market share.
Sourcing Information: Information is sourced through industry reports, secondary research, and proprietary databases to gather a comprehensive understanding of the market. This desk research helps us collate relevant industry-level data, including production capacity, pricing, demand trends, and other key variables.
Step 2: Desk Research
Conducting Desk Research: A thorough desk research process is initiated by referencing multiple secondary sources and proprietary databases. This allows us to perform an extensive analysis of the alcoholic drinks market in Kenya, examining aspects such as sales revenue, market players, pricing strategies, and consumer demand. Additionally, we analyze company-level data, including annual reports, financial statements, and press releases from leading manufacturers such as East African Breweries Ltd (EABL) and Keroche Breweries. This phase helps us build a foundational understanding of both the market dynamics and the key players operating within it.
Step 3: Primary Research
In-depth Interviews: We conduct a series of interviews with senior executives and other stakeholders from key companies within the Kenyan alcoholic drinks market. These interviews serve to validate the hypotheses generated from our desk research and authenticate the statistical data collected. This bottom-to-top approach enables us to estimate volume sales for each player and aggregate these figures to calculate the overall market size.
Disguised Interviews: Our team also conducts disguised interviews by approaching companies as potential customers. This allows us to cross-check the operational and financial data shared by executives and validate the information against what is available in secondary sources. These interactions provide insights into revenue streams, value chains, pricing structures, and other factors that influence the market.
Step 4: Sanity Check
- Top to Bottom and Bottom to Top Analysis: We perform both top-down and bottom-up analysis and market size modeling to ensure the accuracy and reliability of our data. This sanity check process helps validate our findings, ensuring that the market size estimates and forecasts are robust and well-supported by the data collected through both primary and secondary research methods.
See What's Inside the Report
Get a preview of key findings, methodology and report coverage
Frequently Asked Questions
The Kenya alcoholic drinks market is expected to experience steady growth, with a projected market valuation of KES 150 Billion in 2023. This growth is driven by increasing urbanization, rising disposable incomes, and evolving consumer preferences for premium and flavored alcoholic beverages. Additionally, the expansion of organized retail channels and the increasing role of digital sales platforms will further unlock market potential.
Key players in the Kenya alcoholic drinks market include East African Breweries Ltd (EABL), Keroche Breweries, Heineken, and Diageo. These companies dominate the market due to their strong brand presence, wide distribution networks, and diverse product portfolios. Other notable players include Bacardi and Pernod Ricard, which cater to the growing demand for premium spirits and wines.
The primary growth drivers include rising disposable incomes, increasing urbanization, and changing consumer preferences towards premium and flavored beverages. The expansion of the middle class in Kenya, along with the rise in social drinking culture among younger consumers, has also contributed to the market’s growth. Moreover, the growing popularity of ready-to-drink (RTD) alcoholic beverages is expected to play a significant role in driving market demand.
The Kenya alcoholic drinks market faces several challenges, including high taxation on alcoholic beverages, which raises retail prices and encourages the consumption of illicit alcohol. Regulatory hurdles, such as stringent advertising restrictions and licensing requirements, also pose significant barriers. Additionally, the proliferation of counterfeit and illicit alcohol products affects both consumer health and the overall growth of the formal market.
License Options
PDF + Excel
Complete report package
$4,000
Excel Only
Data and analytics
$2,500
Custom Sections
Starts from $100
$0