Kenya Automation & Robotics in Manufacturing Market Outlook to 2030
By Market Structure, By Automation Technology, By End-Use Industry, By Component, By Deployment Scale, and By Region
- Product Code: TDR0321
- Region: Africa
- Published on: September 2025
- Total Pages: 80
Report Summary
The report titled “Kenya Automation & Robotics in Manufacturing Market Outlook to 2030 – By Market Structure, By Automation Technology, By End-Use Industry, By Component, By Deployment Scale, and By Region” provides a comprehensive analysis of Kenya’s industrial automation and robotics landscape. The study covers the overview and genesis of the industry, overall market size in revenue terms, and a detailed market segmentation. The report further examines trends and developments, the regulatory landscape, customer-level profiling, and issues & challenges. The competitive landscape covers the competition scenario, cross-comparison on Kenya-specific parameters, opportunities and bottlenecks, and company profiling of major OEMs, distributors, and local system integrators. The report concludes with future market projections based on installed cell volumes, application mix, regional roll-outs, financing models (lease/RaaS), and cause-and-effect relationships linking policy, utilities, trade flows, and skills to automation demand. It also includes success case studies highlighting productivity uplift, quality/yield gains, HSE improvements, and commissioning playbooks—pinpointing the major opportunities and cautions for stakeholders planning investments or scale-ups through 2030.
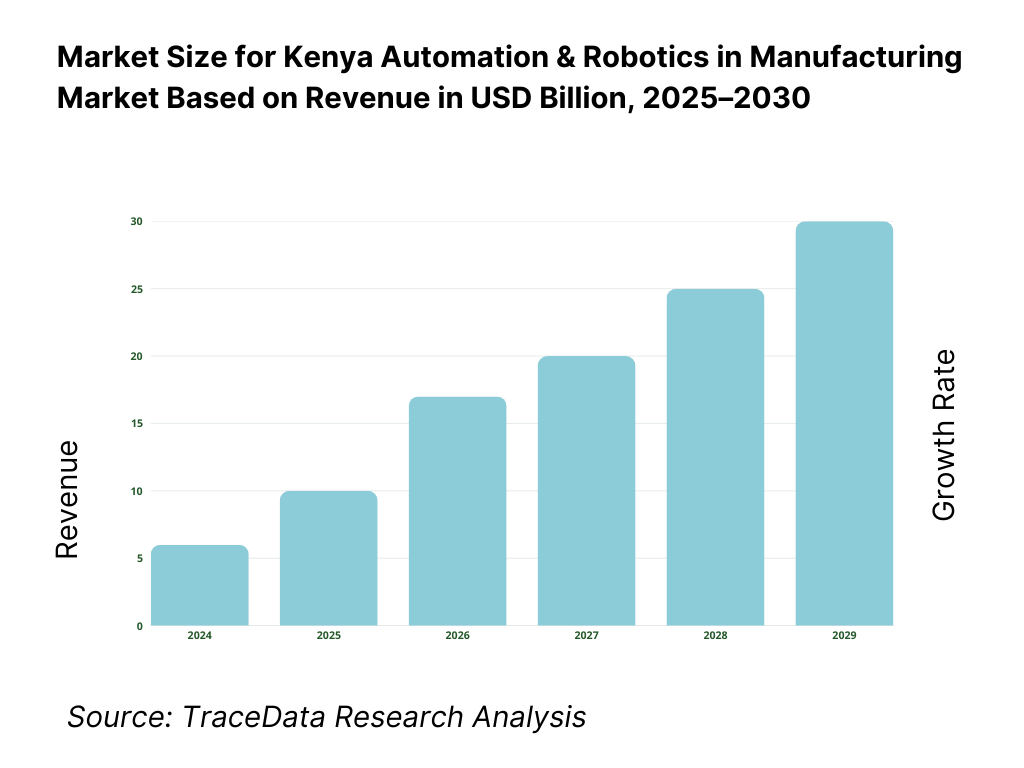
Kenya Automation & Robotics in Manufacturing Market Overview and Size
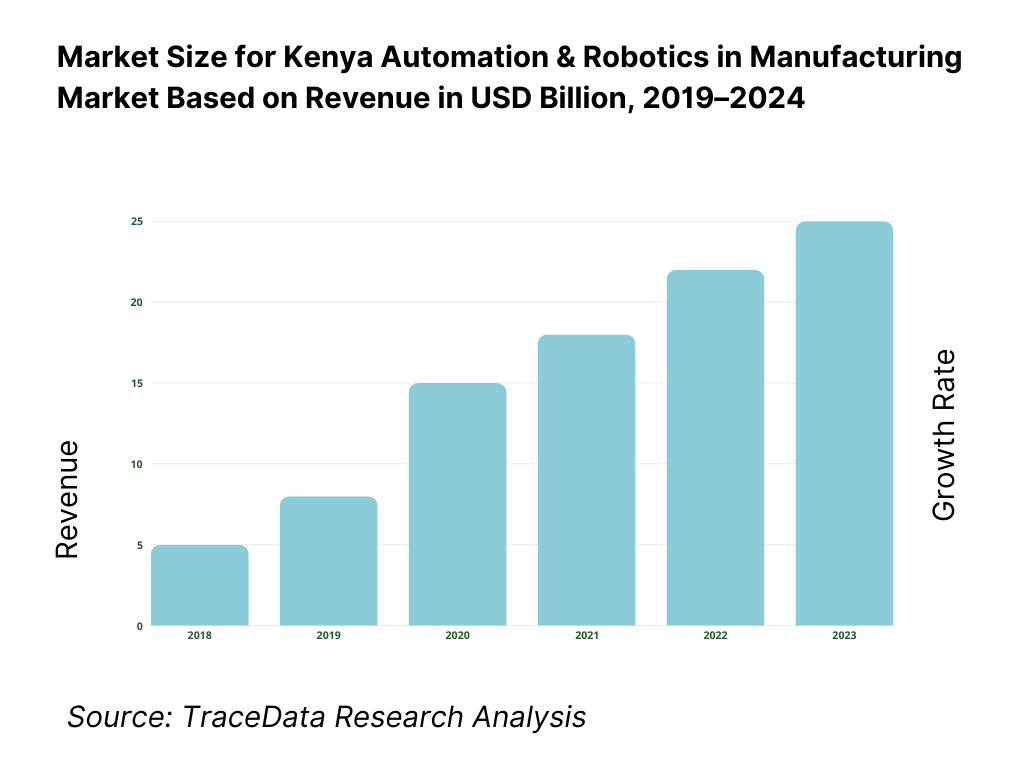
The Kenya industrial automation and robotics market is valued at approximately USD 430 million, reflecting regional data for Middle East & Africa for 2022, which serves as the most credible proximate figure for Kenya’s standalone market. The following year saw continued momentum, with the Middle East & Africa industrial robotics market projected to reach USD 872 million—suggesting Kenya’s portion grew into the USD 450 million range in 2023, while reaching USD 500 million in 2024 through expanded automation investments across manufacturing, oil & gas, and food & beverage sectors.
The market’s growth centers on major urban and industrial hubs—Nairobi, Mombasa, and Kisumu—where activity clusters around food processing, consumer goods fabrication, and cement production. Nairobi houses most integrators, OEM offices, and system integrator companies, while Mombasa’s port infrastructure supports machinery imports and spare parts logistics. Kisumu supports agro-processing and lighter manufacturing, benefitting from regional trade links.
What Factors are Leading to the Growth of the Kenya Automation & Robotics in Manufacturing Market:
Energy backbone enabling 24/7 automated operations: Kenya’s grid has the scale and mix that manufacturers need to run robots and high-throughput process controls continuously. Installed electricity capacity stood at 3,321 MW—anchored by geothermal baseload—supporting round-the-clock plant schedules and intralogistics automation. Geothermal output itself delivered 5,707.71 GWh in the most recent reporting year, with installed geothermal capacity at 943.7 MW—critical for stable voltage/frequency on automated lines. To hedge intermittency and outages, industry has also built 574.6 MW of captive generation (biomass, solar, hydro), creating a reliable power envelope for PLC/SCADA and robot cells.
Logistics gateway scale for machinery inflows and export-grade processing: Automation adoption correlates with trade volume and port performance because robot cells, motion systems, and vision equipment rely on timely imports and after-sales spares. The Port of Mombasa handled 1.623 million TEUs and then 2.005 million TEUs the following year, alongside 41.1 million tons of total cargo—easing inbound lead times for robots, drives and sensors, and supporting export-grade F&B and pharma packaging. Container and general cargo throughput at this scale underpins predictable commissioning and maintenance windows for automated lines across Nairobi/Thika, Athi River, and Naivasha clusters.
Digital/skills foundation for Industry 4.0 deployments: Automation rollouts increasingly depend on connected PLCs, MES, and remote diagnostics. Kenya’s networks and skills pipeline provide that base. Active data/internet subscriptions reached 52.5 million, with reported 42.35 million smartphones supporting mobile HMI, AR work instructions and telemetry. The TVET system reported 532,329 trainees (as at October) feeding mechatronics, electrical, and maintenance roles for integrators and plant OT teams. Macroeconomic headroom supports capital budgeting: GDP at current prices was USD 124.5 billion, reinforcing demand from FMCG, cement, and agro-processing that drives robotization of packaging/palletizing.
Which Industry Challenges Have Impacted the Growth of the Kenya Automation & Robotics in Manufacturing Market:
Safety compliance and inspection workload stretching plant resources: Automating lines must coexist with rigorous occupational safety regimes governing machines, guarding, and hazardous processes. Kenya’s Directorate of Occupational Safety and Health reported 11,644 plants examined and 10,892 OSH audits, with 9,718 accidents/WIBA cases notified and 871 registered active approved persons. These volumes translate into real engineering effort for risk assessments, interlocks, and functional-safety validation (e.g., ISO 10218/13849 environments), especially at SMEs that are newly adopting cobots and AGVs. Integrators must plan commissioning around inspection calendars and remedial actions that flow from audit findings.
Power reliability gaps prompting parallel energy investments: While grid capacity is expanding, manufacturers still provision redundancy to stabilize sensitive servo drives, robots, and vision systems. Captive generation reached 574.6 MW, indicating significant private investment in behind-the-meter solar/biomass/hydro and hybrid systems to protect uptime of automated cells. Grid-side headroom exists—installed capacity 3,321 MW and geothermal baseload 943.7 MW producing 5,707.71 GWh—but plants often size UPS/ESS and own generation to ride through feeder faults and maintenance outages that can otherwise trip robots and cause scrap. This dual-power architecture adds engineering complexity and capex to automation projects.
Import dependence and FX exposure for automation hardware: Robots, PLCs, drives, sensors, and machine vision are predominantly imported—exposing projects to FX swings and customs lead times. Kenya’s latest trade data shows imports of goods and services at USD 24,401,529,536.13, while the port registered 1.623 million TEUs then 2.005 million TEUs the next year, underlining the scale of external sourcing. These flows are positive for availability but amplify currency-linked pricing and delivery risk during commissioning windows, especially where multi-vendor EOAT and safety components must align on the same changeover.
What are the Regulations and Initiatives which have Governed the Market:
Occupational Safety and Health (OSH) Act compliance for automated plants: Before operating any workplace, registration is mandatory under the OSH Act, with penalties for non-compliance including fines up to 100,000 Kenya shillings and custodial terms stated in law. Enforcement is active, evidenced by 11,644 plants examined and 10,892 audits as part of official oversight. For manufacturers integrating robots and conveyors, this translates into documented risk assessments, guarding, lockout/tagout, and periodic audits aligned to DOSHS procedures, which can influence project timelines and validation steps.
Standards & certification regime led by KEBS: Locally manufactured products require the KEBS Standardization Mark under Section 10 of the Standards Act, while imports apply the Import Standardization Mark with track-and-trace. The current Standards Work Programme tracks 814 draft Kenya Standards across sectors (electro-technical, engineering, food, services, etc.), which feed into conformity assessment for equipment, enclosures, and safety components used on automated lines. Compliance affects commissioning and labelling of integrated systems, especially for F&B and pharma packaging where normative references are embedded in buyer audits.
Special Economic Zones (SEZ) licensing for export-oriented manufacturing: Project sponsors deploying automation in SEZs benefit from a defined licensing pathway and a one-stop service. Government records note 36 gazetted zones and 53 licensed enterprises, with statutory incentives on duties and corporate taxation that improve cash flow for capex-heavy automation cells. SEZ status also interacts with customs processes for robots and spares, shaping delivery and commissioning schedules for greenfield plants in Naivasha, Dongo Kundu, and other sites.
Kenya Automation & Robotics in Manufacturing Market Segmentation
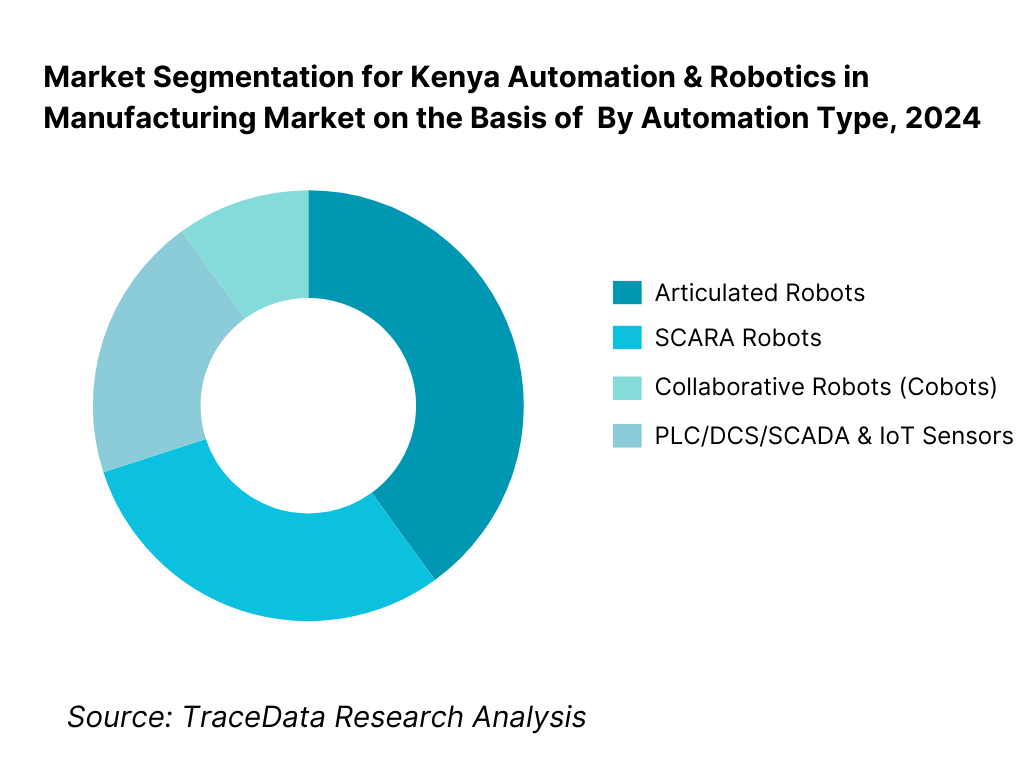
By Automation Type: Kenya’s automation market segments include Industrial Robots (Articulated, SCARA, Collaborative/Cobots) and Control Systems & Sensors (PLC/DCS/SCADA, IoT sensors). In 2024, Collaborative Robots (Cobots) hold the dominant share—accounting for 35% of the segment—driven by affordability, safety, suitability for SMEs, and flexible deployment in assembly, QC, and packing lines. SMEs increasingly adopt cobots due to minimal installation footprint and faster ROI, combined with leasing and RaaS (robotics-as-a-service) models fostering uptake.
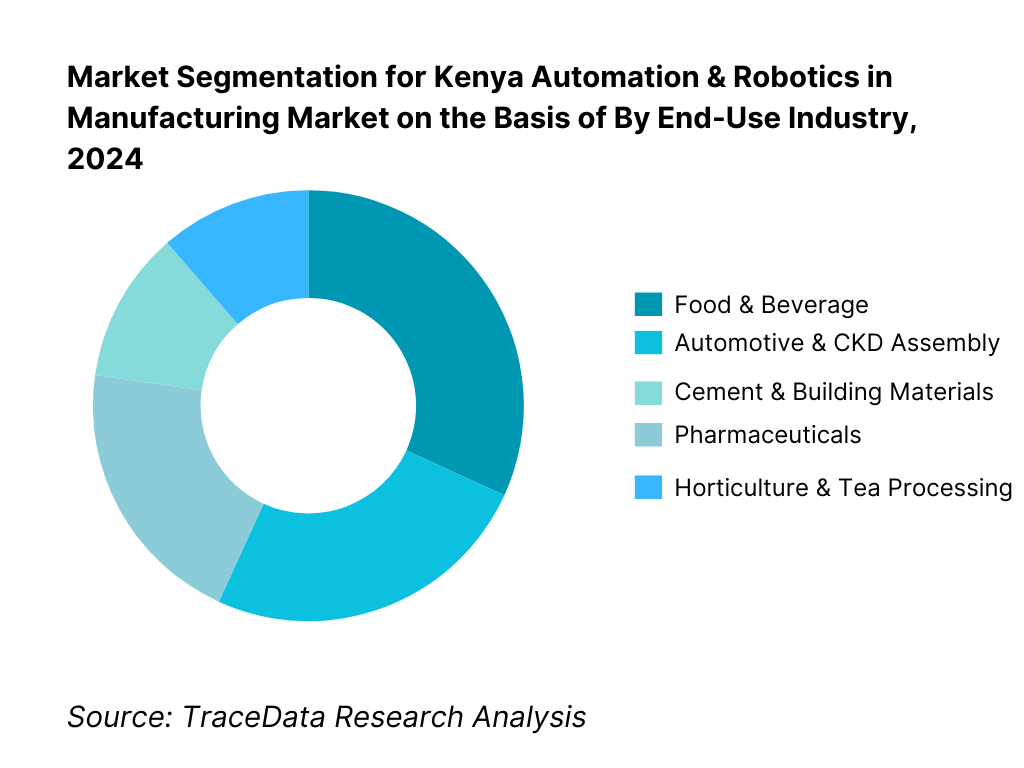
By End-Use Industry: Key verticals include Food & Beverage, Automotive & CKD Assembly, Cement & Building Materials, Pharmaceuticals, and Horticulture & Tea Processing. In 2024, Food & Beverage commands the largest share—30%—as bottling, packaging, and processing lines benefit from automation to meet export compliance, hygiene standards, and batch consistency. The proliferation of breweries, dairy operations, and agro-processors—especially under SEZ frameworks—drive this strong segmental dominance.
Competitive Landscape in Kenya Automation & Robotics in Manufacturing Market
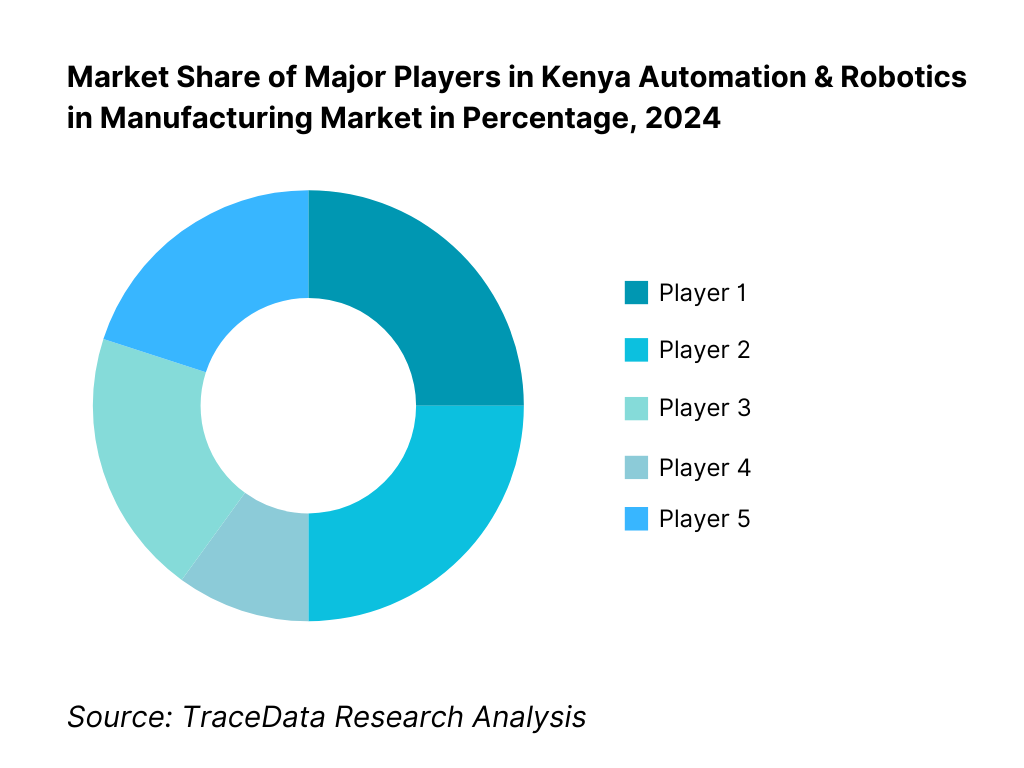
The Kenya automation & robotics market is increasingly populated by both global OEMs (e.g. ABB, Schneider Electric, Rockwell) and local system integrators (e.g. Seamless Process Automation, CET Industrial). This dual structure reflects a mix of advanced technology delivery supported by global players, alongside localized customization and service capabilities offered by domestic integrators.
Name | Founding Year | Original Headquarters |
ABB | 1988 | Zurich, Switzerland |
Siemens | 1847 | Munich, Germany |
Schneider Electric | 1836 | Rueil-Malmaison, France |
Rockwell Automation | 1903 | Milwaukee, USA |
Omron | 1933 | Kyoto, Japan |
Festo | 1925 | Esslingen, Germany |
Phoenix Contact | 1923 | Blomberg, Germany |
SICK | 1946 | Waldkirch, Germany |
ifm electronic | 1969 | Essen, Germany |
Universal Robots | 2005 | Odense, Denmark |
Yaskawa Motoman | 1915 | Kitakyushu, Japan |
FANUC | 1956 | Oshino, Japan |
Bosch Rexroth | 1795 | Lohr am Main, Germany |
Seamless Process Automation | 2010s | Nairobi, Kenya |
CET Industrial | 2010s | Nairobi, Kenya |
Some of the Recent Competitor Trends and Key Information About Competitors Include:
ABB: As one of the global leaders in industrial robotics and automation, ABB has strengthened its presence in Kenya by expanding service centers in Nairobi. In 2024, ABB introduced collaborative robot solutions tailored for food and beverage manufacturers, addressing local demand for packaging and quality inspection automation.
Schneider Electric: Known for its EcoStruxure automation platform, Schneider Electric Kenya has expanded its partnerships with local integrators. In 2024, the company launched energy-efficient PLC and drive systems targeted at cement and building materials plants, highlighting its focus on sustainability in industrial operations.
Rockwell Automation (via Multivista Kenya): Rockwell has been consolidating its footprint by providing PlantPAx DCS solutions for large-scale continuous process industries. In 2024, the company rolled out new financing models, enabling Kenyan SMEs to access automation technologies through vendor credit arrangements.
Universal Robots: A major cobot manufacturer, Universal Robots has seen increased adoption of collaborative robots in Kenyan SMEs across the automotive assembly and horticulture packhouse sectors. In 2024, UR’s distributors reported a 30% increase in cobot installations, particularly in pick-and-place and packaging applications.
Seamless Process Automation: A leading Kenyan system integrator, Seamless Process Automation has expanded its partnerships with Festo and Omron. In 2024, the firm introduced localized training and certification programs for plant engineers, aimed at reducing skills gaps and ensuring safe operation of robotic systems.
What Lies Ahead for Kenya Automation & Robotics in Manufacturing Market?
The Kenya automation and robotics in manufacturing market is expected to expand steadily toward 2030, driven by government-backed industrialization programs, the rapid growth of SEZ/EPZ-based export industries, and the push for efficiency in food, cement, and automotive production. With increased trade volumes through the Port of Mombasa and reliable geothermal power generation, the adoption of robotics and automation is set to accelerate across key sectors.
Rise of Collaborative and Hybrid Automation Models: The future of automation in Kenya is likely to feature a blend of traditional industrial robots with collaborative robots (cobots) and autonomous mobile robots. This hybrid model offers SMEs a cost-effective entry point while allowing large manufacturers to scale automation in phases.
Shift Towards Outcome-Based Automation Investments: As Kenyan manufacturers seek measurable improvements in OEE, downtime reduction, and export compliance, automation projects will increasingly be benchmarked against specific outcomes. Robots will be deployed not just for speed, but also for defect reduction, traceability, and sustainability metrics.
Expansion of Sector-Specific Automation: Food & beverage, horticulture, and pharmaceuticals will demand tailored robotics solutions—from high-speed packaging cobots to vision-based grading systems and sterile handling cells. These verticals will dominate investment pipelines due to their strong export linkages and strict quality standards.
Leveraging AI, IoT, and Analytics: The use of AI-powered vision systems, predictive maintenance algorithms, and IoT-driven robotics is expected to rise. This will allow manufacturers to monitor machine health, predict breakdowns, and optimize energy consumption, ultimately improving ROI and enabling smarter factories across Kenya’s industrial clusters.
Kenya Automation & Robotics in Manufacturing Market Segmentation
By Automation Technology
Articulated Robots
SCARA Robots
Collaborative Robots (Cobots)
AGVs/AMRs (Automated Guided Vehicles / Autonomous Mobile Robots)
Vision & Sensor Systems (2D/3D cameras, safety scanners, IoT sensors)
By End-Use Industry
Food & Beverage (bottling, dairy, packaging)
Automotive & CKD Assembly
Cement & Building Materials
Pharmaceuticals & Medical Devices
Horticulture & Tea Processing
By Component
Robots & End-of-Arm Tooling (EOAT)
Controllers/PLCs/Drives
Safety Systems (fencing, light curtains, safety PLCs)
Sensors & Vision Systems
Software (SCADA, MES, Predictive Analytics)
By Plant Size / Deployment Scale
Large Continuous Process Plants
Mid-Sized Enterprises
Small & Medium Enterprises (SMEs)
Greenfield Installations
Brownfield Retrofits
By Region
Nairobi/Thika Industrial Cluster
Mombasa (Port & Logistics-Linked Industry)
Athi River / Machakos SEZ Zone
Naivasha (Agro-processing & Export Packhouses)
Eldoret/Kisumu (Agro-industrial & Regional Trade Hubs)
Players Mentioned in the Report:
ABB Kenya
Schneider Electric Kenya
Rockwell Automation (via Multivista Kenya)
Universal Robots (Distributor)
Seamless Process Automation
CET Industrial
Omron Kenya (via Jash Agencies)
Festo (via CET/Partners)
Phoenix Contact (via IET Kenya)
SICK (via regional distribution)
Yaskawa Motoman (regional hub)
FANUC (via regional network)
Bosch Rexroth Kenya
ifm electronic (via distributors)
Festo Didactic (training solutions)
Key Target Audience
Manufacturing plant CFOs
Operations directors of SEZ/EPZ-based manufacturers
Investment & venture capitalist firms
Government and regulatory bodies (e.g., SEZA, KEBS, NITA)
Industrial park developers
Energy/utilities procurement planners
OEM regional expansion managers
Distributor and integrator strategic leads
Time Period:
Historical Period: 2019-2024
Base Year: 2025
Forecast Period: 2025-2030
Report Coverage
Choose individual sections to purchase. Mix and match as you like.
4.1 Delivery Model Analysis for Agrochemicals (direct-to-estates, agro-dealers, co-op distribution, digital/e-commerce)-margins, preference, strengths & weaknesses
4.2 Revenue Streams for Agrochemical Market (product sales, service spraying, biologicals/IPM packages, advisory & training, credit-linked input bundles)
4.3 Business Model Canvas for Agrochemical Market (registrants, toll formulators, distributors, last-mile agro-dealers, input credit enablers)
5.1 Multinational Players vs Local Formulators (Bayer, Syngenta, Corteva vs Twiga, Osho, Juanco, etc.)
5.2 Investment Model in Agrochemical Market (import-based, toll manufacturing, local repackaging)
5.3 Comparative Analysis of Agrochemical Distribution by Private & Government-Linked Channels (private dealer chains vs county-level supply schemes)
5.4 Agrochemical Input Budget Allocation by Farm Size (smallholders vs estates, average spend per acre per season)
8.1 Revenues (historical to present)
8.2 Growth Analysis (by product segment, by crop sector)
8.3 Key Market Developments and Milestones (fall armyworm outbreak, PCPB regulatory reforms, expansion of biologicals)
9.1 By Market Structure (multinational, local formulator, generic imports)
9.2 By Product Type (herbicides, insecticides, fungicides, adjuvants, biologicals)
9.3 By Crop Sector (maize, tea, coffee, horticulture vegetables, floriculture)
9.4 By Farm Size (smallholders, medium-scale farms, estates)
9.5 By Farmer Demographics (youth-led agribusinesses, co-op farmers, large estate managers)
9.6 By Application Method (knapsack, motorized sprayers, aerial spraying, fertigation/greenhouse drip)
9.7 By Pack Size (small packs for smallholders, bulk packs for estates)
9.8 By Region (Rift Valley, Central, Eastern, Western, Coastal/Nyanza belts)
10.1 Farmer Landscape and Cohort Analysis (smallholder dominance, estate clusters)
10.2 Agrochemical Purchase Decision-Making (dealer trust, extension advice, export compliance pressure)
10.3 Effectiveness & ROI Analysis (yield uplift vs cost per acre, export rejection prevention)
10.4 Gap Analysis Framework (resistance management, counterfeit infiltration, adoption lag for biologicals)
11.1 Trends and Developments (shift to low-hazard actives, drone spraying services, biologicals uptake, dealer financing)
11.2 Growth Drivers (export horticulture, pest pressure, credit access, input bundles)
11.3 SWOT Analysis (local vs multinational strengths, regulatory rigor, counterfeit risk)
11.4 Issues and Challenges (resistance, affordability, illegal trade, MRL compliance)
11.5 Government Regulations (PCPB registration, KEPHIS export compliance, ACA seizures)
12.1 Market Size and Future Potential (biopesticides, biostimulants, digital advisory apps)
12.2 Business Models (IPM service packages, bundled advisory + inputs)
12.3 Delivery Models and Type of Solutions (mobile-based advisory, drone spraying, contract services)
15.1 Market Share of Key Players (by revenues, by product segments)
15.2 Benchmark of 15 Key Competitors (Bayer, Syngenta, Corteva, UPL, FMC, BASF, Twiga Chemical Industries, Osho Chemical Industries, Juanco SPS, HighChem, Elgon Kenya, Amiran Kenya, Greenlife Crop Protection Africa, Real IPM Kenya, Koppert Biological Systems Kenya)
15.3 Operating Model Analysis Framework (import vs toll manufacturing vs repackaging)
15.4 Gartner Magic Quadrant (multinational leaders vs local challengers)
15.5 Bowman’s Strategic Clock (competitive advantage through differentiation vs cost focus)
16.1 Revenues (projections)
17.1 By Market Structure (multinational vs local players vs generics)
17.2 By Product Type (herbicides, insecticides, fungicides, biologicals)
17.3 By Crop Sector (maize, tea, coffee, horticulture, floriculture)
17.4 By Farm Size (smallholders, medium, estates)
17.5 By Farmer Demographics (youth, co-ops, estates)
17.6 By Application Method (knapsack, aerial, fertigation)
17.7 By Pack Size (small vs bulk)
17.8 By Region (Rift Valley, Central, Eastern, Western, Coast/Nyanza)
Research Methodology
Step 1: Ecosystem Creation
Map the ecosystem and identify all the demand-side and supply-side entities for the Kenya Automation & Robotics in Manufacturing Market. Based on this ecosystem, we will shortlist leading 5–6 automation solution providers and system integrators in the country based on their financial information, market reach, and client base. Sourcing is conducted through industry articles, multiple secondary, and proprietary databases to perform desk research around the market to collate industry-level information.
Step 2: Desk Research
Subsequently, we engage in an exhaustive desk research process by referencing diverse secondary and proprietary databases. This approach enables us to conduct a thorough analysis of the market, aggregating industry-level insights. We delve into aspects like automation adoption across end-user industries, number of integrators and distributors, technology penetration (robots, PLCs, SCADA, sensors), demand, and other variables. We supplement this with detailed examinations of company-level data, relying on sources like press releases, annual reports, financial statements, and similar documents. This process aims to construct a foundational understanding of both the market and the entities operating within it.
Step 3: Primary Research
We initiate a series of in-depth interviews with C-level executives and other stakeholders representing various Kenya Automation & Robotics in Manufacturing Market companies and end-users. This interview process serves a multi-faceted purpose: to validate market hypotheses, authenticate statistical data, and extract valuable operational and financial insights from these industry representatives. A bottom-to-top approach is undertaken to evaluate revenue contributions for each player, thereby aggregating to the overall market. As part of our validation strategy, our team executes disguised interviews wherein we approach each company under the guise of potential clients. This approach enables us to validate the operational and financial information shared by company executives, corroborating this data against what is available in secondary databases. These interactions also provide us with a comprehensive understanding of revenue streams, value chains, processes, pricing, and other factors.
Step 4: Sanity Check
A bottom-to-top and top-to-bottom analysis along with market size modeling exercises is undertaken to assess the sanity of the process.
FAQs
01 What is the Potential for the Kenya Automation & Robotics in Manufacturing Market?
The Kenya Automation & Robotics in Manufacturing Market is poised for substantial growth, reaching a valuation of USD 450 million in 2023. This growth is driven by expanding manufacturing capacity, increased SEZ/EPZ activity, and rising demand for efficiency across food, cement, automotive, and pharmaceutical sectors. The market’s potential is further bolstered by Kenya’s stable geothermal-powered electricity grid, which supports continuous operations, and government incentives that encourage industrial modernization.
02 Who are the Key Players in the Kenya Automation & Robotics in Manufacturing Market?
The Kenya Automation & Robotics in Manufacturing Market features several key players, including ABB, Siemens, and Schneider Electric, which dominate through advanced automation solutions and global experience. Local integrators such as Seamless Process Automation and CET Industrial are critical in customizing deployments, training plant staff, and ensuring after-sales support. Other notable players include Rockwell Automation, Omron, Universal Robots, Festo, Phoenix Contact, SICK, ifm electronic, Yaskawa Motoman, FANUC, and Bosch Rexroth.
03 What are the Growth Drivers for the Kenya Automation & Robotics in Manufacturing Market?
The primary growth drivers include strong industrial output, supported by a GDP of USD 124.5 billion, and reliable power generation capacity of 3,321 MW with 943.7 MW from geothermal sources. Kenya’s Port of Mombasa handled 2.0 million TEUs in cargo, ensuring reliable import of robotics hardware. Additionally, the country’s 52.5 million active data subscriptions and a TVET enrollment of 532,329 trainees ensure the digital and workforce backbone required for scaling automation projects.
04 What are the Challenges in the Kenya Automation & Robotics in Manufacturing Market?
The Kenya Automation & Robotics in Manufacturing Market faces several challenges, including safety and regulatory compliance under the OSH Act, with 11,644 plants inspected by DOSHS in the last reporting year. Import dependence also creates exposure to exchange rate fluctuations, with Kenya recording USD 24.4 billion in imports. Furthermore, reliability of power supply remains a concern, leading to parallel investment in 574.6 MW of captive generation, which increases costs for manufacturers. These factors present barriers that companies must navigate to sustain automation adoption.