Kenya B2B Marketplaces Market Outlook to 2030
By Market Structure, By Vertical, By Fulfillment Modality, By Buyer Profile, By Payments & Credit, and By Region
Report Overview
Report Code
TDR0379
Coverage
Africa
Published
November 2025
Pages
80
Flexible Purchase Options
Select and purchase only the chapters you need for your strategic decisions
On This Page
Report Overview
The report titled “Kenya B2B Marketplaces Market Outlook to 2030 - By Market Structure, By Vertical, By Fulfillment Modality, By Buyer Profile, By Payments & Credit, and By Region” provides a comprehensive analysis of the B2B marketplaces market in Kenya. The report covers an overview and genesis of the industry, overall market size in terms of revenue, market segmentation; trends and developments, regulatory landscape, customer level profiling, issues and challenges, and competitive landscape including competition scenario, cross-comparison, opportunities and bottlenecks, and company profiling of major players in the B2B marketplaces market.
Report Coverage
Verified Market Sizing
Multi-layer forecasting with historical data and 5–10 year outlook
Deep-Dive Segmentation
Cross-sectional analysis by product type, end user, application and region
Competitive Benchmarking & Positioning
Market share, operating model, pricing and competition matrices
Actionable Insights & Risk Assessment
High-growth white spaces, underserved segments, technology disruptions and demand inflection points
Review Methodology & Data Structure
Preview report structure, data sources and research framework
Executive Summary
The report titled “Kenya B2B Marketplaces Market Outlook to 2030 - By Market Structure, By Vertical, By Fulfillment Modality, By Buyer Profile, By Payments & Credit, and By Region” provides a comprehensive analysis of the B2B marketplaces market in Kenya. The report covers an overview and genesis of the industry, overall market size in terms of revenue, market segmentation; trends and developments, regulatory landscape, customer level profiling, issues and challenges, and competitive landscape including competition scenario, cross-comparison, opportunities and bottlenecks, and company profiling of major players in the B2B marketplaces market. The report concludes with future market projections based on order volumes, product and service categories, regions, cause-and-effect relationships, and success case studies highlighting the major opportunities and cautions.
Kenya B2B Marketplaces Market Overview and Size
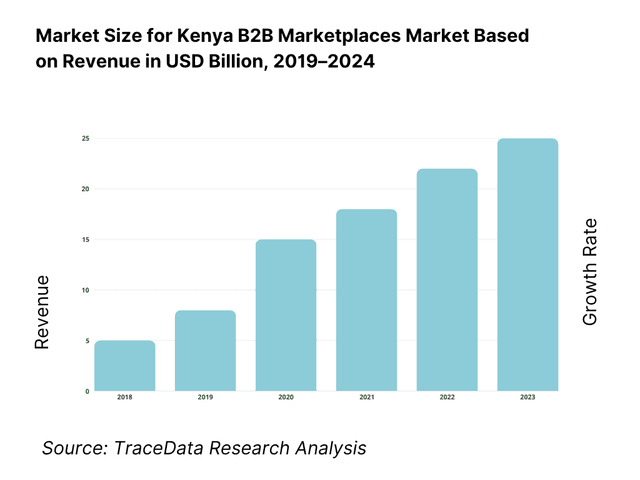
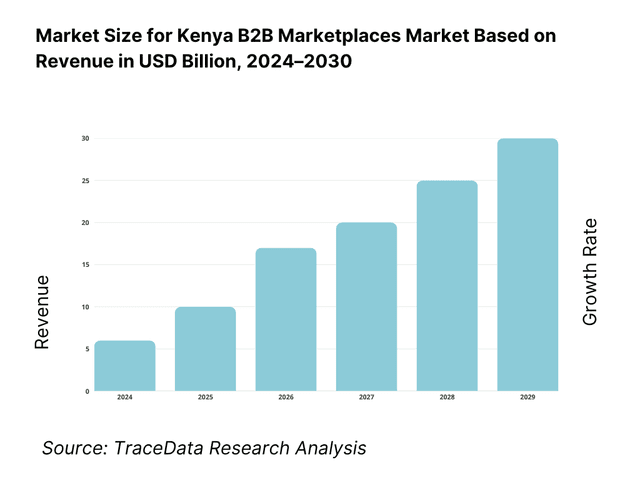
The Kenya B2B marketplace market size is estimated to be USD 1.2 billion in 2023, based on aggregated platform and marketplace revenue disclosures from leading firms coupled with public data on Kenya’s e-commerce growth. This figure is underpinned by a broader e-commerce environment in Kenya where the entire e-commerce GMV for 2023 was ~ USD 2.3 billion (for B2C + others). The B2B subset captures orders placed by informal retailers, small enterprises, clinics, and HORECA via digital platforms. Growth is driven by accelerated mobile penetration, spread of FinTech and digital credit, MSME digitization mandates, and logistics investments. In 2024, the broader e-commerce market is projected to reach USD 2.6 billion, which implies further tailwinds for the B2B segment as digital procurement gains deeper adoption.
Major urban centers like Nairobi, Mombasa, and Kisumu, plus regional trade hubs near the port of Mombasa, dominate the Kenya B2B marketplace landscape. These cities host dense clusters of informal retail (dukas), wholesalers, and distribution nodes. Nairobi’s superior logistics connectivity, concentration of manufacturers and supplier headquarters, and higher digital penetration make it a natural epicenter. The coastal corridor’s proximity to the Port of Mombasa enables efficient import flows for cross-border B2B supply, giving coastal towns an edge in supplier sourcing and inventory turnover. Secondary cities along major trade corridors (e.g. Nakuru, Eldoret) benefit from spill-over distribution demand.
What Factors are Leading to the Growth of the Kenya B2B Marketplaces Market:
Digital rails enable high-frequency B2B ordering and embedded finance: Kenya’s B2B marketplaces are powered by a robust digital infrastructure that connects suppliers and merchants seamlessly. The country has 68.9 million active SIM connections, supporting app-based, USSD, and WhatsApp-enabled ordering systems that allow real-time replenishment and automated invoicing. With 39.8 million active mobile-money users, platforms easily process prepaid, pay-on-delivery, and BNPL transactions. A national economy valued at USD 124.5 billion provides a strong commercial base for trade digitization, while a mature national payments system ensures smooth merchant settlements and reliable transaction records for marketplace players.
Urban trade corridors and port throughput feed reliable wholesale supply: The Port of Mombasa handled 29.92 million tonnes of cargo in the latest nine-month period, demonstrating a strong import pipeline that supplies warehouses, distributors, and B2B hubs across the country. Northern Corridor logistics data confirm 8.79 million tonnes of goods moved in one quarter, emphasizing the constant material flow sustaining FMCG, agriculture, and construction verticals. Kenya’s population of 55.3 million provides dense consumption nodes in Nairobi, Mombasa, and Kisumu, reinforcing city-region fulfillment models that rely on port throughput and upgraded highway infrastructure for consistent stock availability.
Expanding urban consumer–merchant base sustains FMCG and HORECA reorders: An urban population of 16.3 million creates high-frequency reorder cycles for staples and perishables. With 68.9 million SIMs and 39.8 million mobile-money wallets, B2B platforms digitize the procurement of goods for dukas, eateries, clinics, and hotels, increasing order velocity and payment reliability. Kenya’s USD 124.5 billion economy supports the continuous integration of financial and inventory analytics tools within marketplaces, enhancing route optimization, reducing stockouts, and enabling merchants to maintain consistent working capital turnover while scaling transactions nationwide.
Which Industry Challenges Have Impacted the Growth of the Kenya B2B Marketplaces Market:
Tight credit conditions constrain merchant BNPL and supplier working capital: Credit tightening remains a headwind for marketplace liquidity. Private-sector credit growth slowed as government borrowing absorbed domestic funds, reducing access to working capital for MSMEs. Kenya’s USD 124.5 billion economy experiences high lending costs that discourage distributors from extending trade credit or BNPL options. At the same time, increased regulatory scrutiny and merger oversight have limited capital flows into smaller digital distributors, constraining credit lines that merchants rely on for stock replenishment and short-cycle financing.
Fuel and logistics volatility pressure last-mile unit economics: Delivery costs fluctuate with fuel prices hovering around KES 184.52 for petrol and KES 171.47 for diesel. These cost pressures impact margins across short-haul and last-mile delivery operations, particularly for perishables and low-ticket items. With logistics corridors carrying up to 8.79 million tonnes of goods per quarter, congestion delays and unpredictable freight rates raise operating costs for distributors and digital freight brokers alike. Unstable transport costs challenge the viability of guaranteed-delivery SLAs and erode profitability in high-volume, low-margin routes.
Patchy secondary road surfaces complicate cold-chain and heavy loads: Outside trunk corridors, road quality remains uneven. Of 18,662 km under the rural Class-C network, about 9,600 km are unpaved, increasing wear-and-tear on vehicles and raising delivery times to remote counties. This directly affects perishable-goods logistics, where unsealed routes raise temperature-excursion risks and inventory losses. Even with 29.92 million tonnes handled through Mombasa, last-mile inefficiencies persist due to limited all-weather access roads in agricultural and peri-urban markets, inflating cost-per-drop metrics for cold-chain and construction suppliers.
What are the Regulations and Initiatives which have Governed the Market:
Electronic Tax Invoice Management System (eTIMS) — invoicing compliance for B2B transactions: The Kenya Revenue Authority introduced eTIMS to ensure standardized real-time invoicing for all traders. The phased rollout across sectors, including fuel stations and FMCG distributors, mandates digital invoice generation, improving audit trails and reducing tax evasion. Marketplaces must integrate eTIMS APIs for vendor compliance and transaction reconciliation, aligning with KRA’s digital revenue-collection framework. This directly impacts seller onboarding, rebate eligibility, and BNPL verification across digital procurement ecosystems.
Data Protection Act (ODPC) — enforcement shaping platform data practices: The Office of the Data Protection Commissioner strengthened enforcement under the Data Protection Act, issuing fines totaling KES 9.38 million across several entities. With 51 formal rulings recorded during the year, data processing, retention, and consent requirements became central compliance points for marketplaces handling merchant and customer data. Platforms must implement stronger data-security frameworks, audit trails, and privacy protocols, ensuring full transparency in credit scoring and targeted-marketing algorithms used within their digital ecosystems.
Competition Authority of Kenya (CAK) — merger control, buyer power, and digital markets scrutiny: The Competition Authority processed 2,500 merger filings and 1,503 anti-competitive cases over the last fiscal cycle, underscoring vigilant enforcement in Kenya’s digital economy. The introduction of the Competition Amendment Bill adds provisions on superior bargaining position, affecting exclusivity contracts between platforms and suppliers. B2B marketplaces must now demonstrate fair-dealing practices and avoid restrictive pricing models or preferential access for dominant sellers. This regulatory environment promotes transparency but also raises compliance costs for platforms scaling through acquisitions or vendor consolidation.
Kenya B2B Marketplaces Market Segmentation
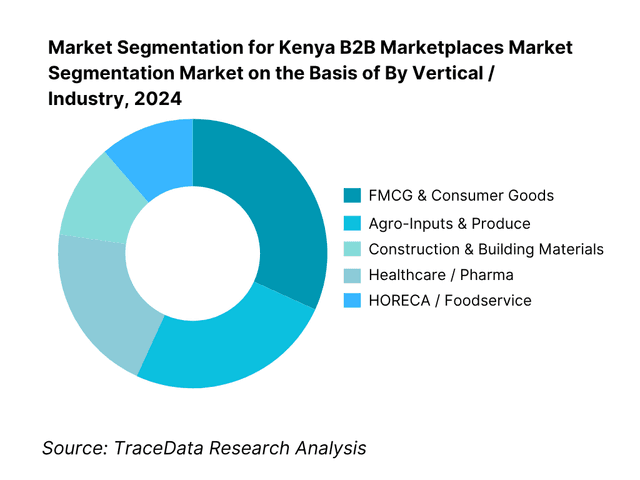
By Vertical / Industry: Within Kenya’s B2B ecosystems, the FMCG & consumer goods vertical holds a dominant share because it comprises fast-moving SKUs, lower risk per unit, and consistent demand from dukas (small retail shops) across all regions. The informal retail sector in Kenya is heavily oriented around staples like cooking oil, flour, soaps, detergents, cereals, and packaged goods. These items fit well into hub-and-spoke, frequent reorder models. Because margins are modest but volumes are high, FMCG is the easiest vertical to scale and monetize via commission or markup models. Platforms can acquire scale rapidly with dense route networks, offering daily or bi-daily delivery. The consistency of demand, lower regulatory complexity, and ability to build predictive ordering models make FMCG the backbone of most Kenya B2B platforms' growth trajectory.
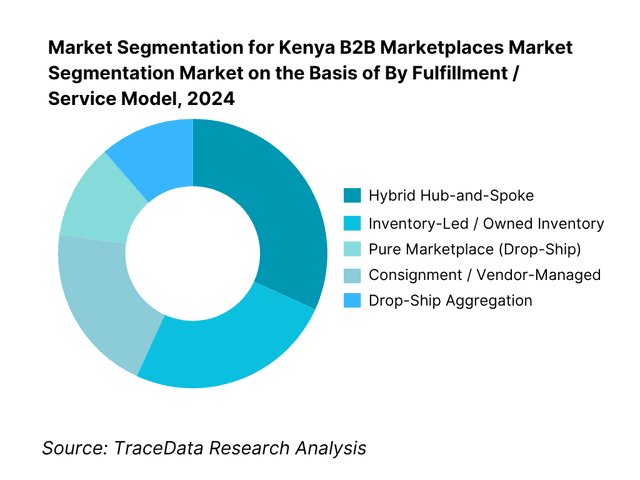
By Fulfillment / Service Model: The hybrid hub-and-spoke fulfillment model captures ~40 % share in 2024, making it the most used model among B2B platforms. This dominance is due to its balanced strength: combining control over inventory in regional hubs with agile last-mile delivery via partner networks (3PLs or gig riders). Pure inventory-led models are costly in working capital and wasteful in stock risks; drop-ship (pure marketplace) models suffer unpredictability and poor SLA reliability in Kenya’s fragmented logistics landscape. The hybrid model allows platforms to optimize inventory stocking at regional distribution hubs, maintain shared risk, and dynamically route orders based on proximity. It gives platforms reasonable margin capture on inventory while offloading full asset burdens for final delivery. The approach helps ensure better OTIF (On-Time In-Full) and fill rates, crucial in an environment with unreliable road networks and delivery unpredictability.
Competitive Landscape in Kenya B2B Marketplaces Market
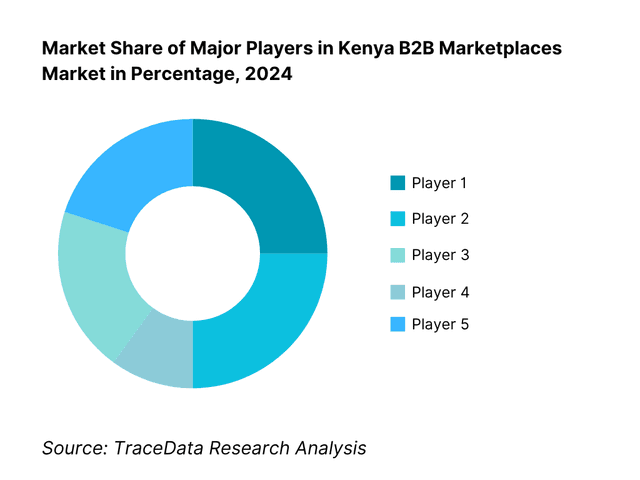
The Kenya B2B marketplace space is moderately consolidated, with a few major platforms and logistics / fintech challengers driving scale and integration. Many players compete on vertical specialization, credit rails, logistics reach, and merchant acquisition. Among them, Wasoko (formerly Sokowatch), Twiga Foods, Kyosk Digital, Jumba, and iProcure stand out as leaders. Their integration of supply chain, financing, and data analytics gives them structural advantages over smaller platforms.
Name | Founding Year | Original Headquarters |
Wasoko (formerly Sokowatch) | 2013 | Nairobi, Kenya |
Twiga Foods | 2013 | Nairobi, Kenya |
Kyosk Digital Services | 2018 | Nairobi, Kenya |
Jumba | 2017 | Nairobi, Kenya |
iProcure | 2015 | Nairobi, Kenya |
Caantin (formerly TopUp Mama) | 2021 | Nairobi, Kenya |
Lori Systems | 2016 | Nairobi, Kenya |
Kobo360 (Kenya operations) | 2018 | Lagos, Nigeria |
Ilara Health | 2019 | Nairobi, Kenya |
Maisha Meds | 2018 | Kisumu, Kenya |
Shara | 2022 | Nairobi, Kenya |
Jiji (Kenya operations) | 2014 | Lagos, Nigeria |
Alibaba.com (Kenya operations) | 1999 | Hangzhou, China |
Sote | 2018 | Nairobi, Kenya |
Kasha Global | 2016 | Kigali, Rwanda |
Some of the Recent Competitor Trends and Key Information About Competitors Include:
Wasoko (formerly Sokowatch): As one of Kenya’s largest B2B marketplace players, Wasoko has expanded its digital distribution network across over 25 counties and launched a financial services arm providing BNPL credit to informal retailers. In 2024, the company merged with Egypt’s MaxAB to create one of Africa’s largest unified B2B commerce platforms, enabling deeper cross-border supply chains and localized procurement hubs in East Africa. Wasoko’s data-driven replenishment and credit scoring capabilities remain key differentiators in the Kenyan market.
Twiga Foods: Twiga Foods continues to strengthen its hybrid supply model that integrates farm-level sourcing with retailer distribution. In 2024, Twiga expanded its agro-input and FMCG portfolio, targeting over 140,000 informal retailers and introducing lower-priced essential items through local manufacturing partnerships. The company has also invested in building food processing and warehousing infrastructure, positioning itself as a vertically integrated B2B platform connecting farmers directly to urban retail demand.
Kyosk Digital Services: Kyosk has rapidly scaled its micro-distribution ecosystem, servicing thousands of dukas through a mobile-based ordering platform. In 2024, it enhanced its last-mile logistics network using data analytics to improve route efficiency and delivery reliability. Kyosk also introduced embedded credit services and dynamic pricing algorithms, leveraging transaction histories to tailor financing options for repeat merchants. Its localized distribution nodes in peri-urban regions have improved fulfillment consistency across hard-to-reach markets.
Jumba: Jumba, a construction-focused B2B marketplace, has gained significant traction among hardware stores, contractors, and developers. In 2024, it raised new capital to expand its materials aggregation and logistics capabilities. The platform digitizes procurement for cement, steel, tiles, and plumbing products, allowing SMEs to access better pricing and delivery timelines. Its supplier integration tools and project-based credit offerings have positioned Jumba as a key player in Kenya’s construction supply digitalization wave.
iProcure: As Kenya’s leading agri-inputs marketplace, iProcure has expanded its digital network of agro-dealers and warehouse hubs across East Africa. In 2024, it completed a USD 10 million funding round to strengthen its technology platform and build predictive inventory tools for suppliers. iProcure’s transparent pricing engine and integrated last-mile delivery network help minimize stockouts for agro-input retailers. The firm’s emphasis on supply chain visibility and farmer-level demand forecasting distinguishes it from traditional distributors.
What Lies Ahead for Kenya B2B Marketplaces Market?
The Kenya B2B Marketplaces Market is expected to expand steadily through the medium term, supported by a digitally active SME base, robust payment infrastructure, and sustained logistics modernization. Kenya’s GDP of USD 124.5 billion and 55.3 million residents form a strong demand base for digital procurement, while nationwide internet penetration (with 68.9 million mobile connections) ensures that marketplace adoption continues to deepen. The government’s focus on e-invoicing (KRA eTIMS) and digital trade facilitation will further institutionalize the market, creating a more transparent and scalable environment for both domestic and cross-border B2B commerce.
Rise of Integrated Logistics and Fulfillment Networks: Kenya’s road network—spanning 161,451 km, including 63,000 km classified and 98,000 km unclassified (Kenya Roads Board)—is being upgraded under the government’s Roads 2000 Program to connect trade corridors from Mombasa Port to inland counties. The Port of Mombasa handled 29.9 million tonnes of cargo in the latest nine-month window, evidencing growing throughput into domestic distribution. This expanding logistics backbone underpins the rise of multi-hub fulfillment models used by marketplaces like Wasoko and Twiga Foods to improve last-mile reliability and reduce average delivery windows to 24–48 hours.
Shift Toward Credit-Enabled Digital Trade: The Central Bank of Kenya reported 39.8 million active mobile-money accounts and transaction volumes exceeding KES 7.2 trillion across channels, creating fertile ground for embedded credit models within B2B marketplaces. Platforms now leverage this transactional data to extend buy-now-pay-later and invoice-financing services to MSMEs. With the SME segment contributing roughly 33 % of national GDP (Kenya National Treasury), digitized trade credit is becoming a key catalyst for supply-chain liquidity. This structural shift will allow digital distributors to capture higher merchant stickiness and expand order frequency in 2025 and beyond.
Sector-Specific Marketplace Expansion: Beyond FMCG aggregation, vertical-specific marketplaces are rising in construction, agriculture, and healthcare. Kenya’s construction sector output reached KES 739.9 billion (Kenya National Bureau of Statistics), while agriculture accounted for 21 % of GDP, feeding procurement flows for agro-inputs and building materials. These deep verticals foster specialized B2B ecosystems such as Jumba (construction) and iProcure (agri-inputs), each offering category-specific logistics and supplier networks. This sectoral diversification ensures that the marketplace model becomes entrenched across Kenya’s wider productive economy rather than being confined to FMCG trade.
Leveraging AI, Data, and Compliance Analytics: As the Office of the Data Protection Commissioner tightens enforcement—with penalties totaling KES 9.4 million issued in 2024—the push for data governance is compelling platforms to formalize data collection and analytics. This compliance-driven digitization, combined with machine-learning-based inventory prediction and credit scoring, will help optimize delivery routes and risk assessment for informal merchants. With Kenya’s mobile-internet bandwidth rising to 13,720 Gbps total capacity (CAK Q4 2023/24 Report), marketplaces can now harness real-time analytics to enhance performance and regulatory adherence simultaneously.
Kenya B2B Marketplaces Market Segmentation
By Vertical / Industry
FMCG & Consumer Staple
Agro-inputs & Produce
Construction & Building Materials
Healthcare / Pharma
HORECA / Foodservice
General Trade & Non-Food
By Procurement / Commercial Model
Inventory-led (owned stock)
Pure Marketplace (drop-ship)
Hybrid hub-and-spoke (select stocking + marketplace sellers)
Consignment / Vendor-managed inventory
Contracted sourcing / framework agreements
By Fulfillment Modality
Own fleet line-haul & last-mile
3PL contract transport (line-haul, regional)
Gig last-mile (boda-boda, vans)
Cold-chain (chilled, frozen)
Pickup points / agent depots / dark stores
Cross-border forwarding & customs-cleared delivery
By Buyer Profile
Micro-retail (dukas, kiosks, minimarts)
Agro-dealers & co-ops
Clinics, pharmacies & diagnostic centers
Restaurants, cafes, hotels & caterers
Hardware stores, contractors & developers
Institutional / corporate buyers (schools, NGOs, enterprises)
By Payments & Credit
Prepaid mobile money (M-Pesa till / paybill)
Pay-on-delivery (COD with digital confirmation)
BNPL / trade credit (invoice terms)
Invoice financing / factoring (through fintech/bank partners)
Card / bank transfer (PesaLink/RTGS)
Players Mentioned in the Report:
Wasoko
Twiga Foods
Kyosk Digital
Jumba
iProcure
Caantin (TopUp Mama)
Lori Systems
Kobo360
Ilara Health
Maisha Meds
Shara
Jiji (Kenya)
Alibaba.com (serving Kenyan traders)
Sote
Kasha (if operating B2B in health)
Key Target Audience
Institutional Investors & Venture Capital Firms (investing in African tech, e-commerce, logistics)
Private Equity Houses evaluating exits or growth capital in B2B commerce
Strategic Corporates / FMCG & Manufacturing Companies seeking digital wholesale route partnerships
Telecom Operators with interest in value-added services to merchant base
Banks and Digital Credit Providers looking to extend credit to SMEs via platforms
National Government Agencies (e.g. Kenya Ministry of ICT, Kenya KRA, National Treasury)
County Governments and Trade Licensing Bodies
Multilateral / Development Agencies focused on SME digital inclusion (e.g. IFC, UNDP, AfDB)
Time Period:
Historical Period: 2019-2024
Base Year: 2025
Forecast Period: 2025-2030
Explore Flexible Purchase Options or Have Limited Budget?
Pay only for relevant chapters • Customizable report sections
Table of Contents
Choose individual sections to purchase. Mix and match as you like.
4.1. Delivery Model Analysis for Kenya B2B Marketplaces-Inventory-Led, Marketplace, Hybrid, and Drop-Ship Models
4.2. Revenue Streams for Kenya B2B Marketplaces Market
4.3. Business Model Canvas for Kenya B2B Marketplaces Market
5.1. Freelance Agents vs. Full-Time Platform Representatives (Sales and Fulfillment Workforce)
5.2. Investment Model in Kenya B2B Marketplaces Market
5.3. Comparative Analysis of Onboarding & Vendor Funneling Processes by Private vs. Public Procurement Portals
5.4. Merchant & Supplier Budget Allocation for B2B Digital Channels by Business Size (Micro, SME, Large Distributor)
8.1. Gross Merchandise Value (GMV) and Platform Revenues
9.1. By Market Structure (Inventory-Led, Marketplace, Hybrid, Drop-Ship)
9.2. By Vertical (FMCG, Agri-Inputs, Construction Materials, Healthcare/Pharma, HORECA)
9.3. By Buyer Profile (Dukas, Agro-Dealers, Clinics & Pharmacies, Restaurants, Contractors/Hardware Stores)
9.4. By Payment & Credit Type (Prepaid Mobile Money, Pay-on-Delivery, BNPL, Invoice Financing, Bank Transfer)
9.5. By Fulfillment Modality (Own Fleet, 3PL, Gig Boda Network, Cold-Chain, Pickup Points)
9.6. By Platform Interface (Android App, USSD/SMS, WhatsApp Chat, Web Portal, API Ordering)
9.7. By Region (Nairobi Metro, Central/Mt. Kenya, Rift Valley, Western/Nyanza, Coast, Eastern/Northern)
10.1. Merchant & Buyer Cohort Analysis
10.2. Procurement Decision-Making Process (Vendor Trust, SLA, Credit Terms)
10.3. ROI Analysis for Merchants (Cost Savings, Time Savings, Stock Turnover)
10.4. Demand Gap & White Space Framework (Underserved Regions and Verticals)
11.1. Trends and Developments
11.2. Growth Drivers
11.3. SWOT Analysis
11.4. Issues and Challenges
11.5. Government Regulations
12.1. Market Size and Future Potential for Online-Only B2B Platforms in Kenya
12.2. Business Model and Revenue Streams
12.3. Delivery Models and Fulfillment Architecture
15.1. Market Share of Key Players (Basis GMV and Active Merchants)
15.2. Benchmark of Key Competitors Including Variables such as: Company Overview, USP and Business Model, Revenue & GMV Estimates, Number of Active Merchants and Delivery Partners, Technology Stack and Credit Rail Integrations, Average Order Value and SKU Breadth, Major Clients and Partner Manufacturers, Strategic Tie-Ups (Fintech, Telco, Logistics)
15.3. Operating Model Analysis Framework
15.4. Gartner-Style Quadrant for Platform Leadership in Kenya B2B Ecosystem
15.5. Bowman’s Strategic Clock for Competitive Advantage (Pricing vs. Value Added Services)
16.1. Projected GMV and Platform Revenues (Forecast Period)
17.1. By Market Structure (Inventory-Led, Marketplace, Hybrid, Drop-Ship)
17.2. By Vertical (FMCG, Construction, Healthcare, Agri, HORECA)
17.3. By Buyer Profile (Dukas, Clinics, Contractors, Restaurants, Agro-Dealers)
17.4. By Payment Type (Prepaid, BNPL, Invoice Financing, POD)
17.5. By Fulfillment Modality (Own Fleet, 3PL, Gig Last-Mile, Cold-Chain)
17.6. By Channel Interface (App, WhatsApp, Web, USSD, API)
17.7. By Region (Nairobi Metro, Central, Rift Valley, Western/Nyanza, Coast, Eastern/Northern)
Discuss a Customized Research Scope
Custom research scope • Tailored insights • Industry expertise
Research Methodology
Step 1: Ecosystem Creation
Map the ecosystem and identify all the demand-side and supply-side entities for the Kenya B2B Marketplaces Market. On the demand side, this includes dukas and minimarts, agro-dealers and co-ops, clinics and pharmacies, restaurants and hotels, hardware stores and contractors, and institutional buyers. On the supply side, it comprises manufacturers and principals, importers and distributors, B2B platforms, 3PL/4PL logistics providers, fintech credit partners, mobile-money rails (M-Pesa, PesaLink, cards), customs brokers, and regulators (KRA, CAK, ODPC, KEBS). Based on this ecosystem, we will shortlist 5–6 leading platforms in the country—Wasoko, Twiga Foods, Kyosk Digital, Jumba, iProcure, and Caantin—using metrics such as operational footprint, financial disclosures, active merchants, and manufacturer partnerships. Sourcing is conducted through government portals (KRA, CAK, CBK, CAK), industry articles, and proprietary databases to collate reliable market-level information.
Step 2: Desk Research
An exhaustive desk-research process is performed using verified secondary and proprietary databases. This stage aggregates sector-wide indicators such as order density, supply-chain capacity, fulfillment SLA, digital payment volumes, and credit penetration. We examine firm-level filings, press releases, and funding announcements to extract data on GMV bands, order volumes, active merchants, warehouse hubs, fleet count, and county coverage. Financial records, logistics performance reports, and compliance audits (eTIMS onboarding, ODPC data licensing) are evaluated to construct a coherent picture of the operational economics of each marketplace. This process establishes a data-driven foundation for estimating the overall market composition and inter-firm relationships.
Step 3: Primary Research
We conduct structured interviews with C-level executives, operations heads, fintech partners, and merchants active in the Kenya B2B Marketplaces Market. These discussions validate hypotheses formed during the desk phase and clarify margins, logistics cost ratios, delivery windows, and credit roll-rates. A bottom-to-top approach is employed: merchant-level transaction data are aggregated to estimate regional volumes, while disguised interviews—in which analysts act as potential buyers—corroborate operational claims regarding pricing, inventory availability, order frequency, and invoice compliance. This combination of formal and disguised interactions ensures accurate mapping of revenue streams, unit economics, and fulfillment processes across major players and verticals.
Step 4: Sanity Check
A top-to-bottom and bottom-to-top reconciliation exercise is carried out to confirm the consistency of estimates derived from secondary and primary sources. Route-level throughput, merchant activation rates, logistics capacity, and transaction volumes are matched against macro benchmarks such as mobile-money activity (CBK), port cargo flows (KPA), and urban retail density (KNBS). Sensitivity tests are run to identify variances beyond permissible ranges. Where discrepancies arise, data are re-verified through secondary citations or follow-up interviews. This process ensures methodological integrity, delivering a robust, defensible, and triangulated view of Kenya’s B2B marketplaces ecosystem.
See What's Inside the Report
Get a preview of key findings, methodology and report coverage
Frequently Asked Questions
The Kenya B2B Marketplaces Market demonstrates immense potential, valued at approximately USD 1.2 billion in 2023, according to aggregated platform GMV and official e-commerce sector data. This potential is driven by the strong digital infrastructure in Kenya—featuring 68.9 million active SIM connections and 39.8 million mobile-money accounts—which facilitates high-frequency trade between suppliers and small retailers. The expanding MSME base, accounting for nearly 33 % of Kenya’s GDP, continues to accelerate marketplace adoption for inventory sourcing, logistics, and digital payments. With government-backed initiatives for e-invoicing and trade formalization, Kenya’s B2B digital commerce ecosystem is positioned for sustained expansion.
The Kenya B2B Marketplaces Market features leading players such as Wasoko (formerly Sokowatch), Twiga Foods, and Kyosk Digital Services, each commanding significant merchant networks and nationwide reach. These platforms dominate due to their vertically integrated supply chains, merchant credit programs, and data-driven distribution hubs. Other key participants include Jumba in construction materials, iProcure in agro-inputs, and Caantin (TopUp Mama) serving the HORECA segment. Supporting ecosystem enablers such as Lori Systems, Kobo360, Ilara Health, Maisha Meds, and Shara provide logistics, credit, and procurement infrastructure essential to sustaining marketplace operations.
Kenya’s B2B marketplace growth is propelled by several macro and structural drivers. First, the country’s GDP of USD 124.5 billion and population of 55.3 million provide a large consumption base supporting fast-moving trade. Second, logistics throughput—anchored by 29.9 million tonnes of cargo handled at the Port of Mombasa—ensures strong import pipelines for wholesale goods. Third, mobile-money transaction volumes exceeding KES 7.2 trillion facilitate instant settlements, making digital trade feasible for SMEs. Finally, urbanization (over 16.3 million urban residents) and growing smartphone penetration continue to expand the addressable base for marketplace platforms across regions.
The Kenya B2B Marketplaces Market faces multiple operational and regulatory challenges. Persistent logistics bottlenecks—arising from unpaved road segments covering nearly 9,600 km under the rural Class-C network—increase delivery costs and limit rural coverage. Tight credit conditions, with private-sector lending constrained amid high domestic borrowing, restrict merchant BNPL scaling. Compliance burdens from new policies, including KRA’s eTIMS invoicing rollout and ODPC data-protection penalties totaling KES 9.4 million in 2024, require platforms to strengthen digital governance and documentation. Collectively, these constraints increase operating friction and elevate the cost-to-serve for B2B platforms.
License Options
PDF + Excel
Complete report package
$4,000
Excel Only
Data and analytics
$2,500
Custom Sections
Starts from $100
$0