Kenya Logistics and Warehousing Market Outlook to 2029
By Market Structure, By Providers, By Types of Warehousing, By Transportation Mode, By Age of Consumers and By Region
Report Overview
Report Code
TDR0018
Coverage
Asia
Published
September 2024
Pages
80-100
Flexible Purchase Options
Select and purchase only the chapters you need for your strategic decisions
On This Page
Report Overview
The report titled “Kenya Logistics and Warehousing Market Outlook to 2029 - By Market Structure, By Providers, By Types of Warehousing, By Transportation Mode, By Age of Consumers and By Region” provides a comprehensive analysis of the logistics and warehousing market in Kenya. The report covers an overview and genesis of the industry, overall market size in terms of revenue, market segmentation; trends and developments, regulatory landscape, customer level profiling, issues and challenges, and comparative landscape including competition scenario, cross comparison, opportunities and bottlenecks, and company profiling of major players in the Logistics and Warehousing Market.
Report Coverage
Verified Market Sizing
Multi-layer forecasting with historical data and 5–10 year outlook
Deep-Dive Segmentation
Cross-sectional analysis by product type, end user, application and region
Competitive Benchmarking & Positioning
Market share, operating model, pricing and competition matrices
Actionable Insights & Risk Assessment
High-growth white spaces, underserved segments, technology disruptions and demand inflection points
Review Methodology & Data Structure
Preview report structure, data sources and research framework
Executive Summary
The report titled “Kenya Logistics and Warehousing Market Outlook to 2029 - By Market Structure, By Providers, By Types of Warehousing, By Transportation Mode, By Age of Consumers and By Region” provides a comprehensive analysis of the logistics and warehousing market in Kenya. The report covers an overview and genesis of the industry, overall market size in terms of revenue, market segmentation; trends and developments, regulatory landscape, customer level profiling, issues and challenges, and comparative landscape including competition scenario, cross comparison, opportunities and bottlenecks, and company profiling of major players in the Logistics and Warehousing Market. The report concludes with future market projections based on revenue, by market, service types, region, cause and effect relationship, and success case studies highlighting the major opportunities and cautions.
Kenya Logistics and Warehousing Market Overview and Size
The Kenya logistics and warehousing market reached a valuation of KES 180 Billion in 2023, driven by the increasing demand for efficient supply chain solutions, growing e-commerce activities, and the expansion of regional trade. The market is characterized by major players such as Bolloré Africa Logistics, DHL Kenya, Freight in Time, and Siginon Group. These companies are recognized for their extensive logistics networks, diverse service offerings, and customer-focused solutions.
In 2023, Bolloré Africa Logistics expanded its warehousing capacity in Nairobi, responding to the growing need for modern storage facilities in the region. Nairobi and Mombasa are key markets due to their strategic locations and robust infrastructure.
Market Size for Kenya Logistics and Warehousing Industry on the Basis of Revenue in USD Billion, 2018-2023

Source: TraceData Research Analysis
What Factors are Leading to the Growth of the Kenya Logistics and Warehousing Market:
Economic Growth and Infrastructure Development: The sustained economic growth in Kenya has led to significant investments in infrastructure, which has boosted the logistics and warehousing sector. In 2023, logistics services accounted for approximately 12% of Kenya's GDP, driven by enhanced transportation networks and modern warehousing facilities. This growth is particularly noticeable in urban and industrial areas where improved infrastructure has facilitated smoother logistics operations.
Expansion of E-commerce: The rapid growth of e-commerce in Kenya has been a major driver for the logistics and warehousing market. With the e-commerce sector growing by 20% in 2023, there has been an increased demand for efficient logistics solutions to handle the surge in online orders. Warehousing facilities have expanded to accommodate the storage and quick distribution of goods, particularly in major urban centers.
Strategic Regional Position: Kenya's strategic location as a gateway to East and Central Africa has solidified its role as a key logistics hub in the region. The increasing trade activities within the East African Community (EAC) and the expansion of regional trade agreements have driven the demand for sophisticated logistics and warehousing services. In 2023, regional trade accounted for nearly 30% of the logistics market in Kenya, highlighting the importance of Kenya's position in regional supply chains.
Which Industry Challenges Have Impacted the Growth of the Kenya Logistics and Warehousing Market:
Infrastructure Deficiencies: Despite ongoing improvements, infrastructure gaps, particularly in rural areas, remain a significant challenge for the logistics and warehousing sector. According to a recent industry survey, approximately 35% of logistics providers report difficulties due to poor road conditions and limited rail connectivity. These deficiencies can lead to higher transportation costs and delays, which negatively impact the efficiency of logistics operations and hinder market growth.
Regulatory Complexities: Stringent regulations concerning customs clearance and import/export procedures create bottlenecks in the logistics chain. In 2023, it was reported that around 20% of shipments experienced delays due to compliance issues with regulatory requirements. These regulations, while necessary for maintaining standards, can impose significant operational burdens, particularly on smaller logistics companies, increasing their costs and complicating their ability to compete.
Security and Safety Concerns: Security challenges, including cargo theft, hijacking, and vandalism, pose risks to logistics operations. Data indicates that approximately 25% of logistics providers have faced security-related incidents in the past year, leading to substantial financial losses. These safety concerns not only increase operational costs due to the need for enhanced security measures but also deter potential investments in the sector.
What are the Regulations and Initiatives which have Governed the Market:
Trade Facilitation Regulations: The Kenyan government has implemented various trade facilitation measures to streamline logistics operations and reduce delays in customs clearance. These regulations include the Kenya TradeNet System, which integrates various government agencies involved in trade, providing a single window for processing import and export documentation. In 2023, approximately 85% of shipments processed through this system experienced reduced clearance times, indicating improved efficiency in logistics operations.
Infrastructure Development Initiatives: To enhance the logistics and warehousing sector, the Kenyan government has prioritized infrastructure development, including the expansion of the Standard Gauge Railway (SGR) and the modernization of the Port of Mombasa. These initiatives aim to improve the transportation network and reduce logistical bottlenecks. In 2023, the completion of key infrastructure projects contributed to a 15% increase in the efficiency of goods movement across the country.
Environmental Regulations: The government enforces environmental regulations to promote sustainable practices within the logistics and warehousing sector. These regulations include requirements for energy-efficient warehousing and the adoption of eco-friendly transportation methods. In 2023, about 20% of logistics companies adopted green logistics practices in compliance with these regulations, contributing to a reduction in the sector's carbon footprint.
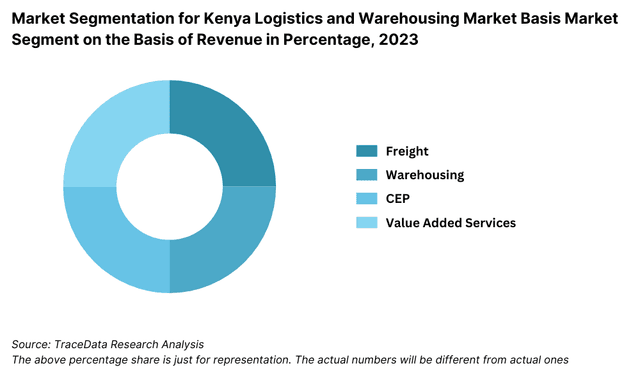
Kenya Logistics and Warehousing Market Segmentation
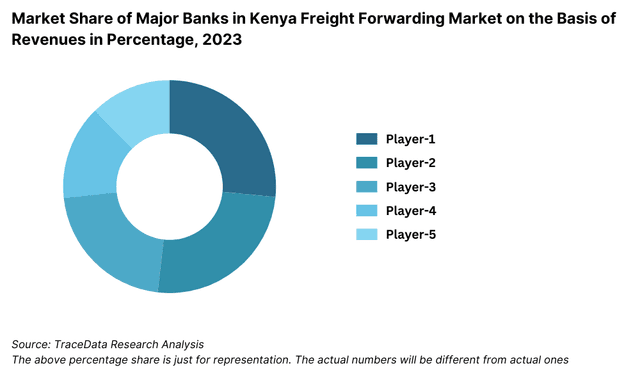
Freight Forwarding: The country's F&B, FMCG, and industrial sectors contributed significantly to the expansion of Kenya's freight forwarding market, particularly for the foreign market. Due to the expansion of the road infrastructure, it was found that freight by road was the most desired mode of transportation, followed by freight by air and sea. There are numerous tough places and isolated areas in Kenya that are inaccessible by any other kind of transportation. In terms of revenue, the Asia flow corridor was shown to be the biggest source in the Kenyan freight forwarding industry.
Warehousing: Kenya's warehousing business has expanded slowly since there is an extreme shortage of high-caliber, contemporary warehouse space. One of the major areas of logistics development that needs more funding and technological innovation is warehousing. The development of automation technology and increasingly sophisticated inventory management systems is anticipated to contribute to the expansion of the warehousing market.
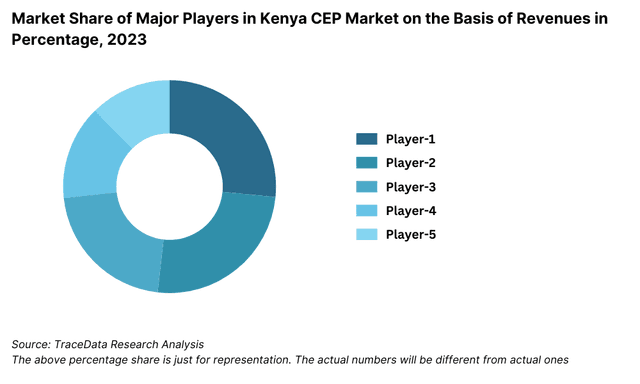
CEP Market: The market for CEP logistics expanded at a positive CAGR from 2018 to 2023. Online shoppers are increasingly expecting faster ways to receive their packages and easier ways to return items. Since most customers consider express delivery to be a premium service, they generally prefer conventional delivery. Despite the difficulties, several foreign companies, including DHL, Aramex, and FedEx-TNT, have entered the sector. Future growth in the express delivery market will be driven by the rise of e-commerce and the need for speedier delivery options.
Competitive Landscape in Kenya Logistics and Warehousing Market
The Kenya logistics and warehousing market is moderately concentrated, with several key players dominating the space. However, the entrance of new firms and the expansion of regional and global logistics providers have diversified the market, offering consumers more choices and services.
| Name | Founding Year | Headquarters |
| DHL Kenya | 1969 | Nairobi, Kenya |
| Siginon Group | 1985 | Nairobi, Kenya |
| Kenya Airways Cargo | 1977 | Nairobi, Kenya |
| Bolloré Logistics | 1822 | Nairobi, Kenya |
| Freight Forwarders Kenya | 1932 | Mombasa, Kenya |
| G4S Kenya | 1960 | Nairobi, Kenya |
| Maersk Kenya | 1904 | Nairobi, Kenya |
| Kuehne + Nagel Kenya | 1890 | Nairobi, Kenya |
| UPS Kenya | 1907 | Nairobi, Kenya |
| Roy Transmotors Ltd. | 1969 | Mombasa, Kenya |
Some of the recent competitor trends and key information about competitors include:
Bolloré Africa Logistics: As one of the leading logistics providers in Kenya, Bolloré recorded a 20% increase in warehouse utilization in 2023, driven by the expansion of e-commerce and the growth of regional trade. The company’s extensive network and investment in technology have made it a preferred choice for many businesses.
DHL Kenya: DHL Kenya continues to be a market leader, particularly in express logistics services. In 2023, DHL expanded its cold chain logistics services to cater to the growing demand from the pharmaceutical and food sectors.
Freight in Time: Known for its strong presence in East Africa, Freight in Time reported a 15% growth in revenue in 2023. The company has focused on expanding its warehousing capacity and enhancing its last-mile delivery services.
Siginon Group: Siginon Group, with its strong presence in Mombasa, saw a 12% increase in its logistics operations in 2023. The company’s strategic location near the Port of Mombasa and its investment in modern warehousing facilities have contributed to its growth.

What Lies Ahead for Kenya Logistics and Warehousing Market?
The Kenya logistics and warehousing market is projected to grow steadily by 2029, exhibiting a respectable CAGR during the forecast period. This growth is expected to be fueled by economic factors, the expansion of e-commerce, and increasing regional trade.
Shift Towards Green Logistics: As environmental sustainability becomes a priority, there is an anticipated shift towards green logistics practices. Companies are expected to invest in energy-efficient warehousing, electric vehicles, and other eco-friendly solutions.
Integration of Technology: The integration of advanced technologies such as AI, IoT, and big data analytics in logistics operations is expected to provide companies with more accurate and real-time data, improving efficiency and reducing costs.
Growth of Cold Chain Logistics: The market is seeing a growing demand for cold chain logistics, driven by the expanding food and pharmaceutical sectors. Companies that can offer reliable and efficient cold storage solutions are expected to capture significant market share.
Focus on Infrastructure Development: Continued investment in infrastructure, particularly in road and rail networks, is expected to improve logistics efficiency and reduce transportation costs, benefiting the overall market.
Future Outlook and Projections for Kenya Logistics and Warehousing Market on the Basis of Revenues in USD Billion, 2024-2029

Source: TraceData Research Analysis

Kenya Logistics and Warehousing Market Segmentation
Freight Forwarding Market
By Mode of Transportation
- Road Freight (Fleets, Volume, FTK, Price/ton/km and Revenue)
- Sea Freight (Fleets, Volume, Average Distance, Price/ton/km and Revenue)
- Air Freight (Volume, Average Distance, Price/ton/km and Revenue)
- By Road transportation
- Less than Truck load (Revenue and Volume)
- Full truck load (Revenue and Volume)
- By End Users (Revenues)
- Food & Beverages
- Textiles and Footwear
- Chemicals
- Pharmaceuticals and Medical consumables
- Electronics
- Others include agricultural products, frozen meat and more
Warehousing Market
By Business Model (Revenue, Price/sqm, warehousing space, Occupancy rate)
Industrial/Retail
CFS/ICD
Cold Storage
Agriculture
By Industrial warehouses (Revenues)
Grade A
Grade B
Grade C and others
By End Users (Revenues)
Food & Beverages
Textiles and Footwear
Chemicals
Pharmaceuticals and Medical consumables
Electronics
Others include agricultural products, frozen meat and more
CEP Market
By Channel
3PL Players
E-Commerce Merchants
By Type of Shipments
Domestic Shipments
International Shipments
By Area of Delivery
Intercity
Intracity
By Mode
Air Shipments
Ground Shipments
By Delivery Period
Same Day Delivery
1-2 Day Delivery
3-4 Day Delivery
More than 4 Day Delivery
By Type of Products
Consumer Electronics & Media
Fashion & Accessories
Foods & Personal Care
Home Care & Furniture
Toys & Baby Products
Others (Video Games, Digital Music, Pet Care, Home Gardening, etc.)
Players Mentioned in the Report:
DHL Kenya
Siginon Group
Kenya Airways Cargo
Bolloré Logistics
Freight Forwarders Kenya
G4S Kenya
Maersk Kenya
Kuehne + Nagel Kenya
UPS Kenya
Roy Transmotors Ltd.
Key Target Audience:
Logistics Providers
Warehousing Companies
E-commerce Companies
Regulatory Bodies (e.g., Kenya Revenue Authority)
Research and Development Institutions
Time Period:
Historical Period: 2018-2023
Base Year: 2024
Forecast Period: 2024-2029
Explore Flexible Purchase Options or Have Limited Budget?
Pay only for relevant chapters • Customizable report sections
Table of Contents
Choose individual sections to purchase. Mix and match as you like.
4.1. Macroeconomic framework for Kenya including GDP (2018-2024), GDP Growth (2018-2024), GDP Contribution by Sector
4.2. Logistics Sector Contribution to GDP and how the contribution has been changing in the historical assessment
4.3. Ease of Doing Business in Kenya
4.4. LPI Index of Kenya and Improvements in the last 10-15 Years
4.5. Custom Procedure and Custom Charges in Kenya Logistics market
5.1. Landscape of Investment Parks and Free Trade Zones / SEZs in Kenya
5.2. Current Scenario for Logistics Infrastructure in Kenya
5.3. Road Infrastructure in Kenya including Road Network, Toll Charges and Toll Network, Major Goods Traded through Road, Major Flow Corridors for Road (Inbound and Outbound)
5.4. Air Infrastructure in Kenya including Total Volume Handled, FTK for Air Freight, Major Inbound and Outbound Flow Corridors, Major Goods traded through Air, Number of Commercial and Passenger Airports, Air Freight Volume by Airports and other Parameters
5.5. Sea Infrastructure in Kenya including Total Volume Handled, FTK for Sea Freight, Major Inbound and Outbound Flow Corridors, Major Goods Traded through Sea, Number of Ports for Coastal and Ocean Freight, Number of Vessels, Sea Freight Volume by Ports and other Parameters
5.6. Rail Infrastructure in Kenya including Total Volume Handled, FTK for Rail Freight, Major Inbound and Outbound Flow Corridors, Major Goods Traded through Rail and others
6.1. Basis Revenues, 2018-2024P
7.1. By Segment (Freight Forwarding, Warehousing, CEP and Value-Added Services), 2018-2024P
7.2. By End User Industries, 2018-2024P
8.1. Market Overview and Genesis
8.2. Kenya Freight Forwarding Market Size by Revenues, 2018-2024P
8.3. Kenya 3PL Freight Forwarding Market Segmentation, 2018-2024P
8.3.1. By Mode of Freight Transport (Road, Sea, Air and Rail), 2018-2024P
8.3.1.1. Price per FTK for Road/Air/Sea and Rail in Kenya
8.3.1.2. Road Freight (Domestic and International Volume, FTK and Revenue; Number of Registered Vehicles)
8.3.1.3. Road Freight Domestic and International Corridors
8.3.1.4. Ocean Freight (Domestic and International Volume, FTK and Revenue; Volume by Commodity; Sea Ports Key Statistics)
8.3.1.5. Air Freight (Domestic and International Volume, FTK and Revenue)
8.3.1.6. Rail Freight (Domestic and International Volume, FTK and Revenue; Volume by Commodity and Region)
8.3.1.7. Export-Import Scenario (Value by Mode of Transport, Commodity and Country; Volume by Principal Commodities)
8.3.2. By Intercity Road Freight Corridors, 2018-2024P
8.3.3. By International Road Freight Corridors (Uganda, Tanzania, Rwanda, South Sudan and Ethiopia), 2018-2024P
8.3.4. By End User (Industrial, FMCG, F&B, Retail and Others), 2018-2024P
8.4. Snapshot of Freight Truck Aggregators in Kenya Including Company Overview, USP, Business Strategies, Future Plans, Business Model, Number of Fleets, Margins/Commission, Number of Booking, Major Clients, Average Booking Amount, Major Routes and others
8.5. Competitive Landscape in Kenya Freight Forwarding Market, 2024
8.5.1. Heat Map of Major Players in Kenya Freight Forwarding on the Basis of Service offering
8.5.2. Market Share of Major Players in Kenya Freight Forwarding Market, 2024
8.5.3. Cross Comparison of Major Players in Freight Forwarding Companies on the Basis of Parameters including Volume of Road Freight, Inception Year, Number of Fleets (Owned and Subcontracted), Fleets by Type, Occupancy Rate, Number of Employees, Major Route Network, Major Clients, Revenues, Volume of Sea Freight, Volume of Air Freight, USP, Business Strategy, Technology, (2024)
8.6. Kenya Freight Forwarding Future Market Size by Revenues, 2025-2029
8.7. Kenya Freight Forwarding Market Segmentation, 2025-2029
8.7.1. Future Market Segmentation by Mode of Freight Transport (Road, Sea, Air and Rail), 2025-2029
8.7.2. Future Market Segmentation by International Road Freight Corridors (Uganda, Tanzania, Rwanda, South Sudan and Ethiopia), 2025-2029
8.7.3. Future Market Segmentation by End User (Industrial, FMCG, F&B, Retail and Others), 2025-2029
9.1. Market Overview and Genesis
9.2. Value Chain Analysis in Kenya Warehousing Market including entities, margins, role of each entity, process flow, challenges and other aspects
9.3. Kenya Warehousing Market Size on the Basis of Revenues and Warehousing Space, 2018-2024P
9.4. Kenya Warehousing Market Segmentation
9.4.1. Kenya Warehousing Revenue by Business Model (Industrial/Retail, ICD/CFS and Cold Storage), 2018-2024P
9.4.2. Kenya Warehousing By Type of Warehouse (General, Open Yard, Freezer/Chiller, Ambient and Bonded Warehouses), 2018-2024P
9.4.3. Kenya Warehousing Revenue by End User (Industrial & Construction, FMCG, Retail, Food & Beverage and Others), 2018-2024P
9.4.4. 3PL Warehousing Space by Region, 2024P
9.5. Competitive Landscape in Kenya Warehousing Market
9.5.1. Market share of Top 10 Companies in Kenya Warehousing Market, 2024
9.5.2. Cross Comparison of Top 10 Warehousing Companies on the Basis of Parameters including Company Overview, USP, Business Strategy, Future Plans, Technology, Revenues from Warehousing, Number of Warehouses, Warehousing Space, Location of Warehouses, Type of Warehouses, Occupancy Rate, Rental Rates, Clients and others, (2024)
9.6. Kenya Warehousing Future Market Size on the Basis of Revenues, 2025-2029
9.7. Kenya Warehousing Market Future Segmentation
9.7.1. Kenya Warehousing Revenue by Business Model (Industrial/Retail, ICD/CFS and Cold Storage), 2025-2029
9.7.2. Kenya Warehousing Revenue By Type of Warehouse (General, Open Yard, Freezer/Chiller, Ambient and Bonded Warehouses), 2025-2029
9.7.3. Kenya Warehousing Revenue by End User (Industrial & Construction, FMCG, Retail, Food & Beverage and Others), 2025-2029
10.1. Market Overview and Genesis
10.2. Value Chain Analysis in Kenya CEP Market including entities, margins, role of each entity, process flow, challenges and other aspects
10.3. Revenue Composition and Contribution Between First Mile/Mid Mile and Last Mile Delivery-Analysis for Domestic and International Shipments
10.4. Kenya CEP Market Size on the Basis of Revenues and Shipments, 2018-2024P
10.5. Kenya CEP Market Segmentation, 2024
10.5.1. Segmentation by Mails and Documents, E-Commerce Shipments and Express Cargo, 2023-2024P
10.5.2. Segmentation by International and Domestic Express, 2023-2024P
10.5.3. Segmentation by B2B, B2C and C2C, 2023-2024P
10.5.4. Segmentation by Period of Delivery, 2023-2024P
10.6. Competitive Landscape in Kenya CEP Market, 2024
10.6.1. Overview and Genesis, Market Nature, Market Stage and Major Competing Parameters
10.6.2. Market Share of Companies in Kenya CEP Market on the Basis of Revenues/Number of Shipments, 2024
10.6.3. Market Share of Top 5 Companies in Kenya E-Commerce Shipment Market on the Basis of Revenues/Number of Shipments, 2024
10.6.4. Cross Comparison of Top 10 Kenya CEP Companies on the Basis of Parameters including Company Overview, USP, Business Strategy, Future Plans, Technology, Number of last Mile Delivery Shipments, Revenues, Major Clients, Number of Fleets, Number of Employees, Number of Riders, Number of Pin Code / Delivery Areas Served, Major Service Offering and others
10.7. Kenya CEP Market Size on the Basis of Revenues and Shipments, 2025-2029
10.8. Kenya CEP Market Segmentation
10.8.1. Segmentation by Mails and Documents, E-Commerce Shipments and Express Cargo, 2025-2029
10.8.2. Segmentation by International and Domestic Express, 2025-2029
10.8.3. Segmentation by B2B, B2C and C2C, 2025-2029
10.8.4. Segmentation by Period of Delivery, 2025-2029
11.1. Customer Cohort Analysis and End User Paradigm for Different Industry Verticals under Logistics Sector
11.2. Understanding on Logistics Spend by End User, 2023-2024P
11.3. End User Preferences in terms of In-House or Outsourcing Logistics Services and Reason for Selection; Segregate this by Size of Company on the Basis of Revenues
11.4. Major Logistics Company who are Specialized in Serving Each Type of End User
11.5. Detailed Landscape of Each End Users across Parameters including Major Products Manufactured and Traded, Emerging Products, Type of Services Required, and Type of Services Outsourced, Major Companies, Contract Duration, Likelihood to Recommend, Market Orientation, Major Clusters, Type of Sourcing Preference, Pain Points, Facilities/Services Required, Future Outlook. Market Size for End User Industry Vertical with Growth Rate, 2018-2024P
12.1. Basis Revenues, 2025-2029
13.1. By Segment (Freight Forwarding, Warehousing, CEP and Value-Added Services), 2025-2029
13.2. By End User Industries, 2025-2029
13.3. Recommendation
13.4. Opportunity Analysis
Discuss a Customized Research Scope
Custom research scope • Tailored insights • Industry expertise
Research Methodology
Step 1: Ecosystem Creation
Map the ecosystem and identify all the demand side and supply side entities for the Kenya Logistics and Warehousing Market. Based on this ecosystem, we will shortlist leading 5-6 service providers in the country based on their financial information, service capacity, and network coverage.
Sourcing is made through industry articles, multiple secondary, and proprietary databases to perform desk research around the market to collate industry-level information. This step is crucial for understanding the broader market landscape and identifying key players and trends.
Step 2: Desk Research
Subsequently, we engage in an exhaustive desk research process by referencing diverse secondary and proprietary databases. This approach enables us to conduct a thorough analysis of the market, aggregating industry-level insights. We delve into aspects like service revenues, the number of market players, pricing levels, demand, and other variables. We supplement this with detailed examinations of company-level data, relying on sources like press releases, annual reports, financial statements, and similar documents. This process aims to construct a foundational understanding of both the market and the entities operating within it.
Step 3: Primary Research
We initiate a series of in-depth interviews with C-level executives and other stakeholders representing various Kenya Logistics and Warehousing Market companies and end-users. This interview process serves a multi-faceted purpose: to validate market hypotheses, authenticate statistical data, and extract valuable operational and financial insights from these industry representatives. A bottom-to-top approach is undertaken to evaluate service revenue for each player, thereby aggregating it to the overall market.
As part of our validation strategy, our team executes disguised interviews wherein we approach each company under the guise of potential customers. This approach enables us to validate the operational and financial information shared by company executives, corroborating this data against what is available in secondary databases. These interactions also provide us with a comprehensive understanding of revenue streams, value chains, processes, pricing, and other factors.
Step 4: Sanity Check
- A bottom-to-top and top-to-bottom analysis, along with market size modeling exercises, is undertaken to assess sanity checks for the overall market size and segmentation accuracy. This ensures the reliability of the data and the consistency of the market projections.
See What's Inside the Report
Get a preview of key findings, methodology and report coverage
Frequently Asked Questions
The Kenya logistics and warehousing market is poised for substantial growth, reaching a valuation of KES 180 Billion in 2023. This growth is driven by factors such as the expansion of e-commerce, the strategic position of Kenya as a regional trade hub, and ongoing investments in infrastructure. The market's potential is further bolstered by the adoption of advanced logistics technologies, which are enhancing efficiency and service quality across the sector.
The Kenya Logistics and Warehousing Market features several key players, including Bolloré Africa Logistics, DHL Kenya, and Siginon Group. These companies dominate the market due to their extensive networks, advanced technological capabilities, and diverse service offerings. Other notable players include Freight in Time and Multiple Hauliers, who are recognized for their specialized services and strong regional presence.
The primary growth drivers include the rapid expansion of e-commerce, which has significantly increased demand for logistics and warehousing services, and Kenya’s strategic location as a gateway to East and Central Africa. Additionally, ongoing infrastructure development projects, such as the Standard Gauge Railway and the modernization of the Port of Mombasa, are further enhancing the efficiency and capacity of logistics operations in the country.
The Kenya Logistics and Warehousing Market faces several challenges, including infrastructure deficiencies, particularly in rural areas, and regulatory complexities related to customs clearance and trade compliance. Security concerns, such as cargo theft and hijacking, also pose significant risks to logistics operations, leading to increased operational costs for companies. Additionally, the rising costs associated with fuel, labor, and security measures create pricing pressures that can limit the ability of logistics providers to offer competitive rates, thereby constraining market growth.
License Options
PDF + Excel
Complete report package
$4,000
Excel Only
Data and analytics
$2,500
Custom Sections
Starts from $100
$0