KSA POS Lending Market Outlook to 2029
By Market Structure (Banks, BNPL and Private Finance Companies), By Retail Segments (Fashion, Electronics, Furniture and others), and By Region (Riyadh, Eastern Province, Makkah)
Report Overview
Report Code
TDR01
Coverage
Middle East
Published
September 2024
Pages
80-100
Flexible Purchase Options
Select and purchase only the chapters you need for your strategic decisions
On This Page
Report Overview
The report titled “KSA POS Lending Market Outlook to 2029 - By Market Structure (Banks, BNPL and Private Finance Companies), By Retail Segments (Fashion, Electronics, Furniture and others), and By Region (Riyadh, Eastern Province, Makkah)” provides a comprehensive analysis of the POS lending market in KSA. The report covers an overview and genesis of the industry, overall market size in terms of revenue, market segmentation; trends and developments, regulatory landscape, customer level profiling, issues and challenges, and comparative landscape including competition scenario, cross-comparison, opportunities and bottlenecks, and company profiling of major players in the KSA POS Lending Market.
Report Coverage
Verified Market Sizing
Multi-layer forecasting with historical data and 5–10 year outlook
Deep-Dive Segmentation
Cross-sectional analysis by product type, end user, application and region
Competitive Benchmarking & Positioning
Market share, operating model, pricing and competition matrices
Actionable Insights & Risk Assessment
High-growth white spaces, underserved segments, technology disruptions and demand inflection points
Review Methodology & Data Structure
Preview report structure, data sources and research framework
Executive Summary
The report titled “KSA POS Lending Market Outlook to 2029 - By Market Structure (Banks, BNPL and Private Finance Companies), By Retail Segments (Fashion, Electronics, Furniture and others), and By Region (Riyadh, Eastern Province, Makkah)” provides a comprehensive analysis of the POS lending market in KSA. The report covers an overview and genesis of the industry, overall market size in terms of revenue, market segmentation; trends and developments, regulatory landscape, customer level profiling, issues and challenges, and comparative landscape including competition scenario, cross-comparison, opportunities and bottlenecks, and company profiling of major players in the KSA POS Lending Market. The report concludes with future market projections based on revenue, market trends, consumer behaviour, and case studies highlighting major opportunities and cautions.
KSA POS Lending Market Overview and Size
The KSA POS lending market reached a valuation of SAR 5 Billion in 2023, driven by the growing demand for flexible financing solutions among consumers and retailers. The market is characterized by major players such as Tamara, Tabby, and Spotii, recognized for their robust technological platforms, partnerships with leading retailers, and customer-focused services. In 2023, Tamara expanded its partnership network with leading retail brands, facilitating more consumer financing options at checkout points across the country.
Market Size for KSA POS Lending Industry on the Basis of Transaction Value in USD Billion, 2018-2024
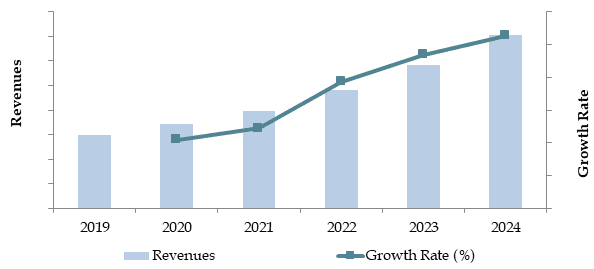
Source: TraceData Research Analysis
What Factors are Leading to the Growth of KSA POS Lending Market:
Increased Consumer Demand for Flexibility: The shift towards cashless transactions and the rising preference for installment-based payment methods among consumers have significantly boosted the POS lending market in KSA. As of 2023, nearly 40% of retail transactions in KSA were made through POS financing options, highlighting a growing trend towards alternative payment solutions.
Retailers' Shift to Omnichannel Models: Retailers are increasingly adopting omnichannel strategies to provide customers with seamless financing options, both online and in-store. This trend, coupled with the expansion of e-commerce in KSA, has driven demand for POS lending as a flexible and accessible financing solution.
Government Support for Financial Technology: The KSA government's Vision 2030 initiative supports the development of financial technology (FinTech) ecosystems, which has fueled the growth of POS lending platforms. In 2023, SAR 200 million was invested in FinTech companies, further strengthening the infrastructure for POS lending services.
Challenges Impacting the Growth of the KSA POS Lending Market:
Consumer Creditworthiness and Default Risks: A significant challenge in the POS lending market is assessing and managing creditworthiness. Data from 2023 suggests that around 25% of POS loan applicants face difficulties in obtaining approval due to low credit scores, increasing the risk of defaults and limiting market penetration.
Regulatory Compliance and Oversight: Regulatory challenges concerning consumer protection and data security remain critical issues. In 2023, approximately 15% of POS lenders faced regulatory scrutiny due to non-compliance with data protection laws, affecting their operations and market credibility.
Retailer Integration Costs: Many retailers face challenges integrating POS lending solutions into their existing payment systems, particularly small and medium-sized enterprises (SMEs). The cost and complexity of integration have slowed adoption rates among certain retail segments.
KSA POS Lending Market Segmentation
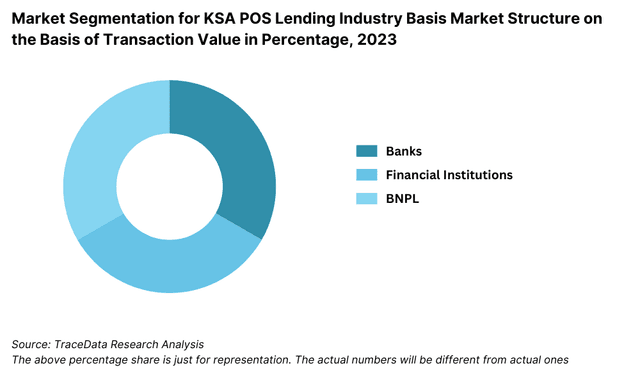
By Market Structure: FinTech companies dominate the market, holding a significant share due to their advanced technological platforms, easy-to-integrate solutions, and partnerships with major retailers. These companies offer seamless, user-friendly services that are attractive to both retailers and consumers. Traditional banks also participate in the market but with a smaller share, as they focus more on large-scale retailers and often provide more rigid financing structures compared to the flexibility of FinTech platforms.
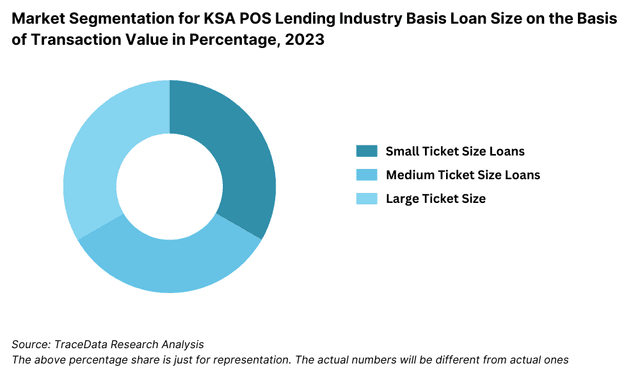
By Loan Size: Small-ticket loans, typically for purchases under SAR 5000, make up most of the POS lending transactions. These loans are preferred by consumers for everyday purchases such as electronics, apparel, and household items. Large-ticket loans (above SAR 10,000) are less common but growing, especially in sectors like furniture, home appliances, and healthcare, where consumers benefit from flexible financing options.
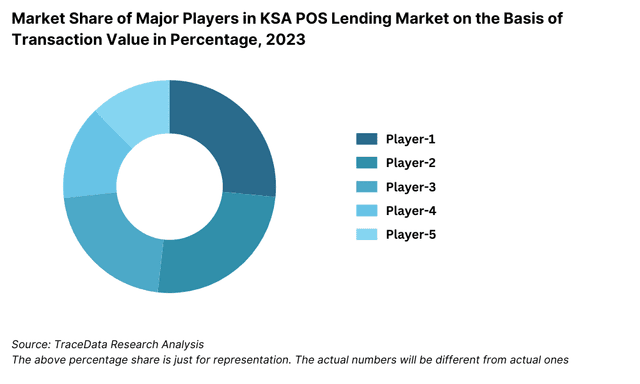
Competitive Landscape in KSA POS Lending Market
The KSA POS lending market is relatively concentrated, with a few major players leading the space. However, the emergence of new FinTech firms and the expansion of digital payment solutions, such as Tamara, Tabby, Spotii, and Cashew, have diversified the market, offering retailers and consumers more choices and services
| Name | Founding Year | Original Headquarters |
| Tamara | 2020 | Riyadh, Saudi Arabia |
| Tabby | 2019 | Dubai, UAE |
| Lendo | 2019 | Riyadh, Saudi Arabia |
| Mada Pay | 2018 | Riyadh, Saudi Arabia |
| STC Pay | 2018 | Riyadh, Saudi Arabia |
| ValU | 2017 | Cairo, Egypt |
| Cashew Payments | 2020 | Dubai, UAE |
| Postpay | 2019 | Dubai, UAE |
| Buy Now, Pay Later (BNPL) by Al Rajhi Bank | 1957 | Riyadh, Saudi Arabia |
| Saudi Digital Payments Company (STC Pay) | 2018 | Riyadh, Saudi Arabia |
Some of the recent competitor trends and key information about competitor include:
Tamara: As one of the leading FinTech platforms in KSA, Tamara recorded over 2 million active users in 2023, marking a 25% increase in user engagement compared to the previous year. The platform’s integration with top retail brands and its user-friendly installment payment plans have made it a dominant force in the KSA market.
Tabby: Known for its focus on transparency and customer-centric services, Tabby saw a 30% increase in its retail partnerships in 2023. The platform's ability to provide flexible payment solutions for online and in-store purchases has driven significant adoption across major retail segments.
Spotii: Specializing in installment-based payment solutions, Spotii reported a 20% growth in transactions in 2023. The company’s innovative approach to consumer financing, particularly in the fashion and lifestyle sectors, has contributed to its expanding market presence.
Cashew: As a fast-growing FinTech firm, Cashew saw a 15% increase in its customer base in 2023, driven by its focus on the education and healthcare sectors. The company’s flexible payment models and seamless integration with service providers have made it a preferred choice for larger-ticket financing.
What Lies Ahead for the KSA POS Lending Market?
The KSA POS lending market is projected to grow steadily by 2029, exhibiting a strong CAGR during the forecast period. This growth is expected to be fueled by consumer demand for flexible financing options, the rise of e-commerce, and the continuous expansion of FinTech solutions across the Kingdom.
Expansion into Diverse Retail Segments: As the POS lending market matures, there is an anticipated expansion into diverse retail segments such as healthcare, education, and travel. This diversification will allow consumers to access installment-based financing for larger, non-traditional purchases, further driving market growth.
Technological Advancements in FinTech Solutions: The integration of AI, machine learning, and big data analytics is expected to enhance credit assessment and risk management in the POS lending market. These technologies will enable faster, more accurate loan approvals, making POS lending more accessible to a broader consumer base.
Increased Adoption of BNPL (Buy Now Pay Later): The BNPL model is projected to witness increased adoption, particularly among younger, tech-savvy consumers who prefer interest-free installment options. This trend is supported by rising e-commerce penetration and growing consumer preference for flexible payment solutions.
Regulatory Reforms Supporting FinTech Growth: The KSA government is expected to introduce further regulatory reforms under the Vision 2030 initiative, aimed at fostering FinTech innovation. These reforms will likely include enhanced data protection measures and streamlined licensing processes, making it easier for new players to enter the market.
Partnerships Between Banks and FinTech Firms: The future of the KSA POS lending market will likely see more strategic partnerships between traditional banks and FinTech companies. These collaborations will leverage the strengths of both sectors, providing consumers with more diverse financing options and expanding the reach of POS lending services.
Future Outlook and Projections for KSA POS Lending Market on the Basis of Transaction Value in USD Billion, 2024-2029
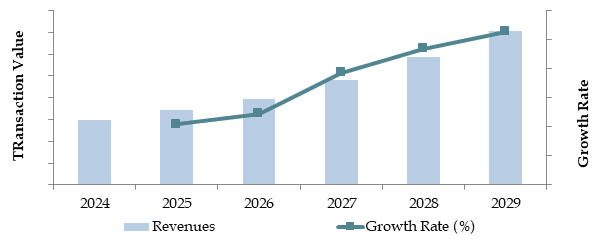
Source: TraceData Research Analysis
KSA POS Lending Market Segmentation
By Market Structure:
- Private Finance Companies
- Traditional Banks
- BNPL Companies
By Loan Size:
- < SAR 1,000
- SAR 1,000 - 5,000
- SAR 5,000 - 10,000
- SAR 10,000
- Online
- Offline
By Mode of Lending:
By Retail Segment:
- Fashion and Apparel
- Electronics and Appliances
- Furniture and Home Goods
- Healthcare Services
- Travel and Leisure
- Education
By Age of Consumer:
- 18-24
- 25-34
- 35-44
- 45-54
- 55+
By Region:
- Riyadh
- Eastern Province
- Makkah
- Central
- Western
Players Mentioned in the Report:
- Tamara
- Tabby
- Lendo
- Mada Pay
- STC Pay
- ValU
- Cashew Payments
- Postpay
- Buy Now, Pay Later (BNPL) by Al Rajhi Bank
- Saudi Digital Payments Company (STC Pay)
Key Target Audience:
- FinTech Companies
- Traditional Banks
- Retailers
- Regulatory Bodies (e.g., Saudi Central Bank - SAMA)
- Research and Development Institutions
Time Period:
- Historical Period: 2018-2023
- Base Year: 2024
- Forecast Period: 2024-2029
Explore Flexible Purchase Options or Have Limited Budget?
Pay only for relevant chapters • Customizable report sections
Table of Contents
Choose individual sections to purchase. Mix and match as you like.
4.1. Overview and Genesis for Retail Lending Industry
4.2. Total Retail Lending Industry Size, Historical and Current (Credit Card Lending and EMI lending through banks/FCs), 2018-2023
4.3. Facts and Stats-Number of Credit Card Holders, Number of Retail Purchase Converted on EMI, regional requirement, 2018-2023
4.4. Consumer Landscape to understand type of solution which different customer wants basis age, income, location and other aspects
5.1. Offline Retail Industry Size Landscape-Growth and Opportunities
5.2. Number of Retail Stores in KSA by category of stores/type of stores, 2024
5.3. Number of Retail Stores in KSA by cities, 2024
5.4. Number of POS Installed
5.5. Revenues generated by Offline Retail industry in KSA, 2018-2023
5.6. Revenue split for offline retail industry by Category segment, 2023
5.7. Market share of major players in offline retail industry by category segment
6.1. Revenue Streams for KSA POS Lending Market,
6.2. Business Model Canvas for KSA POS Lending Market for BNPL Players, Banks and Private Finance Companies
6.3. Margin Structure Between Merchants and BNPL Companies
9.1. GMV, 2018-2024
9.2. Number of POS Lending Merchants, 2018-2024
10.1. By Market Structure (BNPL, Banks and Private Finance Companies), 2023-2024P
10.2. By Mode of Lending (Online and Offline Segment), 2023-2024P
10.3. By Retail Segment (Fashion, Electronics, Furniture and others), 2023-2024P
10.4. By Region (Riyadh, Eastern Province, Makkah, etc.), 2023-2024P
11.1. Number of Retail Customers Registered with BNPL
11.2. Salaries of Retail Customers Registered with BNPL
11.3. Preferred POS Lending Brand for Online Payment
11.4. Preferred POS Lending Brand for In-Store Payment
11.5. Have you used BNPL Service in the Past?
11.6. Customer Landscape and Cohort Analysis
11.7. Customer Journey and Decision-Making Process
11.8. Needs, Desires, and Pain Point Analysis
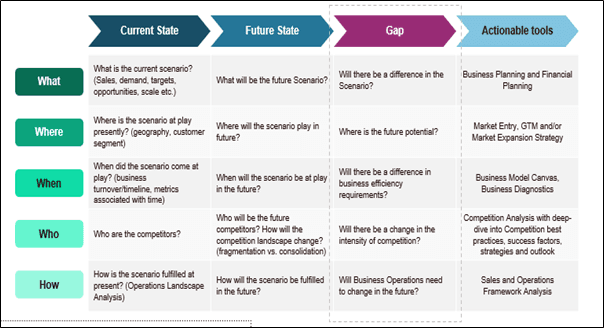
11.9. Gap Analysis Framework
11.10. Customer Feedback while Purchasing POS Lending
12.1. Trends and Developments for KSA POS Lending Market
12.2. Growth Drivers for KSA POS Lending Market
12.3. SWOT Analysis for KSA POS Lending Market
12.4. Issues and Challenges for KSA POS Lending Market
12.5. Government Regulations for KSA POS Lending Market
15.1. Average Loan Term and Finance Value, 2023
15.2. Acceptance Rate Vs POS Lending Sales, 2023
16.1. Market Share of Major Players in KSA POS Lending Market for BNPL Companies, 2024
16.2. List of Major Retail Merchants and Lending Partners
16.3. Cross Comparison of POS Lending Providers (Banks, BNPL and Private Finance Companies) based on Interest Rate, Fees and Minimum Transaction Amount
16.4. Cost of Risk Involved and Acceptance Rate between Banks, Financing Companies and BNPL
16.5. Benchmark of Key Competitors in KSA POS Lending Market Basis Operational and Financial Variables
16.6. Strength and Weakness Analysis
16.7. Operating Model Analysis Framework
16.8. Gartner Magic Quadrant
16.9. Bowmans Strategic Clock for Competitive Advantage
17.1. GMV, 2025-2029
17.2. Number of POS Lending Merchants, 2025-2029
18.1. By Market Structure (BNPL, Banks and Private Finance Companies), 2025-2029
18.2. By Mode of Lending (Online and Offline Segment), 2025-2029
18.3. By Retail Segment (Fashion, Electronics, Furniture and others), 2025-2029
18.4. By Region (Riyadh, Eastern Province, Makkah, etc.), 2025-2029
18.5. Recommendations
18.6. Opportunity Analysis
Discuss a Customized Research Scope
Custom research scope • Tailored insights • Industry expertise
Research Methodology
Step 1: Ecosystem Creation
Map the ecosystem and identify all the demand side and supply side entities for the KSA POS Lending Market. Based on this ecosystem, we will shortlist leading 5-6 POS lending platforms in the country based on their financial performance, customer base, transaction volumes, and partnerships.
Sourcing is done through industry articles, multiple secondary, and proprietary databases to perform desk research and gather industry-level information relevant to the KSA POS lending ecosystem.
Step 2: Desk Research
We engage in an exhaustive desk research process by referencing diverse secondary and proprietary databases. This allows us to conduct a thorough analysis of the POS lending market, aggregating insights such as market revenues, number of key players, pricing trends, demand drivers, and challenges. We supplement this with detailed examinations of company-level data, including press releases, annual reports, and financial statements. This step constructs a comprehensive understanding of the market landscape and the companies operating within it.
Step 3: Primary Research
We conduct a series of in-depth interviews with C-level executives and other stakeholders representing various KSA POS Lending Market companies, retailers, and consumers. These interviews aim to validate market hypotheses, authenticate statistical data, and extract valuable operational and financial insights from these industry representatives. A bottom-to-top approach is used to evaluate the market share of each player, and these individual assessments are then aggregated to determine the overall market size.
As part of our validation strategy, we also carry out disguised interviews, where our team approaches companies under the guise of potential clients. This allows us to cross-verify the operational and financial information shared by company executives, comparing it against available secondary data. These interactions help us understand revenue streams, customer acquisition strategies, value chains, and pricing structures.
Step 4: Sanity Check
- Bottom-to-top and top-to-bottom analyses are conducted, along with market size modeling exercises, to ensure accuracy and consistency during the sanity check process. These steps help confirm the reliability of our data and projections, ensuring that the research methodology is both robust and reflective of real-world conditions
See What's Inside the Report
Get a preview of key findings, methodology and report coverage
Frequently Asked Questions
The KSA POS lending market is poised for substantial growth, reaching a valuation of SAR 5 Billion in 2023. This growth is driven by factors such as increasing consumer demand for flexible payment solutions, the rise of e-commerce, and the expansion of the FinTech ecosystem. The market's potential is further bolstered by the increasing adoption of buy-now-pay-later (BNPL) services and government support for financial technology under Vision 2030.
The KSA POS Lending Market features several key players, including Tamara, Tabby, Spotii, and Cashew. These companies dominate the market due to their robust technological platforms, wide-reaching retail partnerships, and strong brand presence in the market. Other notable participants include traditional banks like Riyad Bank and Al Rajhi Bank, which are increasingly entering the POS lending space.
The primary growth drivers include the increasing demand for alternative payment solutions, particularly BNPL services, which allow consumers to manage expenses more flexibly. Additionally, the rapid growth of e-commerce, supported by digital transformation initiatives, is boosting the adoption of POS lending across various retail segments. Government reforms to encourage FinTech innovation and the rising consumer preference for cashless transactions further contribute to the growth of the KSA POS Lending Market.
The KSA POS Lending Market faces several challenges, including risks related to consumer creditworthiness and default rates. Regulatory challenges, particularly in relation to data protection and financial transparency, can also impact the operations of POS lenders. Furthermore, small and medium-sized retailers may face difficulties in integrating POS financing solutions into their existing systems, limiting the widespread adoption of these services.
License Options
PDF + Excel
Complete report package
$4,000
Excel Only
Data and analytics
$2,500
Custom Sections
Starts from $100
$0