KSA Warehousing Market Outlook to 2030
By Warehouse Type, By Function, By Ownership/Operating Model, By Temperature Zone, and By Region
Report Overview
Report Code
TDR0381
Coverage
Middle East
Published
November 2025
Pages
80
Flexible Purchase Options
Select and purchase only the chapters you need for your strategic decisions
On This Page
Report Overview
The report titled “KSA Warehousing Market Outlook to 2030 - By Warehouse Type, By Function, By Ownership/Operating Model, By Temperature Zone, and By Region” provides a comprehensive analysis of the warehousing industry in Saudi Arabia. The report covers an overview and genesis of the industry, overall market size in terms of revenue, market segmentation; trends and developments, regulatory landscape, customer level profiling, issues and challenges, and competitive landscape including competition scenario, cross-comparison, opportunities and bottlenecks, and company profiling of major players in the warehousing market.
Report Coverage
Verified Market Sizing
Multi-layer forecasting with historical data and 5–10 year outlook
Deep-Dive Segmentation
Cross-sectional analysis by product type, end user, application and region
Competitive Benchmarking & Positioning
Market share, operating model, pricing and competition matrices
Actionable Insights & Risk Assessment
High-growth white spaces, underserved segments, technology disruptions and demand inflection points
Review Methodology & Data Structure
Preview report structure, data sources and research framework
Executive Summary
The report titled “KSA Warehousing Market Outlook to 2030 - By Warehouse Type, By Function, By Ownership/Operating Model, By Temperature Zone, and By Region” provides a comprehensive analysis of the warehousing industry in Saudi Arabia. The report covers an overview and genesis of the industry, overall market size in terms of revenue, market segmentation; trends and developments, regulatory landscape, customer level profiling, issues and challenges, and competitive landscape including competition scenario, cross-comparison, opportunities and bottlenecks, and company profiling of major players in the warehousing market. The report concludes with future market projections based on warehousing capacity, operational models, regions, cause-and-effect relationships, and success case studies highlighting the major opportunities and cautions.
KSA Warehousing Market Overview and Size
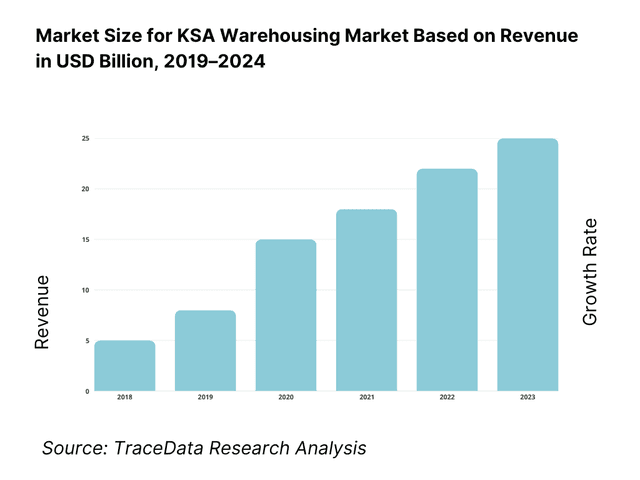
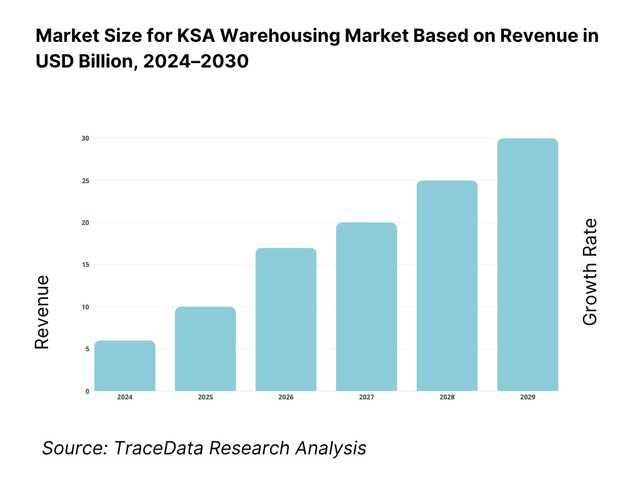
The Saudi warehousing market stands at USD 11.27 billion on a five-year historical base, shaped by the build-out of Grade-A parks in Riyadh and Jeddah, sustained FMCG and pharma throughput, and the deepening of e-commerce fulfillment. Subsequent readings show operating fundamentals tightening: 8.44 million TEUs processed across Saudi ports and logistics nodes, and 28 million sqm of warehouse & logistics stock in the capital region, alongside rent benchmarks around SAR 210 per sqm in prime precincts. These concrete flows and real-asset additions underpin revenue expansion.
Riyadh dominates due to the largest aggregation of ~28 million sqm of logistics stock, national network centrality, and proximity to MODON estates and ICDs; Jeddah leads the western corridor with port-adjacent parks and ~19.8 million sqm of logistics inventory, supporting import-export cross-dock and bonded flows. Dammam/Khobar and Jubail anchor energy-industrial warehousing linked to petrochemicals, while Yanbu and Medina support Red Sea flows. Elevated occupancy (often ~97%) and rising lease prints reflect scarce Grade-A supply in these hubs.
What Factors are Leading to the Growth of the KSA Warehousing Market:
Trade throughput and port-centric logistics density: Saudi ports continue to anchor warehousing expansion through steady maritime trade flows across the Red Sea and Arabian Gulf corridors. Total cargo handled reached 320.8 million tons, supported by 7.52 million container units and over 11,600 vessel calls. This throughput translates directly into increased storage, cross-docking, and bonded zone demand in Jeddah, Dammam, Khobar, and Jubail. With an economy valued at US$1.24 trillion, the Kingdom’s import, export, and re-export base is expanding. Inland connectivity through Riyadh’s ICDs enhances the link between ports and major consumption centers, requiring high-capacity pallet systems, multi-temperature chambers, and bonded storage to absorb monthly shipping cycles efficiently.
Digitized commerce and payments rails enabling fulfillment intensity: Warehousing utilization is accelerating due to the digitization of commerce and payments, which drives more frequent order lines, returns, and multi-client throughput. Electronic retail payment transactions reached 12.6 billion, illustrating the national pivot toward non-cash commerce and the rise of e-commerce fulfillment demand. With a population exceeding 35 million and GDP of US$1.24 trillion, consumption is heavily concentrated in Riyadh, Jeddah, and Dammam. Businesses are shifting from store-forward distribution to hub-and-spoke models, increasing the need for Grade-A warehouses, bonded e-commerce lanes, and value-added services such as labeling and kitting to manage daily order peaks and reverse logistics flows efficiently.
Air logistics momentum strengthening pharma and express warehousing: Rising air traffic volumes are strengthening demand for airport-adjacent warehousing facilities that handle high-value, time-sensitive goods. Airfreight throughput reached 606,000 tons within six months, alongside 62 million passengers and 446,000 flights, creating constant movement around major hubs. The national aviation footprint, exceeding 111 million passengers and valued at over US$50 billion, supports robust inventory turnover for pharmaceuticals, electronics, and express parcels. These cargo dynamics require warehouses with validated cold chains, emergency power systems, and automated storage to maintain service quality during fluctuating import cycles and overlapping passenger operations.
Which Industry Challenges Have Impacted the Growth of the KSA Warehousing Market:
Transshipment volatility and corridor concentration: Warehousing Market operators must contend with fluctuations in transshipment and vessel schedules that affect yard utilization and dock efficiency. Total containers handled stood at 7.52 million units compared to 8.44 million previously, with 1.72 million being transshipment volumes and 11,600 ship arrivals. These absolute variances stress bonded capacity and yard planning, particularly within port-centric clusters in Jeddah, Dammam, and Riyadh’s logistics corridors. To manage these irregularities, operators need flexible storage designs, overflow yards, and hybrid cross-dock models to prevent congestion and ensure throughput continuity during seasonal peaks or shipping disruptions.
Network performance gaps relative to global logistics leaders: Despite significant infrastructure progress, Saudi Arabia still trails top-tier global logistics ecosystems in end-to-end performance, customs clearance, and visibility integration. While scale is strong—with 7.52 million container units and 320.8 million tons of cargo handled—the efficiency of customs workflows, predictive tracking, and real-time warehouse data exchange remains below leading benchmarks. Enhancing WMS, TMS, and API interoperability will be critical to improving dock-to-stock times, reducing dwell, and achieving higher on-time-in-full delivery rates comparable to global logistics centers in Europe and East Asia.
Capacity ramp required in air cargo and special logistics zones: Saudi Arabia’s ambitions to scale air cargo and special logistics zones require a substantial increase in warehouse capacity near major airports. The current base of roughly 0.8 million tons in air cargo handling is expanding, with four new commercial licenses issued for e-commerce and logistics operators at the Riyadh Integrated Special Logistics Zone. Combined with the 606,000 tons moved within six months, these figures highlight a fast-growing demand for GDP-qualified chambers, advanced automation, and apron-side access. Expanding this infrastructure over the coming years is essential to prevent bottlenecks and maintain seamless cargo flow amid rising international freight activity.
What are the Regulations and Initiatives which have Governed the Market:
ZATCA Bonded Zones – licensing categories and operator obligations: Warehousing operators managing import staging and re-export activities must comply with ZATCA’s bonded licensing framework. The authority recognizes four bonded classifications—Bonded Zone, Specialized Bonded Zone, Bonded Tanks, and Temporary Bonded Zone. Applicants undergo evaluation, site inspection, and compliance verification before approval. Each license specifies operational boundaries for storage, labeling, coding, and value-added services. These bonded facilities integrate with Saudi ports’ 320.8 million tons of cargo throughput, forming the backbone for customs-controlled warehousing, trade facilitation, and re-export logistics within the Kingdom.
SFDA Good Storage & Distribution Practices (GSDP) and medical-device storage rules: Pharmaceutical and medical-device warehouses must adhere to SFDA’s Good Storage and Distribution Practices (GSDP), ensuring temperature mapping, excursion control, and traceability across the supply chain. Regulatory frameworks such as MDS-REQ12 and MDS-G25 outline specific infrastructure and operational conditions for compliance. Airfreight exceeding 600,000 tons—much of which includes temperature-sensitive cargo—flows through facilities that must meet these standards. The guidelines enforce quality assurance, documentation, and monitoring for both medicinal and device logistics, anchoring Saudi Arabia’s reputation for safe, compliant pharmaceutical distribution.
Aviation-linked logistics zone permissions and connectivity enablers: To strengthen air logistics integration, the General Authority of Civil Aviation (GACA) has expanded its licensing framework for logistics firms operating within the Riyadh Integrated Special Logistics Zone. The aviation sector handled 62 million passengers and 446,000 flights in six months, contributing to over 111 million annual passenger movements. This sustained activity increases the need for compliant airport-area warehouses offering bonded storage and express logistics support. Licensing ensures that tenants meet operational, safety, and environmental standards, establishing a transparent, high-performance environment for express delivery and pharma logistics operators across Saudi Arabia’s major aviation hubs.
KSA Warehousing Market Segmentation
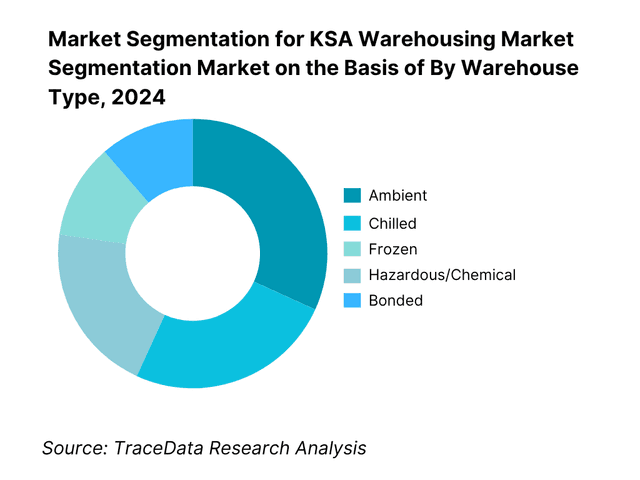
By Warehouse Type: KSA warehousing is segmented into ambient, chilled, frozen, hazardous/chemical, and bonded facilities. Recently, ambient has a dominant market share under this segmentation because most consumer and industrial SKUs—FMCG, general retail, automotive spares, and industrial MRO—require temperature-uncontrolled storage with high pick density rather than deep-freeze infrastructure. Developers have delivered large footprints of racked ambient boxes near ring roads and port corridors, supporting rapid cross-dock, e-commerce parcel injection, and bulk staging for grocery and general merchandise. Rent and fit-out economics also favor ambient: lower capex per sqm, simpler power redundancy, and faster commissioning timelines than multi-temperature chambers. Meanwhile, cold-chain supply is expanding for pharma and grocery but from a smaller base, and bonded footprints are specialized around customs regimes and re-export processes concentrated at port-centric parks.
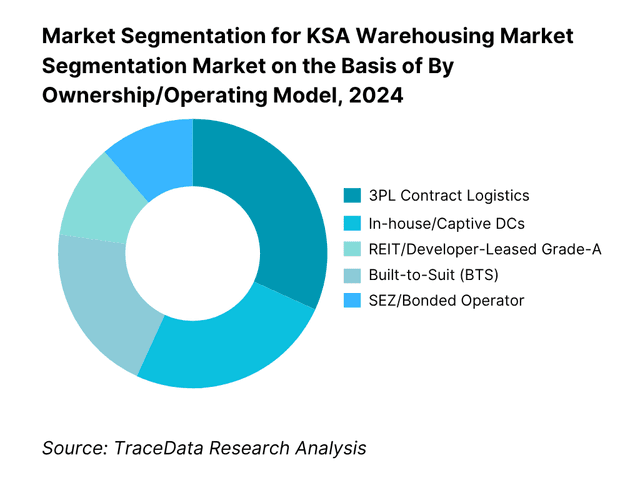
By Ownership/Operating Model: The market is segmented into 3PL contract logistics, in-house/captive DCs, REIT/developer-leased Grade-A, built-to-suit, and SEZ/bonded operator models. Recently, 3PL contract logistics has a dominant market share because enterprise customers prefer variable-cost, asset-light arrangements with KPI-linked SLAs that cover storage, handling, VAS, and fulfillment. 3PLs aggregate demand from FMCG, pharma, and omni-channel retail, enabling better slotting, higher utilization, and multi-client labor rosters. The model also accelerates technology adoption—WMS/TMS/YMS stacks, robotics pilots—without tenants committing heavy capex. Developer-leased Grade-A and BTS have grown as landlords and REITs add stock, yet most occupiers favor the agility and network effects of established 3PL operators, especially near Mawani ports, ICDs, and city-edge hubs supporting frequent replenishment and last-mile line-haul.
Competitive Landscape in KSA Warehousing Market
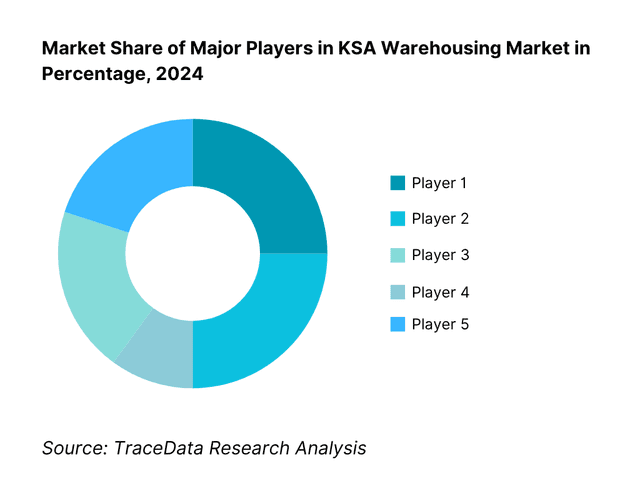
The KSA warehousing market features a mix of global 3PLs, regional champions, and park developers. Scarcity of Grade-A boxes and near-full occupancy in main corridors have spurred rent increases and stimulated developer pipelines. Port-linked assets and city-edge hubs are pivotal for e-commerce fulfillment, pharma GDP flows, and FMCG rotation, concentrating share among operators with multi-temperature capacity, bonded process know-how, and robust WMS integrations.
Name | Founding Year | Original Headquarters |
Almajdouie Logistics | 1965 | Dammam, Saudi Arabia |
NAQEL Express | 1993 | Riyadh, Saudi Arabia |
DHL Supply Chain | 1969 | Bonn, Germany |
Aramex | 1982 | Dubai, United Arab Emirates |
Wared Logistics | 2000 | Riyadh, Saudi Arabia |
CEVA Logistics | 2007 | Marseille, France |
Kuehne+Nagel | 1890 | Schindellegi, Switzerland |
DB Schenker | 1872 | Essen, Germany |
Maersk Logistics & Services | 1904 | Copenhagen, Denmark |
GAC Saudi Arabia | 1956 | Gothenburg, Sweden |
Agility Logistics Parks | 1979 | Sulaibiya, Kuwait |
DP World Logistics KSA | 1972 | Dubai, United Arab Emirates |
LogiPoint | 1999 | Jeddah, Saudi Arabia |
Starlinks | 2019 | Riyadh, Saudi Arabia |
Binzagr Logistics | 1881 | Jeddah, Saudi Arabia |
Some of the Recent Competitor Trends and Key Information About Competitors Include:
Almajdouie Logistics: One of the oldest and most established logistics firms in Saudi Arabia, Almajdouie Logistics has recently expanded its warehousing footprint in Dammam and Riyadh with new temperature-controlled facilities supporting petrochemical and FMCG clients. The company has introduced automation-enabled handling systems and upgraded its warehouse management system (WMS) to improve real-time visibility and throughput efficiency across multi-client warehouses.
NAQEL Express: NAQEL Express has invested heavily in expanding its nationwide warehousing and last-mile infrastructure to support the surge in e-commerce volumes. In 2023–2024, the company added over 100,000 sqm of new warehousing space and launched chilled and ambient zones integrated with its express parcel network. It continues to leverage its strong domestic presence and SFDA-compliant storage solutions for healthcare and pharmaceutical sectors.
DHL Supply Chain: DHL Supply Chain has reinforced its presence in the Kingdom by introducing robotics and automation technologies in its Riyadh and Jeddah facilities. The company is deploying AS/RS systems and real-time data platforms to enhance inbound and outbound productivity. DHL is also investing in sustainability initiatives, including solar-powered warehouses and carbon-neutral operations aligned with the Kingdom’s Vision 2030 logistics strategy.
Aramex: Aramex has upgraded its Riyadh fulfillment center to support same-day and next-day delivery solutions for e-commerce clients. The company has also rolled out AI-enabled route optimization and real-time inventory tracking across its network. In addition, Aramex has introduced bonded storage solutions for cross-border e-commerce, capitalizing on Saudi Arabia’s growing re-export and customs-transit corridors.
Wared Logistics: Wared Logistics has focused on expanding its domestic network and developing new Grade-A warehouse facilities near industrial zones in Riyadh and Jeddah. The company recently signed long-term lease agreements with FMCG and manufacturing clients and introduced automated storage racks to increase space utilization. Wared continues to emphasize value-added logistics services such as repackaging and inventory customization.
What Lies Ahead for KSA Warehousing Market?
The KSA Warehousing Market is poised for robust expansion through the latter half of the decade, reflecting the country’s transformation into a global logistics hub under Vision 2030. With national logistics expenditures exceeding SAR 219 billion and the economy valued at USD 1.24 trillion, Saudi Arabia’s warehousing sector is expected to experience sustained structural growth. The focus on multimodal integration, automation, and sustainability continues to redefine operational standards across industrial and port-centric corridors.
Rise of Integrated Logistics Zones: The future of Saudi warehousing will be defined by the emergence of integrated logistics and special economic zones. The Riyadh Integrated Special Logistics Zone and similar parks near Jeddah Islamic Port and King Abdullah Port are driving significant investment inflows. Saudi ports handled 320.8 million tons of cargo and 7.52 million TEUs of containers, establishing the throughput that sustains warehousing demand. These zones provide bonded storage, customs simplification, and multimodal connectivity, positioning KSA as the Gulf’s most advanced logistics nucleus.
Acceleration of Automation and Digital Infrastructure: Saudi warehouses are rapidly adopting automation and digital control layers to increase productivity per square meter. The Kingdom’s digital infrastructure processed more than 45 billion transactions across government and commercial systems, enabling the deployment of IoT sensors, automated storage and retrieval systems, and predictive inventory platforms. Warehousing operators such as DHL, Starlinks, and NAQEL are integrating robotics and AI to enhance “dock-to-stock” speed. The rise in 12.6 billion electronic payment transactions further strengthens both B2B and B2C fulfillment intensity, encouraging continued investment in real-time data infrastructure.
Expansion of Temperature-Controlled and Pharma GDP Storage: A key growth vector lies in expanding temperature-controlled and pharmaceutical-grade warehousing, driven by increasing healthcare imports and life-science manufacturing. National guidelines mandate Good Storage and Distribution Practices (GSDP) for all medical-product warehouses, ensuring consistent quality and traceability. Airfreight throughput exceeding 600,000 tons demonstrates rising demand for GDP-qualified storage near Riyadh, Jeddah, and Dammam airports. Developers are increasingly investing in multi-temperature chambers, backup power systems, and validated monitoring infrastructure to accommodate the expanding flow of temperature-sensitive and high-value cargo.
Sustainability and Green Warehousing Transformation: Sustainability has become central to Saudi Arabia’s warehousing strategy, with strong policy alignment toward carbon reduction and energy efficiency. Commercial facilities account for over 50 terawatt-hours of electricity consumption annually, creating strong incentives for solar rooftop systems, LED lighting retrofits, and energy-optimized HVAC operations. Public and private sector initiatives under the National Industrial Development and Logistics Program (NIDLP) and the Public Investment Fund (PIF) are driving the development of green logistics parks. Future warehouses will integrate renewable power generation, recycled water networks, and electric yard fleets—reducing operational costs and aligning with national net-zero ambitions.
Regional Corridor Diversification: Warehousing growth is expanding beyond Riyadh and Jeddah to new strategic corridors such as NEOM–Oxagon, Jazan Economic City, and the King Salman Energy Park (SPARK). These emerging zones are designed to support industrial, e-commerce, and petrochemical supply chains. Industrial output valued at SAR 905 billion underlines the need for proximity warehousing for machinery, construction materials, and chemicals. Inland connectivity via the Saudi Land Bridge—spanning approximately 1,300 kilometers between the Red Sea and the Arabian Gulf—will further strengthen east-west inventory flow and accelerate regional re-export activities through multimodal distribution centers.
Emphasis on Workforce Localization and Skill Enhancement: As the logistics sector matures, workforce localization and professional skill enhancement have become critical to sustaining efficiency. Over 9.3 million employees are active in the private sector, with government initiatives expanding Saudization and technical upskilling programs. The next generation of warehouses demands certified forklift operators, WMS controllers, and automation engineers, prompting logistics firms to invest in training and certification partnerships. Collaboration among developers, vocational institutions, and regulatory agencies is creating a sustainable talent pipeline capable of managing increasingly digital and automated logistics ecosystems.
KSA Warehousing Market Segmentation
By Warehouse Type
Ambient Warehouses
Chilled Warehouses
Frozen Warehouses
Hazardous/Chemical Warehouses
Bonded Warehouses
By Function
Storage & Inventory Holding
Fulfilment & Distribution
Cross-Docking & Transloading
Value-Added Services (VAS)
Reverse Logistics & Returns Processing
By Ownership/Operating Model
3PL Contract Logistics
In-House/Captive Distribution Centers
REIT/Developer-Leased Facilities
Built-to-Suit (BTS)
SEZ/Bonded Operators
By Temperature Zone
Ambient (15–30°C)
Chilled (0–5°C)
Frozen (≤–18°C)
Multi-Temperature Facilities
Pharma GDP-Qualified Warehouses
By Region/Logistics Corridor
Riyadh & Central ICDs
Jeddah & Western Corridor
Dammam/Khobar/Jubail (Eastern Corridor)
NEOM/Oxagon & Northern Red Sea
Jazan/Abha/Asir (Southern Corridor)
Players Mentioned in the Report:
Almajdouie Logistics
NAQEL Express
DHL Supply Chain
Aramex; Wared Logistics
CEVA Logistics
Kuehne+Nagel
DB Schenker
Maersk Logistics & Services (KSA)
GAC Saudi Arabia
Agility Logistics Parks
DP World Logistics KSA
LogiPoint
Starlinks
Binzagr Logistics.
Key Target Audience
Corporate Supply Chain & Logistics Heads (Enterprise Shippers)
Industrial Estate Developers & REITs (e.g., Jadwa REIT, SEDCO Capital REIT)
Government & Regulatory Bodies (Mawani, ZATCA, SFDA, MISA, MODON, RCJY)
E-commerce Marketplaces & Omni-channel Retailers
Pharmaceuticals MAHs & Healthcare Distributors
Food & Grocery Principals and Cold-Chain Operators
Automotive OEMs & Aftermarket Distributors
Investments and Venture Capitalist Firms
Time Period:
Historical Period: 2019-2024
Base Year: 2025
Forecast Period: 2025-2030
Explore Flexible Purchase Options or Have Limited Budget?
Pay only for relevant chapters • Customizable report sections
Table of Contents
Choose individual sections to purchase. Mix and match as you like.
4.1. Delivery Model Analysis for Warehousing
4.2. Revenue Streams for KSA Warehousing Market
4.3. Business Model Canvas for KSA Warehousing Market
5.1. Third-Party Logistics (3PL) vs. In-House Warehousing
5.2. Investment Model in KSA Warehousing Market
5.3. Comparative Analysis of Facility Operations by Public vs. Private Entities
5.4. Budget Allocation and Cost Components (by Facility Size and Spec)
8.1. Revenues (SAR Bn) and Pallet Positions (Mn Units)
9.1. By Warehouse Type (Ambient, Chilled, Frozen, Hazardous, Bonded)
9.2. By Function (Storage, Fulfillment, Cross-Dock, VAS, Returns)
9.3. By End-User Industry (FMCG, Pharma, Automotive, E-Commerce, Petrochemicals)
9.4. By Ownership Model (3PL, In-House, REIT-Leased, BTS)
9.5. By Technology Level (Manual, Semi-Automated, Automated, Robotics-Enabled)
9.6. By Temperature Zone (Ambient, Chilled, Frozen, Multi-Temperature)
9.7. By Open and Bonded Facilities
9.8. By Region (Riyadh, Jeddah, Dammam/Khobar, Medina/Yanbu, NEOM/Oxagon, Jazan/Asir)
10.1. Customer Cohort Analysis (E-Commerce, FMCG, Pharma, Automotive)
10.2. Procurement and Site Selection Process (KPI-Based SLAs, Rent vs. Service Evaluation)
10.3. Warehouse Performance Metrics & ROI (pallet turnover ratio, OTIF %, utilization %)
10.4. Gap Analysis Framework (space vs. throughput vs. automation mismatch)
11.1. Trends and Developments (robotics adoption, ESG warehouses, cold-chain expansion)
11.2. Growth Drivers (Vision 2030 logistics hub, e-commerce, port throughput, SEZs)
11.3. SWOT Analysis (asset quality, labor, regulation, energy efficiency)
11.4. Issues and Challenges (land cost, utility tariffs, compliance burden)
11.5. Regulatory Landscape (Mawani, ZATCA, SFDA GDP, SASO, Civil Defense)
12.1. Market Size and Future Potential for Automation (AS/RS, AMRs, WMS, IoT)
12.2. Business Model and Revenue Streams (equipment sales, leasing, service contracts)
12.3. Deployment Models and Technology Stack
15.1. Market Share of Key Players (by Revenue, Pallet Positions, Temperature Zones)
15.2. Benchmark of Key Competitors (Company Overview, USP, Facility Footprint, Business Model, Revenues, Technology Stack, Pallet Positions, Multi-Temperature Zones, Major Clients, Strategic Partnerships, Automation Investments, Marketing Strategy, Recent Developments)
15.3. Operating Model Analysis Framework (Asset-Light vs. Asset-Heavy)
15.4. Gartner-Style Quadrant for Warehousing Excellence
15.5. Bowman’s Strategic Clock-Differentiation and Cost Leadership Analysis
16.1. Revenues, Pallet Capacity, and Built-Up Area Projections
17.1. By Warehouse Type
17.2. By Function
17.3. By End-User Industry
17.4. By Ownership/Operating Model
17.5. By Technology Level
17.6. By Temperature Zone
17.7. By Open vs. Bonded
17.8. By Region
Discuss a Customized Research Scope
Custom research scope • Tailored insights • Industry expertise
Research Methodology
Step 1: Ecosystem Creation
Map the ecosystem and identify all the demand-side and supply-side entities for the KSA Warehousing Market. Based on this ecosystem, we will shortlist leading 5–6 warehousing operators in the country based on their financial information, operational scale, technology adoption, and client base. Sourcing is conducted through industry bulletins, government portals (Mawani, ZATCA, SFDA, GACA), and multiple secondary and proprietary databases to perform desk research around the market to collate industry-level information.
Step 2: Desk Research
Subsequently, we engage in an exhaustive desk research process by referencing diverse secondary and proprietary databases. This approach enables us to conduct a thorough analysis of the market, aggregating industry-level insights. We delve into aspects like the total warehousing stock (approximately 28 million sqm in Riyadh, 19.8 million sqm in Jeddah, and 12 million sqm in Dammam), TEU throughput (7.52 million at Saudi ports), and cargo tonnage (320.8 million tons handled, as per Mawani). We supplement this with detailed examinations of company-level data, relying on sources such as annual reports, sustainability disclosures, and infrastructure filings. This process aims to construct a foundational understanding of both the market and the entities operating within it.
Step 3: Primary Research
We initiate a series of in-depth interviews with C-level executives and other stakeholders representing various KSA Warehousing Market operators and end-users. This interview process serves a multi-faceted purpose: to validate market hypotheses, authenticate statistical data, and extract valuable operational and financial insights from these industry representatives. A bottom-to-top approach is undertaken to evaluate capacity contributions for each player, thereby aggregating to the overall market. As part of our validation strategy, our team executes disguised interviews wherein we approach each company under the guise of potential clients. This approach enables us to validate operational and financial information shared by company executives, corroborating this data against what is available in secondary databases. These interactions also provide us with a comprehensive understanding of occupancy rates, rent structures, SLA mechanisms, and warehouse automation adoption.
Step 4: Sanity Check
A bottom-to-top and top-to-bottom analysis along with market size modeling exercises is undertaken to assess the sanity of the process. The top-down validation aligns national macro indicators—GDP of US$1.24 trillion and 320.8 million tons of cargo handled (Mawani)—with warehousing stock and throughput intensity. The bottom-up validation aggregates operator-level facility footprints, temperature zone capacity, and throughput volume derived from interviews and disclosures. Both approaches are cross-verified for consistency to ensure that the final KSA Warehousing Market model accurately represents the real operating environment across Riyadh, Jeddah, and Dammam logistics corridors.
See What's Inside the Report
Get a preview of key findings, methodology and report coverage
Frequently Asked Questions
The KSA Warehousing Market is positioned for strong structural growth, reaching a valuation of USD 11.27 billion in 2023. This potential is underpinned by Saudi Arabia’s transformation into a global logistics hub under Vision 2030, which aims to increase the country’s logistics contribution to GDP from 6% to 10%. The Kingdom’s economy, valued at USD 1.24 trillion, supports large-scale consumption, industrial production, and cross-border trade—creating consistent demand for warehousing capacity across key corridors such as Riyadh, Jeddah, and Dammam. The market’s scalability is further strengthened by major investments in integrated logistics zones and the expansion of cold-chain and automation-enabled warehouses.
The KSA Warehousing Market features several key players that shape its logistics and storage landscape. Major operators include Almajdouie Logistics, NAQEL Express, DHL Supply Chain, Aramex, Wared Logistics, CEVA Logistics, Kuehne+Nagel, and Agility Logistics Parks. These companies dominate due to their national-scale networks, diversified warehousing portfolios, and technology-driven operations. Other prominent players—DB Schenker, Maersk Logistics & Services, GAC Saudi Arabia, DP World Logistics, LogiPoint, Starlinks, and Binzagr Logistics—strengthen the market through specialization in bonded, port-centric, and e-commerce fulfillment warehousing. Collectively, they operate millions of square meters of Grade-A storage, leveraging WMS/TMS integrations and SFDA GDP-certified facilities to serve multi-sector clients.
The market’s expansion is driven by macroeconomic, infrastructural, and technological enablers. Saudi Arabia’s GDP reached USD 1.24 trillion (World Bank), providing a strong trade base and industrial production network that demands large-scale storage. The Saudi Ports Authority (Mawani) reported 320.8 million tons of cargo throughput and 7.52 million TEUs handled in 2024, sustaining warehouse utilization and bonded zone requirements. Additionally, the rise of e-commerce, supported by 12.6 billion electronic payment transactions recorded by the Saudi Central Bank, accelerates fulfillment warehousing. Government initiatives under the National Industrial Development and Logistics Program (NIDLP) and GACA’s Special Logistics Zones are expanding integrated warehousing, digital tracking, and multimodal connectivity across the Kingdom.
The KSA Warehousing Market faces several operational and regulatory challenges that affect capacity expansion and service quality. High land lease rates and energy tariffs increase the cost of developing Grade-A facilities, while occupancy levels above 95% in Riyadh and Jeddah constrain new entrants. Regulatory complexity under ZATCA’s bonded zone licensing and SFDA’s GSDP certification adds time and compliance costs, especially for temperature-controlled and pharmaceutical warehouses. Furthermore, a shortage of skilled warehouse technicians and automation specialists, coupled with extended grid-connection timelines for cold-storage projects, continues to limit operational scalability. Addressing these constraints will be critical to maintaining momentum in Saudi Arabia’s Vision 2030 logistics transformation.
License Options
PDF + Excel
Complete report package
$4,000
Excel Only
Data and analytics
$2,500
Custom Sections
Starts from $100
$0