Malaysia Portable Toilet Rental Market Outlook to 2030
By Market Structure, By Application, By Unit Type, By Rental Duration, By Maintenance Service Level, and By Region
Report Overview
Report Code
TDR0385
Coverage
Asia
Published
November 2025
Pages
80
Flexible Purchase Options
Select and purchase only the chapters you need for your strategic decisions
On This Page
Report Overview
The report titled “Malaysia Portable Toilet Rental Market Outlook to 2030 - By Market Structure, By Application, By Unit Type, By Rental Duration, By Maintenance Service Level, and By Region” provides a comprehensive analysis of the portable sanitation market in Malaysia. The report covers an overview and genesis of the industry, overall market size in terms of revenue and deployed units, market segmentation; trends and developments, regulatory landscape, customer level profiling, issues and challenges, and competitive landscape including competition scenario, cross-comparison, opportunities and bottlenecks, and company profiling of major players in the portable toilet rental market.
Report Coverage
Verified Market Sizing
Multi-layer forecasting with historical data and 5–10 year outlook
Deep-Dive Segmentation
Cross-sectional analysis by product type, end user, application and region
Competitive Benchmarking & Positioning
Market share, operating model, pricing and competition matrices
Actionable Insights & Risk Assessment
High-growth white spaces, underserved segments, technology disruptions and demand inflection points
Review Methodology & Data Structure
Preview report structure, data sources and research framework
Executive Summary
The report titled “Malaysia Portable Toilet Rental Market Outlook to 2030 - By Market Structure, By Application, By Unit Type, By Rental Duration, By Maintenance Service Level, and By Region” provides a comprehensive analysis of the portable sanitation market in Malaysia. The report covers an overview and genesis of the industry, overall market size in terms of revenue and deployed units, market segmentation; trends and developments, regulatory landscape, customer level profiling, issues and challenges, and competitive landscape including competition scenario, cross-comparison, opportunities and bottlenecks, and company profiling of major players in the portable toilet rental market. The report concludes with future market projections based on deployment volumes, service mixes, regions, cause-and-effect relationships, and success case studies highlighting the major opportunities and cautions.
Malaysia Portable Toilet Rental Market Overview and Size
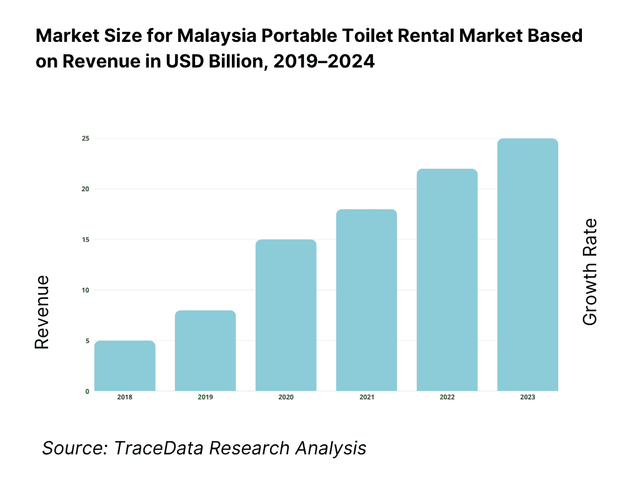
The Malaysia portable toilet rental market’s scale is still emerging in published literature. Globally, the portable toilet rental market was valued at USD 22.8 billion in 2024, and the Asia-Pacific segment recorded revenues of USD 9,405.4 million in 2024. While no reliable public source breaks out Malaysia specifically, operators and local market reports suggest Malaysia’s portion is a niche but growing share of the regional pie, driven by construction growth, tourism recovery, events rebound, and public sanitation investments. The domestic market in 2023 is estimated (via bottom-up aggregation of major operator disclosures and event/construction demand proxies) at around USD 30–50 million (or RM ~140–230 million), reflecting increasing adoption in urban centers and infrastructure expansion.
Several Malaysian cities and regions dominate demand: Klang Valley (Kuala Lumpur / Selangor) leads due to dense construction and event activity; Johor Bahru / Southern corridor draws demand from cross-border and industrial projects; Penang and Iskandar benefit from manufacturing and tourism zones. In Sabah and Sarawak, expansion is nascent but growing, especially where remote tourism and rural infrastructure drives portable sanitation needs. The dominance of urbanized states is due to concentration of large construction, events, and municipal contracting capability.
What Factors are Leading to the Growth of the Malaysia Portable Toilet Rental Market:
Public construction activity and state development: Malaysia’s construction sector generated RM158.8 billion in value of work done in 2024, with RM42.0 billion recorded in the last quarter alone—each worksite requiring portable sanitation during earthworks, piling, and finishing phases. Federal development allocations of RM90 billion in Budget 2024 supported transport, utilities, and social infrastructure projects that directly translate into multi-month rental contracts and frequent servicing runs. With Malaysia’s GDP at USD 444.98 billion, fiscal capacity continues to sustain contractor liquidity, enabling large-scale procurement of portable sanitation fleets and related waste management services.
Visitor inflows and tourism spending: Tourism Malaysia recorded 37,961,485 foreign visitors in 2024 and RM106.8 billion in tourism expenditure, driving substantial demand for portable sanitation across outdoor festivals, fairs, and temporary venues nationwide. These inflows coincide with Malaysia’s 34.2 million population, amplifying domestic crowd concentration in event hotspots like Klang Valley, Johor, and Penang. The combination of high visitor numbers and active urban mobility increases sanitation requirements for concerts, religious gatherings, and public events, directly translating into greater fleet deployment and rental turnover for operators serving these high-density regions.
Sewerage-system scale and regulated effluent handling: Malaysia’s national sewerage company, Indah Water Konsortium, manages over 7,000 sewage treatment plants and a connected population equivalent of 30.59 million, handling about 7,035 million liters of treated effluent daily. This regulated network ensures proper disposal and sludge management, requiring portable toilet operators to interface with licensed treatment facilities for waste offloading. The scale of the system provides a stable backbone for continuous servicing cycles and predictable maintenance demand, ensuring long-term revenue consistency through compliance-based waste disposal partnerships across both Peninsular and East Malaysia.
Which Industry Challenges Have Impacted the Growth of the Malaysia Portable Toilet Rental Market:
Cross-regional logistics across East Malaysia raise deployment and servicing costs: Operators serving Sabah and Sarawak face significant logistical barriers, with Sarawak spanning 124,450 km² and Sabah 73,620 km²—together larger than Peninsular Malaysia’s 130,590 km². These vast territories, combined with a population exceeding 3.4 million in Sabah, create challenges in equipment transport, servicing frequency, and turnaround times. The dispersed population across mountainous interiors and island zones increases fleet travel distances, fuel usage, and maintenance overhead, reducing operational efficiency and increasing costs for portable sanitation companies operating in East Malaysia’s rural and tourism corridors.
Monsoon rainfall and extreme weather disrupt schedules: Intense rainfall and seasonal monsoon events in Malaysia significantly hinder fleet mobility and site servicing reliability. Recorded rainfall of 118.6 mm over five days and 444.8 mm over a 30-day period during major weather events illustrate how quickly flooding can restrict road access. These disruptions affect vacuum tankers, cleaning crews, and on-site servicing logistics. Extended monsoon warnings across coastal regions like Bintulu and Sabah often result in rescheduling or delay of maintenance intervals, reducing service consistency and raising operational risks for rental operators dependent on predictable access routes.
Disposal compliance and facility capacity constraints: Disposal operations must align with Malaysia’s regulated sewerage framework, which serves a connected population equivalent of 30.59 million across more than 7,000 plants. When regional treatment capacity reaches limits, operators experience extended queue times and must transport collected waste to alternate facilities, increasing service hours and logistical costs. These regulatory constraints make adherence to environmental and sewage regulations mandatory. Failure to align with plant scheduling, competency requirements, or facility gate times can result in penalties, reputational risks, and disrupted service commitments under government or corporate rental contracts.
What are the Regulations and Initiatives which have Governed the Market:
Water Services Industry Act 655: The Water Services Industry Act 2006 (Act 655) establishes the legal basis for sewerage and water service regulation across Peninsular Malaysia and the federal territories of Putrajaya and Labuan. Portable toilet operators must coordinate with licensed sewerage providers under this framework for effluent transport and discharge. The act mandates compliance in areas such as treatment standards, plumbing, and waste conveyance practices. Operators are required to maintain competent personnel, follow safety and hygiene guidelines, and ensure full adherence to SPAN regulations before accessing treatment plants for waste disposal.
Environmental Quality (Sewage) Regulations P.U.(A) 432/2009: The Environmental Quality (Sewage) Regulations 2009 define discharge standards, inspection requirements, and competent-person qualifications for handling sewage. Although portable toilet waste is not processed on-site, operators are obligated to ensure compliance when transferring waste to licensed treatment plants. These regulations specify the permissible effluent parameters and documentation procedures that must be followed during waste collection, transport, and disposal. Adherence to these standards minimizes environmental risks, ensures hygienic management of waste streams, and provides traceable accountability within Malaysia’s environmental governance framework.
Solid Waste and Public Cleansing Management Act 672: The Solid Waste and Public Cleansing Management Act 2007 (Act 672) governs waste management licensing and operational standards across Peninsular Malaysia and the Federal Territories. Portable toilet service providers offering waste collection, site cleaning, or sanitation services must obtain licensing under this act. The framework standardizes collection procedures, establishes penalties for non-compliance, and delineates jurisdictional authority across states such as Johor, Pahang, Negeri Sembilan, and Melaka. Compliance ensures that portable sanitation operators integrate seamlessly with Malaysia’s broader public cleansing and environmental management ecosystem.
Malaysia Portable Toilet Rental Market Segmentation
By Application / End-Use: In Malaysia, Construction & Infrastructure Projects dominate share because large public works (roads, MRT, utilities) and private real estate developments continually require on-site sanitation. Contractors prefer outsourcing portable toilets rather than installing permanent facilities in early phases. The large scale, recurring nature, and long-duration rental contracts lend this segment stable baseline demand and higher revenue share than episodic event rentals.
.png&w=640&q=75)
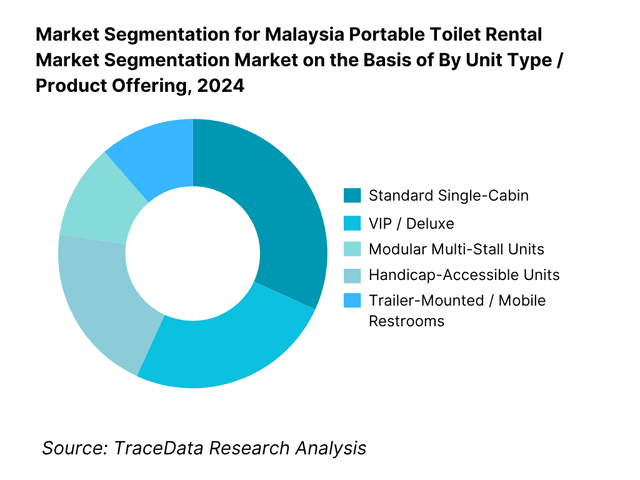
By Unit Type / Product Offering: Standard Single-Cabin Units dominate, due to lower cost, easier mobilization, broad acceptability, and minimal maintenance complexity. These units meet the core sanitation demand across construction, events, and municipal usage. More premium or trailer systems see adoption in higher-tier events or luxury resort zones, but their capital and servicing overhead restrict their share.
Competitive Landscape in Malaysia Portable Toilet Rental Market
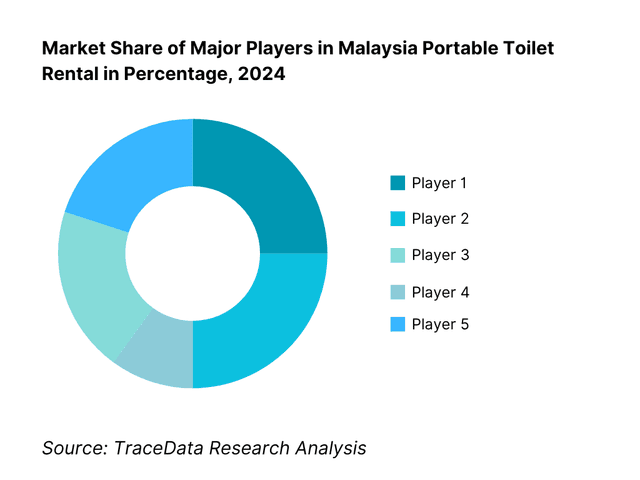
The Malaysia portable toilet rental market is moderately consolidated, with a handful of local and regional players commanding significant presence. These firms differentiate via fleet size, servicing efficiency, geographic coverage, and value-added services (e.g. IoT monitoring, green sanitation).
Name | Founding Year | Original Headquarters |
TOI TOI Services Malaysia | 2005 | Kuala Lumpur, Malaysia |
JustToi Sdn Bhd | 2010 | Penang, Malaysia |
EnviroAire Sdn Bhd | 2008 | Selangor, Malaysia |
Veeka Portable Toilet Sdn Bhd | 2012 | Johor, Malaysia |
Portalet Malaysia | 2015 | Kuala Lumpur, Malaysia |
Nura Industrial Services | 2011 | Johor Bahru, Malaysia |
MobileToilet Malaysia | 2013 | Kuala Lumpur, Malaysia |
EventToilet Malaysia | 2014 | Selangor, Malaysia |
BioToilet Malaysia | 2016 | Penang, Malaysia |
Ecotech Portable Sanitation | 2011 | Petaling Jaya, Malaysia |
Indah Water Konsortium (PPP Division) | 1994 | Kuala Lumpur, Malaysia |
Malaysia Event Hygiene Solutions | 2017 | Kuala Lumpur, Malaysia |
MyToilet Rentals Sdn Bhd | 2018 | Melaka, Malaysia |
WasteServe Malaysia | 2010 | Johor Bahru, Malaysia |
CleanEdge Environmental Services | 2019 | Kuala Lumpur, Malaysia |
Some of the Recent Competitor Trends and Key Information About Competitors Include:
TOI TOI Services Malaysia: As one of the leading portable toilet service providers in Malaysia, TOI TOI Services has expanded its fleet network across Klang Valley and Johor. The company recently invested in eco-friendly portable units with low-water usage systems and introduced IoT-enabled monitoring for fill-level and maintenance tracking to enhance operational efficiency and service reliability.
JustToi Sdn Bhd: Known for its strong presence in event and tourism sanitation, JustToi has strengthened partnerships with major event organizers and resorts. In 2024, it upgraded its rental portfolio with luxury and VIP toilet units designed for high-profile outdoor functions and festivals, emphasizing hygiene quality and user comfort.
EnviroAire Sdn Bhd: EnviroAire has focused on integrating smart fleet scheduling and route optimization software to reduce maintenance turnaround time. The company also secured several municipal contracts in Selangor and Negeri Sembilan, expanding its government and construction sector client base through consistent service quality and compliance with environmental regulations.
Veeka Portable Toilet Sdn Bhd: Veeka has enhanced its servicing capability by adding new vacuum tankers and investing in biodegradable cleaning chemicals. The company’s growth has been supported by rising industrial and construction activity in Johor and Melaka, where it remains a preferred partner for long-term project-based rentals.
Portalet Malaysia: Portalet has diversified its offerings by combining standard and hybrid rental models for clients seeking flexible servicing arrangements. In 2024, it introduced mobile hand-wash stations and improved odor-control solutions, catering to both government agencies and private event organizers aiming for higher sanitation standards.
What Lies Ahead for Malaysia Portable Toilet Rental Market?
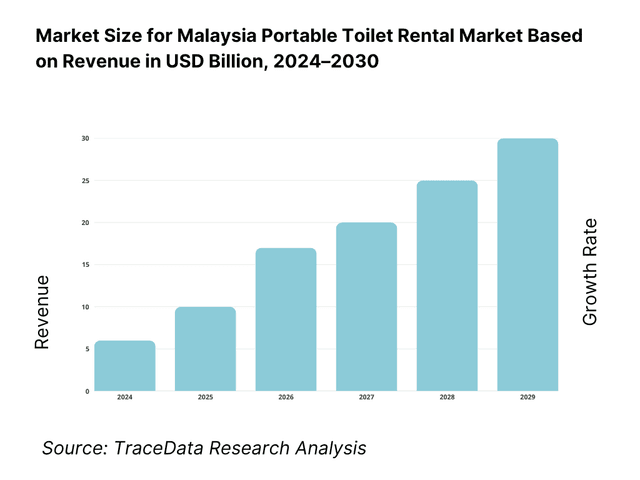
The Malaysia portable toilet rental market is poised for continued expansion over the next five years, driven by large-scale infrastructure investment, growth in tourism and public events, and a national push for improved sanitation standards. With the construction sector valued at RM158.8 billion (Department of Statistics Malaysia) and RM90 billion allocated in federal development expenditure (Ministry of Finance) under the latest national budget, consistent demand from project sites, events, and remote worksites will sustain market growth. Rising awareness of hygiene standards under Malaysia’s Environmental Quality and Solid Waste Management Acts will also catalyze modernization and compliance-driven upgrades in the industry.
Adoption of Smart and Sustainable Toilet Solutions: The future of Malaysia’s portable toilet rental market will be marked by the adoption of eco-friendly and smart sanitation units. Leading providers are expected to integrate IoT-based monitoring systems for real-time waste-level tracking, route optimization, and predictive maintenance. Simultaneously, the use of biodegradable chemicals and low-water consumption toilets will align with national sustainability objectives outlined by the Department of Environment and Indah Water Konsortium, which currently manages over 7,000 sewage treatment plants serving 30.59 million connected population equivalents. This transition to green and digital sanitation will define next-generation growth and efficiency standards in the market.
Rising Demand from Construction, Tourism, and Events: Malaysia’s robust infrastructure and tourism ecosystem will remain central to rental demand. The construction sector, contributing RM158.8 billion in work done, creates steady sanitation needs across sites in the Klang Valley, Johor, and Penang. Meanwhile, 37.9 million tourist arrivals and RM106.8 billion in tourist receipts (Tourism Malaysia) underscore a vibrant event and leisure economy that depends on portable hygiene infrastructure for concerts, sports, festivals, and outdoor attractions. This multi-sector demand convergence ensures high fleet utilization, particularly during peak tourism and public event periods, sustaining both short-term and long-term rental growth.
Digital Fleet Management and Operational Efficiency: As the market scales, portable toilet providers are expected to leverage digital fleet management tools for efficiency and service quality. Integration of GPS-enabled tankers, digital route planning, and automated servicing logs will reduce downtime and operational costs. This shift complements Malaysia’s Digital Economy Blueprint (MyDIGITAL), which promotes digital transformation across logistics and public utilities. Adoption of data-driven service models will improve response times, asset utilization, and regulatory compliance, positioning smart fleet operators at the forefront of a modernized portable sanitation industry.
Expansion of Public-Private Partnerships (PPP) and Regulatory Integration: Government-led sanitation and public cleansing frameworks—particularly under the Solid Waste and Public Cleansing Management Act (Act 672)—will strengthen collaboration between private portable toilet operators and local authorities. Municipal councils and the Ministry of Housing and Local Government (KPKT) are increasingly formalizing partnerships for event sanitation, construction monitoring, and rural waste management. This institutional integration is expected to create stable, long-term contracts for licensed service providers, expand access to regulated disposal sites, and professionalize Malaysia’s portable toilet rental ecosystem in line with environmental and public health standards.
Malaysia Portable Toilet Rental Market Segmentation
By Application
Construction & Infrastructure Projects
Events & Festivals
Tourism & Leisure Sites
Public & Municipal Use
Industrial & Remote Worksites
By Product Type
Standard Single-Cabin Units
VIP / Deluxe Units
Trailer-Mounted Toilets
Modular Multi-Stall Units
Handicap-Accessible Toilets
By Rental Duration
Short-Term Rentals (Daily / Weekly)
Long-Term Rentals (Monthly / Project-Based)
Lease-to-Own / PPP Contracts
By Maintenance Service Level
Full-Service Contracts
Partial-Service / Client-Handled
On-Demand Servicing
Smart-Serviced (IoT-Enabled)
By Region
Central Malaysia (Klang Valley, Selangor, Kuala Lumpur)
Southern Malaysia (Johor, Melaka, Negeri Sembilan)
Northern Malaysia (Penang, Kedah, Perak)
Eastern Malaysia (Sabah & Sarawak)
East Coast (Kelantan, Terengganu, Pahang)
Players Mentioned in the Report:
TOI TOI Services Malaysia
JustToi Sdn Bhd
EnviroAire Sdn Bhd
Veeka Portable Toilet
Portalet Malaysia
Nura Industrial Services
MobileToilet Malaysia
EventToilet Malaysia
BioToilet Malaysia
Ecotech Portable Sanitation
Indah Water Konsortium (PPP / sanitation role)
Malaysia Event Hygiene Solutions
MyToilet Rentals Sdn Bhd
WasteServe Malaysia
CleanEdge Environmental Services
Key Target Audience
Infrastructure developers & large construction firms
Event management and concert / festival organizers
Resort & tourism operators / park developers
State and municipal public works / sanitation agencies (e.g. Ministry of Housing and Local Government – KPKT, local city councils)
Government agencies overseeing remote area infrastructure (e.g. Sabah’s Rural Development Agency, Sarawak Rural Water Supply Department)
Industrial site operators (mining, plantations, oil & gas)
Facility management companies with sanitation divisions
Investment & venture capital firms
Time Period:
Historical Period: 2019-2024
Base Year: 2025
Forecast Period: 2025-2030
Explore Flexible Purchase Options or Have Limited Budget?
Pay only for relevant chapters • Customizable report sections
Table of Contents
Choose individual sections to purchase. Mix and match as you like.
4.1 Delivery Model Analysis (Rental & Servicing Modalities-Full-Service, Partial-Service, Self-Maintained, and PPP)
4.2 Revenue Streams for Malaysia Portable Toilet Rental Market
4.3 Business Model Canvas for Malaysia Portable Toilet Rental Market
5.1 Freelance Operators vs Organized Full-Service Providers
5.2 Investment Model in Malaysia Portable Toilet Rental Industry
5.3 Comparative Analysis of Procurement Processes
5.4 Budget Allocation Patterns by Project Type
8.1 Historical Revenues (Industry-wide, Fleet Utilization Basis)
8.2 Unit Fleet Base Evolution
8.3 Deployment & Rental Duration Statistics
9.1 By Market Structure (In-House vs Outsourced Rental Models)
9.2 By Application (Construction, Events, Tourism, Government, Industrial, Emergency Relief)
9.3 By Unit Type (Standard, VIP, Trailer-Mounted, Modular, Handicap-Accessible)
9.4 By Rental Duration (Short-Term, Long-Term, Lease-to-Own)
9.5 By Maintenance Service Level (Self-Clean, Scheduled, On-Demand, Smart-Serviced)
9.6 By Client Category (Contractors, Municipalities, Event Firms, Resorts, Oil & Gas Sites)
9.7 By Geography (Klang Valley, Johor, Penang, Perak, Sabah, Sarawak)
9.8 By Ownership Pattern (Owned Fleet, Leased Fleet, PPP Units)
10.1 Client Landscape and User Cohorts (Construction, Event, Tourism, Public Works)
10.2 Rental Decision-Making Process (Cost, Hygiene, Delivery Time, Brand Reliability)
10.3 Effectiveness of Rental Services and Hygiene ROI Analysis
10.4 Gap Framework-Client Expectation vs Operator Capability
11.1 Trends and Developments
11.2 Growth Drivers
11.3 SWOT Analysis
11.4 Issues and Challenges
11.5 Government Regulations
12.1 Market Size and Growth Potential for Eco-Friendly Toilets
12.2 Business Model and Revenue Streams
12.3 Smart Servicing (IoT, Remote Fill-Level Monitoring, Route Optimization)
15.1 Market Share of Key Players (Revenue & Fleet Basis)
15.2 Benchmark of Key Competitors (Company Overview, Fleet Size, USP, Business Strategy, Pricing Model, Service Range, Technology Use, Major Clients, Partnerships, Marketing Approach, Recent Developments)
15.3 Operating Model Analysis Framework
15.4 Gartner Magic Quadrant (Leaders, Visionaries, Niche Players, Challengers)
15.5 Bowman’s Strategic Clock for Competitive Advantage (Price vs Value Positioning)
16.1 Forecasted Revenues and Unit Fleet Expansion (Base, Optimistic, Pessimistic Scenarios)
16.2 Forecast Drivers (Infrastructure Projects, Tourism Expansion, PPP Rollouts)
16.3 Scenario Planning and Sensitivity Analysis
17.1 By Market Structure (In-House and Outsourced)
17.2 By Application (Construction, Events, Tourism, Government, Industrial)
17.3 By Unit Type (Standard, VIP, Trailer, Modular, Handicap-Accessible)
17.4 By Rental Duration (Short, Long, Lease-to-Own)
17.5 By Client Category (Contractor, Event, Public, Industrial)
17.6 By Maintenance Level (Self, Scheduled, Smart-Serviced)
17.7 By Region (Peninsular vs East Malaysia)
17.8 By Ownership Pattern (Owned, Leased, PPP)
Discuss a Customized Research Scope
Custom research scope • Tailored insights • Industry expertise
Research Methodology
Step 1: Ecosystem Creation
We begin by mapping the Malaysia Portable Toilet Rental Market ecosystem, identifying all key demand-side and supply-side entities that define the market’s operational flow. On the demand side, the ecosystem includes large construction and infrastructure contractors, event organizers, government departments (notably KPKT, local municipal councils, and public works authorities), tourism operators, and industrial site developers. On the supply side, we categorize portable toilet rental operators, equipment manufacturers and importers, waste management firms (e.g., Indah Water Konsortium), logistics providers, cleaning chemical suppliers, and disposal facility operators. Using this mapped ecosystem, we shortlist 5–6 leading operators—such as TOI TOI Services Malaysia, EnviroAire Sdn Bhd, JustToi Sdn Bhd, and Veeka Portable Toilet Sdn Bhd—based on fleet size, operational footprint, clientele base, and regional presence. Sourcing is carried out through government databases (e.g., DOSM, MOF, Tourism Malaysia), industry articles, and proprietary research archives to collate baseline operational, regulatory, and infrastructure-level data for market quantification.
Step 2: Desk Research
We then conduct comprehensive desk research utilizing both secondary and proprietary databases to assemble market intelligence. This involves analyzing variables such as total rental fleet volume, utilization ratios, average rental days, disposal capacity, and regional demand dispersion. Data sources include Department of Statistics Malaysia (DOSM) for construction activity, Tourism Malaysia for event and visitor flows, IWK Sustainability Reports for effluent handling metrics, and KPKT/DOE portals for licensing and regulatory data. At the company level, we examine public domain materials including press releases, tender documents, corporate filings, and annual financial summaries where available. This enables a granular understanding of operator-level revenue models, pricing per unit-day, service add-ons (cleaning, vacuum, handwash), and route optimization practices. This process constructs the foundational market model and highlights regional disparities in supply and demand within Peninsular and East Malaysia.
Step 3: Primary Research
Following the desk study, in-depth primary interviews are conducted with senior stakeholders—managing directors, operations heads, logistics managers, and municipal sanitation officers—from portable toilet operators and associated service firms. This stage validates hypotheses built in desk research, confirming utilization levels, service margins, and pricing brackets across diverse project scales. We employ a bottom-up approach, aggregating company-level revenues and fleet deployment data to estimate the total market value. To ensure data integrity, disguised validation interviews are conducted under the pretext of potential client inquiries, allowing us to cross-check on-ground operational and financial disclosures with secondary evidence. Insights gathered encompass route optimization practices, frequency of servicing cycles, maintenance cost structures, and fleet renewal timelines, which collectively refine market sizing and competitive positioning models.
Step 4: Sanity Check
The final phase involves a sanity check using both top-down and bottom-up triangulation techniques to validate the overall market model. From the top-down side, we benchmark national construction and tourism metrics (e.g., RM158.8 billion construction output, 37.9 million tourist arrivals) against toilet fleet utilization estimates to gauge total potential rentals. The bottom-up side consolidates verified company-level data on fleet size, rental pricing, and servicing frequency. We reconcile discrepancies through iterative modeling to achieve convergence between the two approaches, ensuring internal consistency and robustness of final market estimates. This dual-validation framework confirms the reliability of our Malaysia Portable Toilet Rental Market sizing and segmentation outcomes.
See What's Inside the Report
Get a preview of key findings, methodology and report coverage
Frequently Asked Questions
The Malaysia Portable Toilet Rental Market holds strong growth potential, backed by the nation’s expanding infrastructure, tourism recovery, and hygiene compliance mandates. With the construction sector generating RM158.8 billion in value of work done (Department of Statistics Malaysia) and RM90 billion allocated for federal development expenditure (Ministry of Finance), recurring demand for mobile sanitation services across worksites, events, and remote locations is expected to persist. The market’s potential is further reinforced by Malaysia’s 37.9 million tourist arrivals and increasing emphasis on sustainable waste management under national environmental and sanitation frameworks.
The Malaysia Portable Toilet Rental Market features several leading players, including TOI TOI Services Malaysia, JustToi Sdn Bhd, and EnviroAire Sdn Bhd, all known for their large rental fleets and nationwide servicing networks. These companies dominate through established relationships with construction firms, event organizers, and municipal bodies. Other notable operators include Veeka Portable Toilet Sdn Bhd, Portalet Malaysia, Nura Industrial Services, and Ecotech Portable Sanitation, which collectively contribute to expanding market coverage across Peninsular and East Malaysia.
Key growth drivers include macroeconomic expansion, large-scale infrastructure investments, and rising tourism activity. Malaysia’s GDP stands at USD 444.98 billion (IMF WEO), creating strong fiscal capacity for public and private construction. The Department of Statistics Malaysia recorded RM158.8 billion in construction value, providing steady site-level demand for portable sanitation. Additionally, Tourism Malaysia reports RM106.8 billion in visitor receipts, underscoring growing event- and travel-related hygiene needs. Increasing regulatory enforcement under the Solid Waste and Public Cleansing Management Act (Act 672) further drives adoption of licensed, compliant portable toilet services nationwide.
The market faces multiple operational and regulatory challenges. Geographical dispersion, with Sabah and Sarawak spanning over 198,000 km², inflates transportation and maintenance costs for operators serving remote areas. Monsoon-season rainfall exceeding 400 mm per month in certain states (MetMalaysia) disrupts servicing schedules and access to event or project sites. Additionally, strict disposal compliance under the Water Services Industry Act (Act 655) and Environmental Quality (Sewage) Regulations 2009 requires coordination with Indah Water Konsortium’s 7,000+ treatment plants, adding complexity and cost to waste logistics while maintaining regulatory standards.
License Options
PDF + Excel
Complete report package
$4,000
Excel Only
Data and analytics
$2,500
Custom Sections
Starts from $100
$0