Malaysia Used Car Market Outlook to 2029
By Market Structure, By Manufacturers, By Types of KMs Driven, By Age of Vehicles, By Age of Consumers and By Region
Report Overview
Report Code
TDR0032
Coverage
Asia
Published
September 2024
Pages
80-100
Flexible Purchase Options
Select and purchase only the chapters you need for your strategic decisions
On This Page
Report Overview
The report titled “Malaysia Used Car Market Outlook to 2029 - By Market Structure, By Manufacturers, By Types of KMs Driven, By Age of Vehicles, By Age of Consumers and By Region.” provides a comprehensive analysis of the used car market in Malaysia. The report covers an overview and genesis of the industry, overall market size in terms of revenue, market segmentation; trends and developments, regulatory landscape, customer level profiling, issues and challenges, and comparative landscape including competition scenario, cross comparison, opportunities and bottlenecks, and company profiling of major players in the Used Car Market.
Report Coverage
Verified Market Sizing
Multi-layer forecasting with historical data and 5–10 year outlook
Deep-Dive Segmentation
Cross-sectional analysis by product type, end user, application and region
Competitive Benchmarking & Positioning
Market share, operating model, pricing and competition matrices
Actionable Insights & Risk Assessment
High-growth white spaces, underserved segments, technology disruptions and demand inflection points
Review Methodology & Data Structure
Preview report structure, data sources and research framework
Executive Summary
The report titled “Malaysia Used Car Market Outlook to 2029 - By Market Structure, By Manufacturers, By Types of KMs Driven, By Age of Vehicles, By Age of Consumers and By Region.” provides a comprehensive analysis of the used car market in Malaysia. The report covers an overview and genesis of the industry, overall market size in terms of revenue, market segmentation; trends and developments, regulatory landscape, customer level profiling, issues and challenges, and comparative landscape including competition scenario, cross comparison, opportunities and bottlenecks, and company profiling of major players in the Used Car Market. The report concludes with future market projections based on sales revenue, by market, product types, region, cause and effect relationship, and success case studies highlighting the major opportunities and cautions.
Malaysia Used Car Market Overview and Size
The Malaysia used car market reached a valuation of MYR 12 Billion in 2023, driven by the increasing demand for affordable vehicles, growing population, and changing consumer preferences towards more cost-effective transportation solutions. The market is characterized by major players such as Mudah.my, Carlist.my, Carsome, myTukar, and Sime Darby Auto Selection. These companies are recognized for their extensive distribution networks, diverse vehicle offerings, and customer-focused services.
In 2023, Carsome launched a new online platform to enhance customer experience and streamline the purchase process for used cars. This initiative aims to tap into the growing digital market in Malaysia and provide a more convenient car-buying experience. Kuala Lumpur and Penang are key markets due to their high population density and robust automotive infrastructure.
Market Size for Malaysia Used Car Industry on the Basis of Volume Sales in Units, 2018-2023
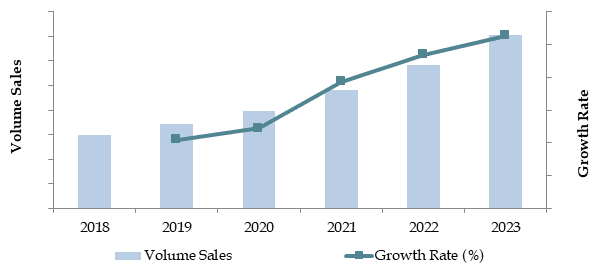
Source: TraceData Research Analysis
What Factors are Leading to the Growth of Malaysia Used Car Market:
Economic Factors: The economic downturn and the high prices of new cars have significantly shifted consumer preference towards used cars. In 2023, used cars accounted for approximately 65% of total car sales in Malaysia, as they offer cost savings of up to 40% compared to new vehicles. This trend is particularly pronounced among budget-conscious buyers who are looking to minimize expenses.
Growing Middle Class: The expanding middle class, with limited disposable income, is increasingly opting for used cars as a viable alternative to new vehicles. In recent years, the middle-income population in Malaysia has grown by 12%, and this demographic shift has driven demand for affordable and reliable transportation solutions. Used cars provide an accessible entry point to car ownership for many in this income bracket.
Digitalization: The rise of online marketplaces has revolutionized the way consumers purchase used cars, enhancing transparency and convenience. In 2023, around 40% of used car transactions in Malaysia were conducted online, reflecting a growing trend towards digital channels. These platforms offer comprehensive vehicle listings, price comparisons, and customer reviews, which have significantly boosted market growth by making the buying process more accessible and user-friendly.
Which Industry Challenges Have Impacted the Growth for Malaysia Used Car Market
Quality and Trust Issues: Concerns about the quality and condition of used cars remain significant challenges. According to a recent industry survey, approximately 50% of consumers are hesitant to purchase used cars due to fears of hidden defects and a lack of transparent vehicle histories. This issue has led to a lower trust level among buyers, potentially deterring up to 22% of prospective purchasers.
Regulatory Hurdles: Stringent regulations concerning vehicle inspections and emissions standards can limit the availability of certain older or high mileage used cars. In 2023, it was reported that around 20% of used cars offered in the market failed to pass the mandatory inspection standards. These regulations can impose significant costs, particularly on smaller dealerships and private sellers, making it challenging for them to comply.
Financing and Credit Access: Limited access to financing and credit options is a critical barrier in the used car sector, particularly affecting lower-income consumers. Data indicates that approximately 38% of potential buyers face difficulties in securing financing for used car purchases. This limitation not only restricts market access for a significant segment of the population but also constrains overall market growth.
What are the Regulations and Initiatives which have Governed the Market:
Vehicle Inspection Regulations: The Malaysian government mandates regular vehicle inspections to ensure that used cars meet specific safety and environmental standards. These inspections are required annually and focus on critical aspects such as brakes, lights, and emissions. In 2022, approximately 75% of used cars passed the inspection on their first attempt, indicating a significant compliance level among vehicles in the market.
Import Restrictions on Used Cars: The government enforces strict regulations on the importation of used cars, including a maximum age limit of 5 years for most vehicles. Additionally, all imported vehicles must comply with the ASEAN safety and emissions criteria. In 2023, imports of used cars dropped by 8% due to stricter enforcement of these regulations.
Government Incentives for Electric Vehicles: To promote the adoption of electric vehicles (EVs), the Malaysian government has introduced various incentives, including reduced import duties, tax exemptions, and subsidies. These incentives are particularly aimed at encouraging the entry of used electric cars into the market. In 2023, EVs represented about 3% of the total used car sales, a number expected to grow as these incentives take effect.
Malaysia Used Car Market Segmentation
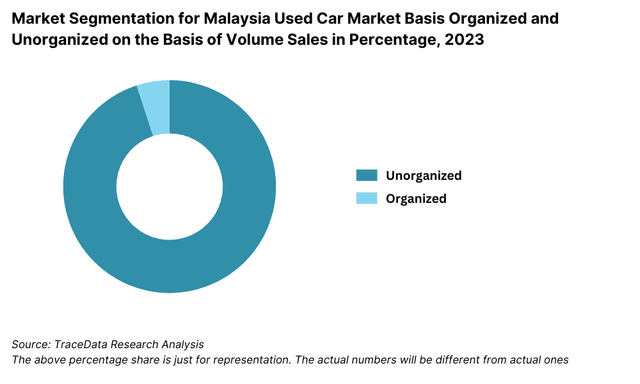
By Market Structure: Local dealers dominate the market due to their strong presence in communities, established trust with customers, and ease of accessibility. They often provide personalized services, flexible financing options, and better understanding of local market needs. OEM Certified Dealers hold a significant share because they offer certified pre-owned vehicles that come with warranties and have undergone rigorous quality checks. This assurance of quality and reliability attracts consumers willing to pay a premium for peace of mind.
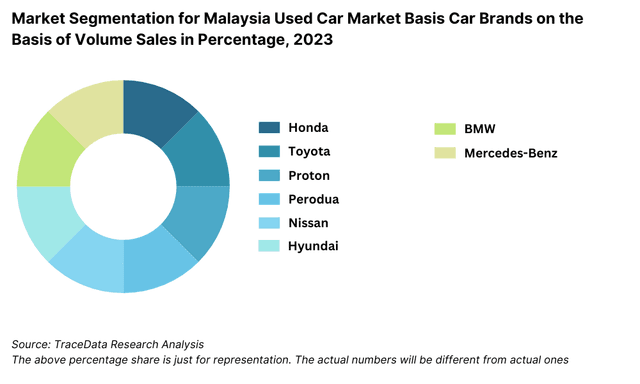
By Manufacturer: Toyota is the leading manufacturer in the used car market due to its strong reputation for reliability, extensive service network, and high resale value. The brand loyalty and trust among consumers make Toyota the preferred choice. Honda follows closely due to its well-known durability, fuel efficiency, and a strong reputation for producing reliable vehicles. Honda's extensive dealer network and good resale value also contribute to its popularity.
By Mileage: 50,000-80,000 KM mileage range offer a balance between price and remaining lifespan. They are perceived as having reasonable wear and tear, making them a cost-effective choice for many buyers
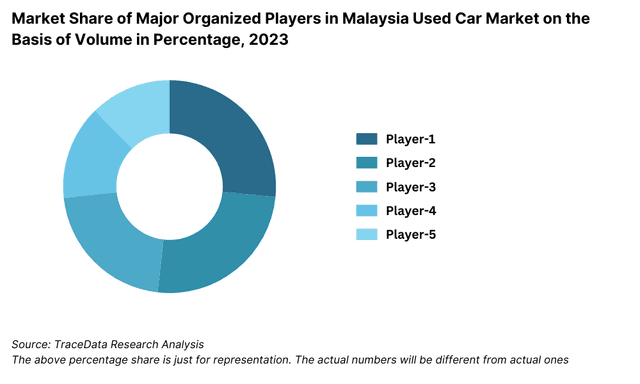
Competitive Landscape in Malaysia Used Car Market
The Malaysia used car market is relatively concentrated, with a few major players dominating the space. However, the entrance of new firms and the expansion of online platforms such as Mudah.my, Carlist.my, Carsome, myTukar, Sime Darby Auto Selection, Carizarz, MT Digital, Carcity have diversified the market, offering consumers more choices and services.
Company | Establishment Year | Headquarters |
Mudah.my | 2007 | Kuala Lumpur, Malaysia |
Carlist.my | 2009 | Kuala Lumpur, Malaysia |
Carsome | 2015 | Kuala Lumpur, Malaysia |
myTukar | 2018 | Kuala Lumpur, Malaysia |
| Sime Darby Auto Selection | 1910 | Kuala Lumpur, Malaysia |
Some of the recent competitor trends and key information about competitors include:
Mudah.my: As one of the leading online marketplaces in Malaysia, Mudah.my recorded over 6 million monthly visitors in 2023, marking a 20% increase in user engagement compared to the previous year. The platform’s extensive vehicle listings and comparison tools have made it a go-to resource for car buyers in Malaysia.
Carlist.my: A popular online automotive marketplace, Carlist.my saw a 30% increase in sales of certified pre-owned vehicles in 2023. The platform's focus on providing detailed vehicle histories and customer reviews has been well received by buyers looking for transparency and reliability.
Carsome: Known for its comprehensive inspection and certification process, Carsome reported a 25% growth in used car sales in 2023. The company's emphasis on providing a seamless online-to-offline buying experience has contributed to its strong market position.
myTukar: Specializing in facilitating quick and hassle-free used car transactions, myTukar saw a 15% increase in sales in urban centers like Kuala Lumpur and Penang. The company’s innovative auction-based model has been particularly successful in attracting budget-conscious buyers.
Sime Darby Auto Selection: The automotive division of Sime Darby Berhad sold around 10,000 used vehicles in 2023, with a significant portion coming from their enhanced digital sales channels. The group's focus on integrating online and offline sales experiences has helped increase customer convenience and overall sales volume.
What Lies Ahead for Malaysia Used Car Market?
The Malaysia used car market is projected to grow steadily by 2029, exhibiting a respectable CAGR during the forecast period. This growth is expected to be fueled by economic factors, increasing urbanization, and rising consumer confidence in the used car market.
Shift Towards Electric Vehicles: As the Malaysian government continues to promote green energy initiatives, there is anticipated to be a gradual increase in both the availability and demand for electric used cars. This trend is supported by government incentives and a growing consumer awareness of environmental sustainability.
Integration of Technology: The integration of advanced technologies such as AI and big data analytics in vehicle assessment and pricing processes is expected to provide consumers with more accurate and transparent information. This technological advancement will enhance market transparency, boost consumer trust, and streamline the buying process, making it more efficient and user-friendly.
Growth of Certified Pre-Owned (CPO) Programs: The market is seeing a growing trend towards certified pre-owned programs, where used cars undergo rigorous inspections and come with extended warranties. This trend is particularly strong among premium and luxury car segments, catering to consumers who seek assurance and quality in their purchases. The increasing availability of CPO vehicles is expected to attract more buyers who prioritize reliability and post-purchase support.
Focus on Sustainable Practices: There is a rising trend towards sustainable practices within the used car industry. This includes initiatives such as eco-friendly dealerships, the use of recycled materials in vehicle refurbishments, and efforts to offset carbon emissions associated with vehicle sales and usage. These practices are becoming more important to environmentally conscious consumers and are expected to influence buying decisions.
Future Outlook and Projections for Malaysia Used Car Market on the Basis of Volume Sales in Units, 2024-2029
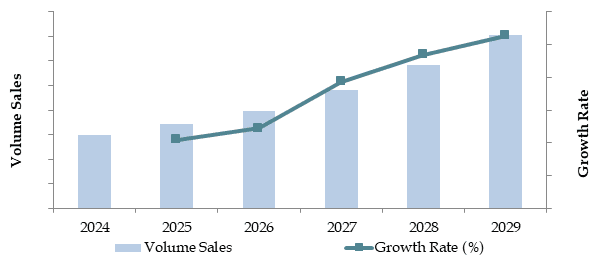
Source: TraceData Research Analysis
Malaysia Used Car Market Segmentation
By Market Structure:
Auction Companies
C2C, Local Dealers
Multi-Brand Non-Franchise Dealerships
OEM Certified Dealers
Organized Sector
Unorganized Sector
Commercial Vehicles
By Manufacturer:
Honda
Toyota
Proton
Perodua
Nissan
Hyundai
BMW
Mercedes-Benz
By Type of KMs Driven:
<50,000
150,000
50,000-80,000
80,000-150,000
By Age of Vehicle:
5 years
1-2 years
3-5 years
By Age of Consumer:
18-34
35-54
55+
By Region:
Northern
Southern
Central
Western
Eastern
Players Mentioned in the Report:
Mudah.my
Carlist.my
Carsome
myTukar
Sime Darby Auto Selection
Caricarz
MT Digital
Carcity
Key Target Audience:
Used Car Dealers
Online Car Marketplaces
Automotive Financing Companies
Regulatory Bodies (e.g., Ministry of International Trade and Industry)
Research and Development Institutions
Time Period:
Historical Period: 2018-2023
Base Year: 2024
Forecast Period: 2024-2029
Explore Flexible Purchase Options or Have Limited Budget?
Pay only for relevant chapters • Customizable report sections
Table of Contents
Choose individual sections to purchase. Mix and match as you like.
4.1. Value Chain Process-Role of Entities, Stakeholders, and challenges that they face.
4.2. Revenue Streams for Malaysia Used Car Market
4.3. Business Model Canvas for Malaysia Used Car Market
4.4. Buying Decision Making Process
4.5. Supply Decision Making Process
5.1. New Car Sales in Malaysia, 2018-2024
5.2. New: Used Car Ratio in Malaysia, 2018-2024
5.3. Spend on Public Transportation in Malaysia, 2024
5.4. Number of Used Car Dealers in Malaysia by Location
8.1. Revenues, 2018-2024
8.2. Sales Volume, 2018-2024
9.1. By Market Structure (Organized and Unorganized Market), 2023-2024P
9.2. By Origin of Sale for Organized Dealers (Multi-Brand Dealers, Bank Repossessed Cars, and OEM Organized), 2023-2024P
9.3. By Average Ticket Size, 2023-2024P
9.4. By Region, 2023-2024P
9.5. By Type of Vehicle (Sedan, SUV, Hatchback, Pickup Vans, MPV/AUV, and Others), 2023-2024P
9.6. By Type of Fuel (Gasoline, Diesel, Hybrid, and Electric), 2023-2024P
9.7. By Brand (Toyota, Mitsubishi, Hyundai, Ford, Nissan, Honda, Isuzu, Suzuki, and Others), 2023-2024P
9.8. By Average Replacement Period (0-2 years, 3-4 years, 5-6 years, 6-8 years, and above 8 years), 2023-2024P
9.9. By Mileage (Less than 10k, 10k-20k, 20k-50k, 50k-75k, 75k-100k, Above 100k Kms), 2023-2024P
10.1. Customer Landscape and Cohort Analysis
10.2. Customer Journey and Decision Making
10.3. Need, Desire, and Pain Point analysis
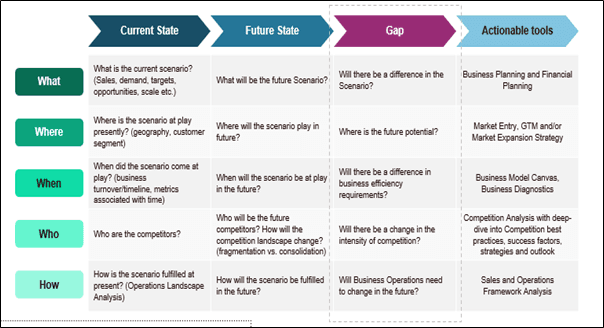
10.4. Gap Analysis Framework
10.5. Detailed Used Car Sales Analysis by Region-State-Brand
11.1. Industry Analysis
11.2. Growth Drivers for Malaysia Used Car Market
11.3. SWOT Analysis for Malaysia Used Car Market
11.4. Issues and Challenges for Malaysia Used Car Market
11.5. Government Regulations for Malaysia Used Car Market
12.1. Market Size and Future Potential for Online B2C and C2B used car market based on transactions, 2018-2029
12.2. Business Model and Revenue Streams
12.3. Cross comparison of leading online used car Companies basis Company Overview, Revenue Streams, Revenues, Used Car Sales, Operating Cities, Number of Centers, Sourcing and other variables
13.1. Finance penetration Rate and Average Down Payment for Used Cars, 2018-2029
13.2. How the finance penetration rates are changing over the years with reasons
13.3. Type of Car Segment for which Finance Penetration is higher
13.4. Used Car Finance split by Banks/NBFCs/Private Finance companies and Captive Entities, 2023-2024P
13.5. Average Used Car Finance Tenure in Malaysia
13.6. Finance Disbursement for Used Car in Malaysia, 2018-2024P
16.1. Benchmark of Key Competitors in Malaysia Used Car Market including variables such as Company Overview, USP, Business Strategies, Strength, Weakness, Business Model, Marketing Strategy, Global Operations, Pre-Owned Car Sales by Volume, Recent Development, Sourcing, Number of Stores by Cities and Value-Added Services
16.2. Strength and Weakness
16.3. Operating Model Analysis Framework
16.4. Gartner Magic Quadrant
16.5. Bowmans Strategic Clock for Competitive Advantage
17.1. Revenues, 2025-2029
17.2. Sales Volume, 2025-2029
18.1. By Market Structure (Organized and Unorganized Market), 2025-2029
18.2. By Origin of Sale for Organized Dealers (Multi-Brand Dealers, Bank Repossessed Cars, and OEM Organized), 2025-2029
18.3. By Average Ticket Size, 2025-2029
18.4. By Region, 2025-2029
18.5. By Type of Vehicle (Sedan, SUV, Hatchback, Pickup Vans, MPV/AUV, and Others), 2025-2029
18.6. By Type of Fuel (Gasoline, Diesel, Hybrid, and Electric), 2025-2029
18.7. By Brand (Toyota, Mitsubishi, Hyundai, Ford, Nissan, Honda, Isuzu, Suzuki, and Others), 2025-2029
18.8. By Average Replacement Period (0-2 years, 3-4 years, 5-6 years, 6-8 years, and above 8 years), 2025-2029
18.9. By Mileage (Less than 10k, 10k-20k, 20k-50k, 50k-75k, 75k-100k, Above 100k Kms), 2025-2029
Discuss a Customized Research Scope
Custom research scope • Tailored insights • Industry expertise
Research Methodology
Step 1: Ecosystem Creation
Map the ecosystem and identify all the demand side and supply side entities for Malaysia Used Car Market. Basis this ecosystem, we will shortlist leading 5-6 producers in the country based upon their financial information, production capacity/volume.
Sourcing is made through industry articles, multiple secondary, and proprietary databases to perform desk research around the market to collate industry-level information.
Step 2: Desk Research
Subsequently, we engage in an exhaustive desk research process by referencing diverse secondary and proprietary databases. This approach enables us to conduct a thorough analysis of the market, aggregating industry-level insights. We delve into aspects like the sales revenues, number of market players, price level, demand, and other variables. We supplement this with detailed examinations of company-level data, relying on sources like press releases, annual reports, financial statements, and similar documents. This process aims to construct a foundational understanding of both the market and the entities operating within it.
Step 3: Primary Research
We initiate a series of in-depth interviews with C-level executives and other stakeholders representing various Malaysia Used Car Market companies and end-users. This interview process serves a multi-faceted purpose: to validate market hypotheses, authenticate statistical data, and extract valuable operational and financial insights from these industry representatives. Bottom to top approach is undertaken to evaluate volume sales for each player thereby aggregating to the overall market.
As part of our validation strategy, our team executes disguised interviews wherein we approach each company under the guise of potential customers. This approach enables us to validate the operational and financial information shared by company executives, corroborating this data against what is available in secondary databases. These interactions also provide us with a comprehensive understanding of revenue streams, value chain, process, pricing, and other factors.
Step 4: Sanity Check
- Bottom to top and top to bottom analysis along with market size modeling exercises is undertaken to assess sanity check process.
See What's Inside the Report
Get a preview of key findings, methodology and report coverage
Frequently Asked Questions
The Malaysia used car market is poised for substantial growth, reaching a valuation of MYR 12 Billion in 2023. This growth is driven by factors such as the increasing demand for affordable transportation, a growing middle class, and the shift towards more cost-effective vehicle options. The market's potential is further bolstered by the expanding digital landscape, which facilitates easier access to a wide range of used vehicles.
The Malaysia Used Car Market features several key players, including Mudah.my, Carlist.my, and Carsome. These companies dominate the market due to their extensive distribution networks, strong brand presence, and diverse vehicle offerings. Other notable players include myTukar and Sime Darby Auto Selection.
The primary growth drivers include economic factors, such as the high cost of new cars and economic downturns, which make used cars a more attractive option. The expanding middle class in Malaysia, combined with increased urbanization, also contributes to the growing demand for used cars. Additionally, the rise of digital platforms has made it easier for consumers to access a wider selection of vehicles, enhancing Malaysia Used Car Market growth.
The Malaysia Used Car Market faces several challenges, including quality and trust issues related to the condition and history of used vehicles. Regulatory challenges, such as stringent vehicle inspection and emission standards, can also impact the availability of older models. Additionally, infrastructure challenges, including inadequate dealership networks and the need for improved after-sales services, pose significant barriers to market growth.
License Options
PDF + Excel
Complete report package
$4,000
Excel Only
Data and analytics
$2,500
Custom Sections
Starts from $100
$0