Malaysia Warehousing Market Outlook to 2035
By Warehouse Type, By End-Use Industry, By Temperature Control, By Ownership Model, and By Region
Report Overview
Report Code
TDR0493
Coverage
Asia
Published
January 2026
Pages
80
Flexible Purchase Options
Select and purchase only the chapters you need for your strategic decisions
On This Page
Report Overview
The report titled “Malaysia Warehousing Market Outlook to 2035 – By Warehouse Type, By End-Use Industry, By Temperature Control, By Ownership Model, and By Region” provides a comprehensive analysis of the warehousing industry in Malaysia. The report covers an overview and genesis of the market, overall market size in terms of value, detailed market segmentation; trends and developments, regulatory and compliance landscape, buyer-level demand profiling, key issues and challenges, and competitive landscape including competition scenario, cross-comparison, opportunities and bottlenecks, and company profiling of major players in the Malaysia warehousing market.
Report Coverage
Verified Market Sizing
Multi-layer forecasting with historical data and 5–10 year outlook
Deep-Dive Segmentation
Cross-sectional analysis by product type, end user, application and region
Competitive Benchmarking & Positioning
Market share, operating model, pricing and competition matrices
Actionable Insights & Risk Assessment
High-growth white spaces, underserved segments, technology disruptions and demand inflection points
Review Methodology & Data Structure
Preview report structure, data sources and research framework
Executive Summary
The report titled “Malaysia Warehousing Market Outlook to 2035 – By Warehouse Type, By End-Use Industry, By Temperature Control, By Ownership Model, and By Region” provides a comprehensive analysis of the warehousing industry in Malaysia. The report covers an overview and genesis of the market, overall market size in terms of value, detailed market segmentation; trends and developments, regulatory and compliance landscape, buyer-level demand profiling, key issues and challenges, and competitive landscape including competition scenario, cross-comparison, opportunities and bottlenecks, and company profiling of major players in the Malaysia warehousing market.
The report concludes with future market projections based on trade and manufacturing activity, e-commerce penetration, regional logistics corridor development, cold chain expansion, public and private infrastructure investments, regional demand drivers, cause-and-effect relationships, and case-based illustrations highlighting the major opportunities and cautions shaping the market through 2035.
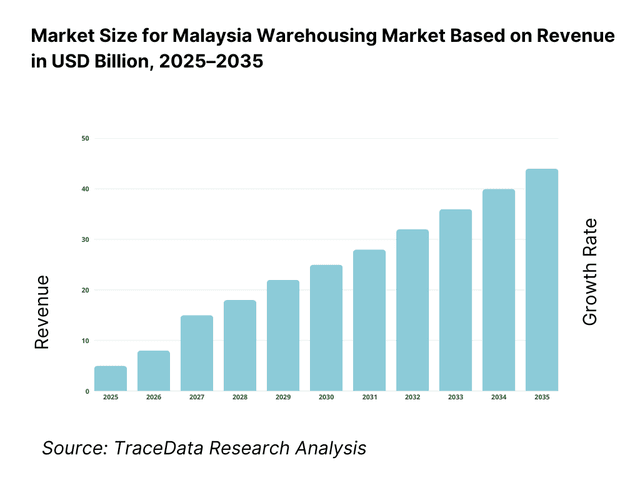
Malaysia Warehousing Market Overview and Size
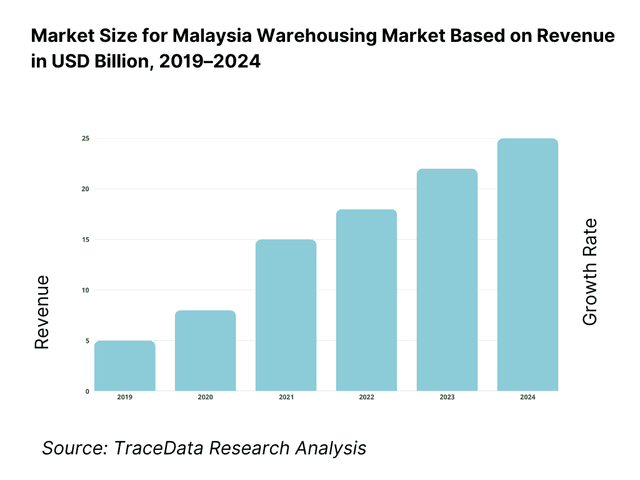
The Malaysia warehousing market is valued at approximately ~USD ~ billion, representing the supply of storage, handling, and value-added logistics infrastructure supporting domestic distribution and international trade flows. Warehousing facilities in Malaysia range from conventional dry storage warehouses to modern grade-A logistics parks, bonded warehouses, temperature-controlled facilities, and specialized warehouses serving sectors such as electronics, automotive, food & beverages, pharmaceuticals, chemicals, and e-commerce fulfillment.
The market is anchored by Malaysia’s strategic geographic location within Southeast Asia, strong port-led trade activity, export-oriented manufacturing base, and rising domestic consumption. Warehousing demand is closely linked to container throughput at major ports, cross-border trade with neighboring countries, and the growth of organized retail and digital commerce platforms. As supply chains evolve toward faster turnaround times, inventory decentralization, and higher service reliability, warehousing has transitioned from a passive storage function to an active logistics enabler.
The Klang Valley represents the largest concentration of warehousing demand in the country, driven by proximity to ports, airports, industrial clusters, and end-consumer markets. Johor has emerged as a high-growth logistics zone due to its integration with Singapore-linked supply chains and industrial parks. Northern regions led by Penang remain structurally important for electronics and semiconductor-driven warehousing demand, while East Malaysia shows selective growth linked to commodities, palm oil, and regional distribution needs.
What Factors are Leading to the Growth of the Malaysia Warehousing Market
Expansion of trade-led logistics and port-centric distribution strengthens structural demand: Malaysia continues to benefit from its role as a regional trade and transshipment hub, supported by major seaports and well-developed logistics corridors. Warehousing demand is directly driven by containerized cargo flows, import-export handling, and inland distribution requirements. Bonded warehouses, free commercial zone facilities, and port-adjacent logistics parks play a critical role in supporting manufacturers, traders, and third-party logistics providers seeking efficient cargo staging, consolidation, and redistribution. As trade volumes grow and supply chains become more time-sensitive, the need for professionally managed warehousing infrastructure increases structurally.
Growth of e-commerce and omni-channel retail accelerates demand for modern fulfillment facilities: Rising internet penetration, digital payment adoption, and changing consumer behavior have accelerated e-commerce growth across Malaysia. This has driven demand for strategically located fulfillment centers, sortation hubs, and last-mile distribution warehouses capable of handling high order volumes, rapid turnaround times, and returns processing. E-commerce players increasingly favor modern warehouses with higher clear heights, optimized layouts, automation readiness, and integrated warehouse management systems. This shift is steadily upgrading the quality and specification profile of new warehousing supply entering the market.
Manufacturing activity and regional supply chain diversification support steady warehouse absorption: Malaysia’s export-oriented manufacturing sectors—including electronics, electrical equipment, automotive components, and food processing—continue to generate consistent warehousing demand for raw materials, work-in-progress inventory, and finished goods storage. As multinational manufacturers diversify supply chains within Southeast Asia, Malaysia remains an attractive production and distribution base due to its infrastructure quality and logistics connectivity. Warehouses supporting manufacturing are increasingly designed to accommodate just-in-time operations, vendor-managed inventory models, and integrated value-added services such as packaging, labeling, and light assembly.
Which Industry Challenges Have Impacted the Growth of the Malaysia Warehousing Market:
Land availability constraints and rising industrial land costs impact warehouse development economics: Warehousing growth in Malaysia is increasingly constrained by limited availability of suitably zoned industrial land in high-demand logistics corridors such as port-adjacent zones, Klang Valley, and cross-border trade regions. Competition from manufacturing plants, data centers, and mixed-use developments has driven up land acquisition and long-term lease costs, directly affecting warehouse project feasibility and rental affordability. For developers and operators, higher land costs increase capital intensity and lengthen payback periods, while for occupiers, rising rentals can reduce the economic attractiveness of centralized warehousing strategies. These pressures are particularly acute for large-format distribution centers and cold storage facilities that require expansive land parcels and specific zoning approvals.
Labor availability and rising operating costs create execution and scalability challenges: Although warehousing is less labor-intensive than manufacturing, efficient warehouse operations depend on skilled manpower for inventory management, material handling equipment operation, quality control, and value-added services. Malaysia’s logistics sector faces tightening labor availability, rising wage expectations, and increasing reliance on foreign workers, all of which elevate operating costs. Labor shortages can limit throughput capacity, affect service-level commitments, and reduce the flexibility of warehouse operators during demand peaks. While automation and digital warehouse management systems offer partial mitigation, adoption remains uneven due to capital cost considerations, especially among small and mid-sized operators.
Fragmented infrastructure quality and aging warehouse stock reduce operational efficiency: A significant portion of Malaysia’s existing warehouse stock consists of older facilities with limited clear heights, sub-optimal dock configurations, inadequate fire safety systems, and restricted scope for automation or temperature control upgrades. These facilities struggle to meet the evolving requirements of modern supply chains, particularly for e-commerce, pharmaceuticals, and high-value manufacturing goods. Retrofitting older warehouses is often constrained by structural limitations and regulatory compliance costs, leading some occupiers to accept operational inefficiencies rather than relocate. This structural mismatch between demand for modern warehousing and the availability of compliant, high-specification facilities can slow effective market expansion.
What are the Regulations and Initiatives which have Governed the Market:
Zoning regulations, local authority approvals, and industrial land use policies shaping warehouse development: Warehousing facilities in Malaysia are subject to zoning classifications, land-use approvals, and development controls governed by local authorities and state planning frameworks. These regulations determine permissible warehouse locations, plot ratios, building heights, traffic access, and environmental buffers. In logistics-intensive regions, approval timelines and compliance requirements can materially affect project schedules and cost structures. Developers must navigate multi-layered approval processes involving municipal councils, planning departments, and utility providers, which can introduce uncertainty into warehouse project execution and delay capacity additions in high-demand zones.
Customs regulations, bonded warehouse frameworks, and free zone policies influencing trade-linked warehousing: Bonded warehouses and facilities operating within free commercial zones are regulated under customs supervision, with requirements related to inventory tracking, reporting, security controls, and periodic audits. These frameworks are critical for supporting Malaysia’s role in international trade and transshipment, but they also impose compliance and documentation obligations on warehouse operators. For companies engaged in import-export activities, adherence to customs regulations directly influences warehouse design, IT systems, and operational processes. While these regulations support trade facilitation and revenue protection, they can increase administrative complexity and operating costs for warehousing providers.
Food safety, pharmaceutical distribution, and cold chain compliance standards governing specialized storage: Temperature-controlled warehouses supporting food, beverage, and pharmaceutical supply chains must comply with sector-specific regulations related to hygiene, traceability, temperature integrity, and handling protocols. Compliance with food safety standards and Good Distribution Practices (GDP) requires investment in monitoring systems, backup power, validated processes, and trained personnel. Regulatory scrutiny in these segments is increasing as supply chains become more formalized and export oriented. While these standards enhance service quality and risk management, they also raise entry barriers and capital requirements, influencing competitive dynamics within the warehousing market.
Malaysia Warehousing Market Segmentation
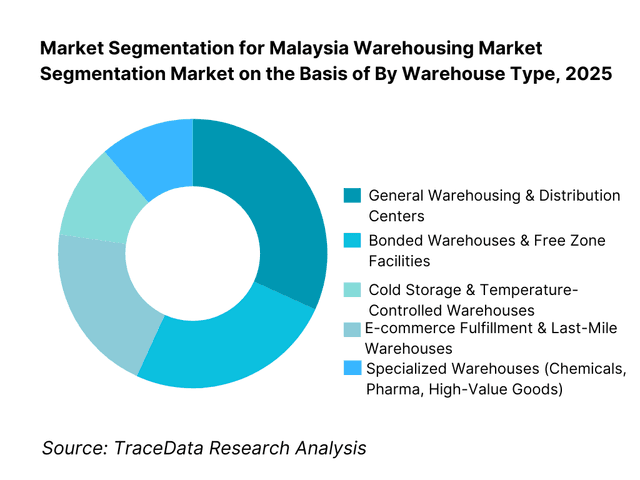
By Warehouse Type: The general warehousing and distribution center segment holds dominance in the Malaysia warehousing market. This is because Malaysia’s logistics demand is fundamentally trade- and manufacturing-led, with strong requirements for ambient storage, cross-docking, inventory staging, and regional distribution. General warehouses and distribution centers support import-export flows, domestic consumption, and industrial supply chains while offering flexible layouts, scalable floor plates, and cost-efficient operations. While cold storage, bonded warehouses, and fulfillment centers are expanding rapidly, general warehousing continues to benefit from volume-driven demand, broad end-use applicability, and sustained absorption across logistics corridors.
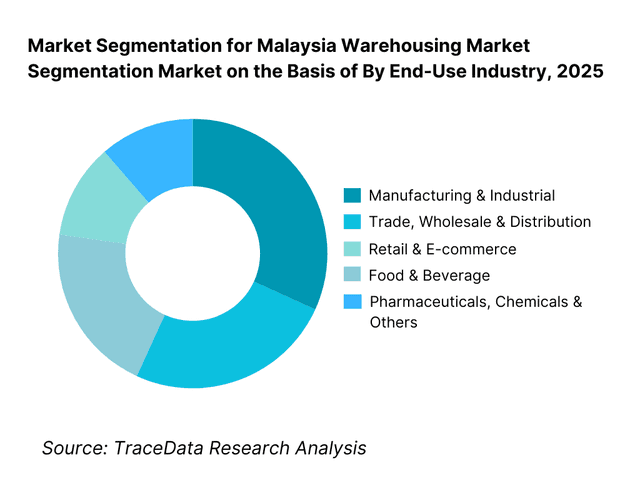
By End-Use Industry: Manufacturing and trade-linked industries dominate the Malaysia warehousing market. Export-oriented manufacturing sectors such as electronics, electrical equipment, automotive components, and consumer goods rely heavily on warehousing for raw materials, work-in-progress storage, and finished goods staging. Retail and e-commerce are rapidly increasing their share as inventory decentralization, faster delivery expectations, and omni-channel strategies gain traction. Food and beverages, pharmaceuticals, and chemicals continue to expand steadily, driven by regulatory compliance, cold chain requirements, and rising domestic consumption.
Competitive Landscape in Malaysia Warehousing Market
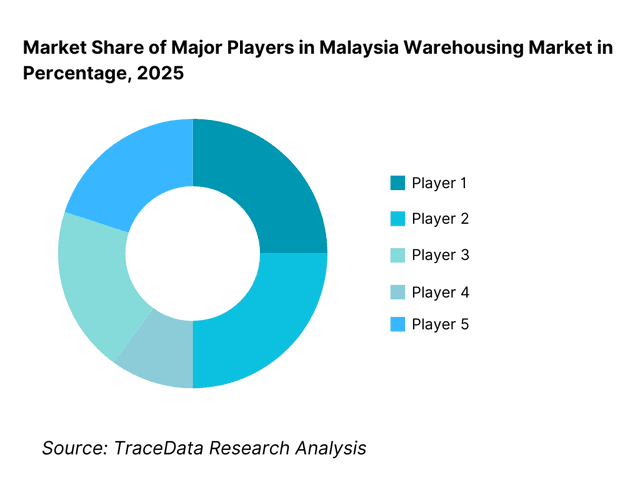
The Malaysia warehousing market exhibits moderate fragmentation, characterized by a mix of domestic logistics providers, regional third-party logistics (3PL) operators, multinational logistics firms, and industrial real estate developers. Market competitiveness is driven by location access, network coverage, service reliability, regulatory compliance capability, and the ability to offer integrated logistics solutions including transportation, customs handling, and value-added services.
Large players tend to dominate port-centric, multinational, and contract logistics-driven warehousing, while smaller and mid-sized operators remain competitive in localized distribution, short-term storage, and flexible service models. The emergence of modern logistics parks and institutional-grade warehousing is gradually increasing consolidation at the higher end of the market.
Name | Founding Year | Original Headquarters |
Tiong Nam Logistics Holdings Berhad | 1965 | Kuala Lumpur, Malaysia |
Swift Haulage Berhad | 1974 | Port Klang, Malaysia |
YCH Group | 1955 | Singapore |
DHL Supply Chain Malaysia | 1969 | Bonn, Germany |
DB Schenker Malaysia | 1872 | Essen, Germany |
Kuehne + Nagel Malaysia | 1890 | Schindellegi, Switzerland |
CEVA Logistics Malaysia | 2007 | Marseille, France |
FM Global Logistics Malaysia | 1996 | Shah Alam, Malaysia |
TASCO Berhad (Yusen Logistics) | 1974 | Kuala Lumpur, Malaysia |
Some of the Recent Competitor Trends and Key Information About Competitors Include:
Tiong Nam Logistics Holdings Berhad: As one of Malaysia’s largest homegrown logistics players, Tiong Nam continues to leverage its extensive warehousing footprint, integrated transport services, and strong customer relationships across manufacturing and retail sectors. The company’s competitive advantage lies in its nationwide network and ability to support large, long-term contract logistics engagements.
Swift Haulage Berhad: Swift Haulage maintains a strong position in port-centric logistics and container-linked warehousing. Its competitiveness is reinforced by proximity to major ports, strong trucking integration, and capability to support time-sensitive trade flows. Warehousing demand linked to import-export activities remains a core strength for the company.
DHL Supply Chain Malaysia: DHL operates at the premium end of the warehousing market, focusing on multinational clients, high-complexity supply chains, and technology-enabled warehouse operations. The company differentiates through advanced warehouse management systems, standardized operating processes, and strong compliance capabilities, particularly in healthcare and high-value sectors.
DB Schenker Malaysia: DB Schenker’s warehousing operations are closely integrated with freight forwarding and contract logistics services. Its positioning is strong in trade-driven warehousing, bonded facilities, and regional distribution hubs supporting multinational customers operating across Southeast Asia.
YCH Group: YCH continues to expand its role in supply chain solutions by offering large-scale distribution centers, value-added logistics services, and technology-driven warehousing models. Its regional expertise and focus on integrated logistics ecosystems support its competitiveness in modern warehousing developments.
What Lies Ahead for Malaysia Warehousing Market?
The Malaysia warehousing market is expected to expand steadily by 2035, supported by sustained trade activity, manufacturing continuity, e-commerce penetration, and increasing reliance on organized logistics infrastructure. Growth momentum is further enhanced by port-led distribution requirements, regional supply chain diversification within Southeast Asia, and rising demand for professionally managed storage and fulfillment facilities. As supply chains evolve toward faster turnaround times, decentralized inventory models, and higher service reliability, warehousing will remain a core logistics backbone supporting Malaysia’s domestic and international trade ecosystem.
Transition Toward Higher-Specification and Purpose-Built Warehousing Facilities: The future of the Malaysia warehousing market will see a gradual shift from basic storage sheds toward higher-specification, purpose-built facilities aligned with specific operational requirements. Demand is increasing for warehouses designed around higher clear heights, optimized dock layouts, racking compatibility, temperature control, fire safety compliance, and automation readiness. Cold storage, pharmaceutical distribution, and e-commerce fulfillment facilities require tighter operational controls, robust power backup, and technology-enabled monitoring systems. Operators and developers capable of delivering customized, application-specific warehouse formats will capture higher-value demand and longer-term tenancy commitments.
Growing Emphasis on Location Efficiency and Speed-to-Market in Logistics Networks: Warehouse location strategy will become increasingly critical as occupiers prioritize proximity to ports, industrial clusters, consumption centers, and cross-border trade routes. Faster market entry and reliable delivery timelines are pushing demand toward ready-built warehouses and logistics parks that reduce development lead times. Through 2035, this trend will strengthen demand for developers and operators with pre-approved land banks, scalable warehouse designs, and the ability to onboard tenants quickly without prolonged construction or approval cycles.
Expansion of E-commerce, Omni-Channel Retail, and Distributed Fulfillment Models: E-commerce growth will continue to reshape warehousing demand by driving the need for fulfillment centers, sortation hubs, and last-mile distribution facilities. Inventory decentralization strategies will increase the number of smaller, strategically located warehouses complementing large regional distribution centers. This shift favors warehouse operators that can offer flexible space configurations, short-to-medium lease terms, and value-added services such as pick-and-pack, returns processing, and inventory visibility solutions.
Rising Importance of Cold Chain and Compliance-Driven Warehousing Segments: Food security concerns, changing consumption patterns, and pharmaceutical supply chain expansion are expected to drive sustained growth in temperature-controlled warehousing. Cold storage facilities supporting frozen food, chilled products, vaccines, and biologics require higher capital investment and stringent compliance with safety and quality standards. As regulatory oversight increases, operators with strong compliance capabilities, validated processes, and reliable temperature integrity systems will gain competitive advantage and pricing power within this segment.
Malaysia Warehousing Market Segmentation
By Warehouse Type
• General Warehousing & Distribution Centers
• Bonded Warehouses & Free Zone Facilities
• Cold Storage & Temperature-Controlled Warehouses
• E-commerce Fulfillment & Last-Mile Warehouses
• Specialized Warehouses (Pharmaceuticals, Chemicals, High-Value Goods)
By Temperature Control
• Ambient Warehousing
• Chilled Warehousing
• Frozen Warehousing
• Multi-Temperature Facilities
By Ownership & Operating Model
• Captive / In-House Warehouses
• Third-Party Logistics (3PL) Operated Warehouses
• Developer-Owned Leased Warehouses
• Shared / Multi-User Warehousing Models
By End-Use Industry
• Manufacturing & Industrial
• Trade, Wholesale & Distribution
• Retail & E-commerce
• Food & Beverage
• Pharmaceuticals, Chemicals & Others
By Region
• Klang Valley
• Johor
• Northern Malaysia
• Southern & East Coast Malaysia
• East Malaysia
Players Mentioned in the Report:
• Tiong Nam Logistics Holdings Berhad
• Swift Haulage Berhad
• DHL Supply Chain Malaysia
• DB Schenker Malaysia
• Kuehne + Nagel Malaysia
• CEVA Logistics Malaysia
• YCH Group
• TASCO Berhad (Yusen Logistics)
• Regional logistics operators, cold chain specialists, and warehouse developers
Key Target Audience
• Warehousing and logistics service providers
• Third-party logistics (3PL) companies
• Industrial and logistics real estate developers
• Manufacturing companies and owner-occupiers
• E-commerce platforms and retail distributors
• Cold storage and food logistics operators
• Trade and distribution companies
• Private equity, infrastructure, and logistics-focused investors
Time Period:
Historical Period: 2019–2024
Base Year: 2025
Forecast Period: 2025–2035
Explore Flexible Purchase Options or Have Limited Budget?
Pay only for relevant chapters • Customizable report sections
Table of Contents
Choose individual sections to purchase. Mix and match as you like.
4. 1 Delivery Model Analysis for Warehousing including general warehousing, bonded warehouses, cold storage, fulfillment centers, cross-docking, and smart logistics parks with margins, preferences, strengths, and weaknesses
4. 2 Revenue Streams for Warehousing Market including rental income, third-party logistics fees, value-added services, cold chain handling fees, and e-commerce fulfillment charges
4. 3 Business Model Canvas for Warehousing Market covering warehouse operators, 3PL providers, logistics park developers, manufacturing and retail clients, port operators, and transport partners
5. 1 Global 3PL Operators vs Regional and Local Warehousing Players including DHL Supply Chain, DB Schenker, YCH Group, Tiong Nam Logistics, and other domestic or regional operators
5. 2 Investment Model in Warehousing Market including leased models, build-to-suit, owner-occupied, and joint venture logistics park developments
5. 3 Comparative Analysis of Warehousing Distribution by Captive, 3PL, and Developer-Owned Models including leasing terms, service contracts, and operational integration
5. 4 Industrial and Commercial Budget Allocation comparing warehousing spend versus transport, distribution, and fulfillment investments with average cost per square meter or pallet per month
8. 1 Revenues from historical to present period
8. 2 Growth Analysis by warehouse type and by end-use industry
8. 3 Key Market Developments and Milestones including logistics park launches, regulatory updates, major investments in cold chain or fulfillment, and industrial cluster expansions
9. 1 By Market Structure including global 3PLs, regional operators, and local players
9. 2 By Warehouse Type including general warehousing, bonded, cold storage, fulfillment centers, and specialized facilities
9. 3 By End-Use Industry including manufacturing, retail & e-commerce, trade & distribution, food & beverage, and pharmaceuticals & chemicals
9. 4 By User Segment including manufacturing companies, retail chains, distributors, and e-commerce platforms
9. 5 By Consumer Demographics including urban vs semi-urban industrial clusters and company size
9. 6 By Facility Type including ambient, chilled, frozen, and multi-temperature facilities
9. 7 By Lease or Ownership Type including captive, leased, developer-owned, and shared facilities
9. 8 By Region including Klang Valley, Johor, Northern Malaysia, Southern & East Coast Malaysia, and East Malaysia
10. 1 Industrial and Commercial Client Landscape highlighting manufacturing hubs, e-commerce fulfillment clusters, and port-adjacent operations
10. 2 Warehouse Selection and Procurement Decision Making influenced by location, pricing, service quality, temperature requirements, and lease flexibility
10. 3 Utilization and ROI Analysis measuring occupancy rates, throughput efficiency, and cost per pallet or cubic meter
10. 4 Gap Analysis Framework addressing service-level gaps, compliance requirements, and infrastructure limitations
11. 1 Trends and Developments including growth of cold chain logistics, fulfillment centers, smart warehouses, and automation adoption
11. 2 Growth Drivers including trade expansion, manufacturing investment, e-commerce growth, and government support for logistics infrastructure
11. 3 SWOT Analysis comparing global operator scale versus regional network strength and regulatory alignment
11. 4 Issues and Challenges including land scarcity, rising rental costs, labor availability, and regulatory compliance
11. 5 Government Regulations covering zoning approvals, customs supervision for bonded warehouses, food and pharmaceutical safety standards, and labor regulations
12. 1 Market Size and Future Potential of 3PL-operated warehouses, logistics parks, and cold chain facilities
12. 2 Business Models including build-to-suit, leased, captive, and shared facilities
12. 3 Delivery Models and Type of Solutions including integrated supply chain, last-mile distribution, and value-added services
15. 1 Market Share of Key Players by revenues and warehouse capacity
15. 2 Benchmark of 15 Key Competitors including DHL Supply Chain, DB Schenker, YCH Group, Tiong Nam Logistics, Swift Haulage, CEVA Logistics, Kuehne + Nagel, TASCO Berhad, and regional/local operators
15. 3 Operating Model Analysis Framework comparing global 3PL models, regional logistics-led models, and developer-owned warehouse models
15. 4 Gartner Magic Quadrant positioning global leaders and regional challengers in warehousing and logistics services
15. 5 Bowman’s Strategic Clock analyzing competitive advantage through differentiation via service quality versus cost-led strategies
16. 1 Revenues with projections
17. 1 By Market Structure including global 3PLs, regional operators, and local players
17. 2 By Warehouse Type including general, bonded, cold storage, and fulfillment centers
17. 3 By End-Use Industry including manufacturing, retail, trade & distribution, food & beverage, and pharmaceuticals & chemicals
17. 4 By User Segment including manufacturing companies, retailers, distributors, and e-commerce platforms
17. 5 By Consumer Demographics including urban and semi-urban industrial clusters, and company size
17. 6 By Facility Type including ambient, chilled, frozen, and multi-temperature
17. 7 By Lease or Ownership Type including captive, leased, developer-owned, and shared facilities
17. 8 By Region including Klang Valley, Johor, Northern Malaysia, Southern & East Coast Malaysia, and East Malaysia
Discuss a Customized Research Scope
Custom research scope • Tailored insights • Industry expertise
Research Methodology
Step 1: Ecosystem Creation
We begin by mapping the complete ecosystem of the Malaysia Warehousing Market across demand-side and supply-side entities. On the demand side, entities include manufacturing companies, importers and exporters, wholesalers and distributors, e-commerce platforms, retail chains, food and beverage companies, pharmaceutical distributors, chemical companies, and cold chain operators. Demand is further segmented by warehouse usage type (ambient storage, bonded storage, cold storage, fulfillment, cross-docking), operating model (captive vs outsourced), and service requirement (storage-only vs value-added logistics).
On the supply side, the ecosystem includes third-party logistics (3PL) providers, warehousing operators, cold chain specialists, port-centric logistics players, industrial real estate developers, warehouse park owners, material handling equipment suppliers, warehouse management system providers, transport and trucking partners, customs brokers, and regulatory authorities overseeing zoning, customs, and safety compliance. From this mapped ecosystem, we shortlist 8–12 leading warehousing and logistics operators across domestic and multinational categories based on warehouse footprint, geographic coverage, sector specialization, customer base, and operational capabilities. This step establishes how value is created and captured across warehouse development, operations, compliance, and integrated logistics service delivery.
Step 2: Desk Research
An exhaustive desk research process is undertaken to analyze the Malaysia warehousing market structure, demand drivers, and segment behavior. This includes reviewing trade volumes, port throughput trends, manufacturing output, e-commerce growth indicators, and logistics infrastructure development. We analyze warehouse demand by region, industry vertical, temperature requirement, and ownership model.
Company-level analysis includes review of operator service offerings, warehouse specifications, network scale, customer mix, and integration with transportation and customs services. Regulatory and compliance dynamics are examined, including bonded warehouse frameworks, free zone policies, food safety standards, pharmaceutical distribution requirements, and labor regulations affecting warehouse operations. The outcome of this stage is a comprehensive industry foundation that defines segmentation logic and establishes the assumptions required for market sizing and long-term outlook modeling.
Step 3: Primary Research
We conduct structured interviews with warehousing operators, 3PL providers, cold storage specialists, industrial real estate developers, logistics managers at manufacturing and trading companies, and e-commerce fulfillment heads. The objectives are threefold: (a) validate assumptions around demand concentration, outsourcing trends, and service expectations, (b) authenticate segment splits by warehouse type, end-use industry, and operating model, and (c) gather qualitative insights on rental trends, operating costs, labor availability, utilization rates, compliance challenges, and customer switching behavior.
A bottom-to-top approach is applied by estimating warehouse capacity, average storage pricing, and utilization levels across key segments and regions, which are aggregated to develop the overall market view. In selected cases, disguised buyer-style interactions are conducted with warehouse operators to validate field-level realities such as space availability, contract terms, service-level commitments, and operational bottlenecks.
Step 4: Sanity Check
The final stage integrates bottom-to-top and top-to-down approaches to cross-validate the market view, segmentation splits, and forecast assumptions. Demand estimates are reconciled with macro indicators such as trade growth, manufacturing investment trends, retail consumption patterns, and e-commerce penetration rates. Assumptions around utilization levels, pricing sensitivity, labor costs, and compliance-driven operating expenses are stress-tested to assess their impact on market growth and profitability. Sensitivity analysis is conducted across key variables including trade volume fluctuations, cold chain adoption rates, automation penetration, and regulatory enforcement intensity. Market models are refined until alignment is achieved between warehouse supply capacity, operator utilization, and customer demand pipelines, ensuring internal consistency and robust directional forecasting through 2035.
See What's Inside the Report
Get a preview of key findings, methodology and report coverage
Frequently Asked Questions
The Malaysia warehousing market holds strong long-term potential, supported by sustained trade activity, export-oriented manufacturing, rising domestic consumption, and growing reliance on organized logistics infrastructure. Warehousing demand is increasingly driven by e-commerce growth, inventory decentralization, and compliance-led expansion in food and pharmaceutical segments. As supply chains become more time-sensitive and service-oriented, professionally managed warehouses with higher specifications and integrated services are expected to capture greater value through 2035.
The market features a mix of large domestic logistics companies, regional Southeast Asian logistics groups, and multinational 3PL providers operating alongside industrial real estate developers. Competition is shaped by network scale, location access, service reliability, compliance capability, and integration with transportation and customs services. Larger players dominate contract logistics, port-centric, and multinational client segments, while mid-sized operators compete through flexibility, localized coverage, and niche specialization.
Key growth in drivers include expansion of international trade, continuity of manufacturing activity, rapid growth of e-commerce and omni-channel retail, and increasing outsourcing of warehousing to third-party providers. Additional momentum comes from cold chain expansion, regulatory formalization in food and pharmaceutical logistics, and rising demand for value-added warehouse services such as packaging, labeling, and fulfillment. Malaysia’s strategic location within Southeast Asia further reinforces its role as a regional warehousing and distribution hub.
Challenges include limited availability of well-located industrial land, rising rental and operating costs, labor availability constraints, and uneven quality of existing warehouse stock. Compliance requirements for bonded, food-grade, and pharmaceutical warehouses increase capital and operating costs, raising entry barriers for smaller players. In commoditized storage segments, competitive pricing pressure can limit margin expansion unless operators differentiate through service quality, technology adoption, or sector specialization.
License Options
PDF + Excel
Complete report package
$4,000
Excel Only
Data and analytics
$2,500
Custom Sections
Starts from $100
$0