Maldives Biofertilizers Market Outlook to 2030
By Microbial Type, By Formulation, By Application Method, By End User, By Crop/Use Case, By Distribution Channel, and By Atoll Cluster
Report Overview
Report Code
TDR0388
Coverage
Asia
Published
November 2025
Pages
80
Flexible Purchase Options
Select and purchase only the chapters you need for your strategic decisions
On This Page
Report Overview
The report titled “Maldives Biofertilizers Market Outlook to 2030 - By Microbial Type, By Formulation, By Application Method, By End User, By Crop/Use Case, By Distribution Channel, and By Atoll Cluster” provides a comprehensive analysis of the biofertilizer market in the Maldives. The report covers an overview and genesis of the industry, overall market size in terms of revenue, market segmentation; trends and developments, regulatory landscape, customer level profiling, issues and challenges, and competitive landscape including competition scenario, cross-comparison, opportunities and bottlenecks, and company profiling of major players in the biofertilizer market.
Report Coverage
Verified Market Sizing
Multi-layer forecasting with historical data and 5–10 year outlook
Deep-Dive Segmentation
Cross-sectional analysis by product type, end user, application and region
Competitive Benchmarking & Positioning
Market share, operating model, pricing and competition matrices
Actionable Insights & Risk Assessment
High-growth white spaces, underserved segments, technology disruptions and demand inflection points
Review Methodology & Data Structure
Preview report structure, data sources and research framework
Executive Summary
The report titled “Maldives Biofertilizers Market Outlook to 2030 - By Microbial Type, By Formulation, By Application Method, By End User, By Crop/Use Case, By Distribution Channel, and By Atoll Cluster” provides a comprehensive analysis of the biofertilizer market in the Maldives. The report covers an overview and genesis of the industry, overall market size in terms of revenue, market segmentation; trends and developments, regulatory landscape, customer level profiling, issues and challenges, and competitive landscape including competition scenario, cross-comparison, opportunities and bottlenecks, and company profiling of major players in the biofertilizer market. The report concludes with future market projections based on import volumes, product formulations, end-user categories, atoll clusters, cause-and-effect relationships, and success case studies highlighting the major opportunities and cautions.
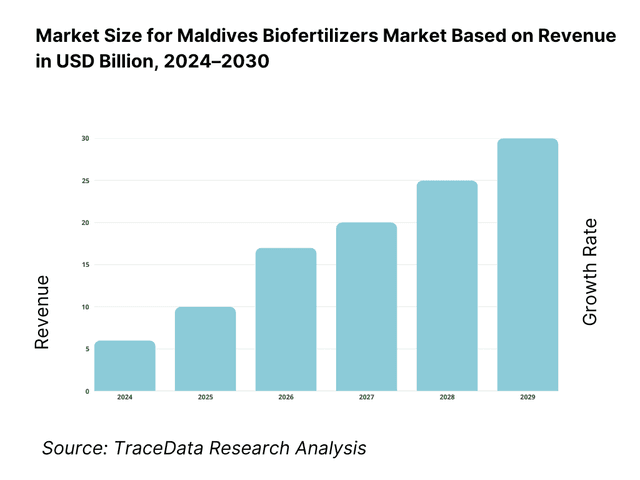
Maldives Biofertilizers Market Overview and Size
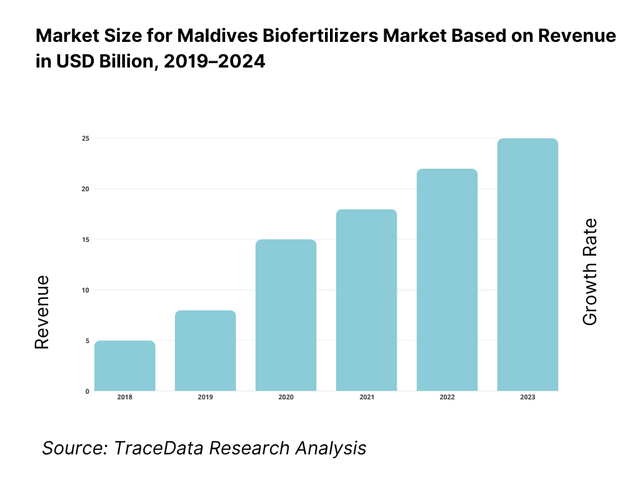
The Maldives biofertilizers market is best proxied by the value of animal or vegetable fertilizers (HS 310100) entering the country, totaling USD 1.249 million based on customs-reported merchandise trade. The demand signal strengthened alongside broader fertilizer inflows and agriculture input needs; fertilizers imports were USD 2.12 million for the following year, underscoring steady input replenishment to protected farms, island councils, and resort landscaping. Together, these trade datapoint's reflect a small but resilient market anchored in import-led supply and tourism-linked horticulture.
Market activity concentrates around Malé/Hulhumalé (Kaafu Atoll) and expands to Addu City and Fuvahmulah, where port access, warehousing, agri-retail, and resort procurement teams cluster. The logistics hub role is evident in national trade throughput, with total merchandise imports of USD 3.48 billion and USD 3.63 billion in the subsequent period, funneled largely via Malé’s terminals before island distribution. Dense tourism supply chains and protected cultivation near urban centers make these nodes the natural gateways for bio-inputs and after-sales agronomy support.
What Factors are Leading to the Growth of the Maldives Biofertilizers Market:
Tourism-anchored horticulture and steady logistics throughput: Biofertilizer usage in the Maldives is tightly coupled with year-round demand from resort landscaping and kitchen gardens concentrated near Malé and Hulhumalé. The country recorded 2,034,223 international arrivals, supported by 63,248 operational beds across all accommodation types, including 170 resorts with 42,147 resort beds. This tourism-led horticulture creates consistent demand for organic and bio-based cultivation inputs. Additionally, merchandise imports worth USD 3,637,000,000 ensure steady logistics throughput and reliable replenishment of biofertilizers across the main resort and farming islands.
Limited cultivable land and substrate-heavy protected cultivation: The Maldives’ land base limits conventional agriculture and promotes adoption of high-efficiency biological inputs tailored to coco-peat and hydroponic systems. The archipelago comprises about 1,200 islands, of which roughly 200 are inhabited across 22 geographical atolls. With only 4,000 hectares of arable land and approximately 27 km² of cultivable area, growers depend on microbial inoculants to enhance nutrient uptake and root development in low-organic or soilless substrates. This agronomic constraint directly drives demand for biofertilizers that improve soil fertility and substrate productivity.
Active fertilizer inflows and identifiable supplier corridors: Fertilizer inflows under HS Chapter 31 reached USD 2,120,000, reflecting an import-driven input market structured around regular shipments to Malé for redistribution across atolls. Partner data indicate key supplier relationships with India (USD 642,570), Sri Lanka (USD 641,220), Malaysia (USD 121,350), Italy (USD 106,970), and Turkey (USD 96,800). These stable trade corridors enable predictable procurement cycles, warm-chain logistics planning, and product standardization—facilitating consistent availability of microbial and organic fertilizers for both agricultural and resort-sector applications.
Which Industry Challenges Have Impacted the Growth of the Maldives Biofertilizers Market:
Fragmented multi-island logistics and last-mile lead times: Biofertilizer distribution across the Maldives involves high logistical complexity, with products transshipped from Malé to over 1,200 islands, of which around 200 are inhabited. While tourism hubs such as Malé and Addu maintain regular supply chains, agricultural shipments to smaller islands experience weather-related delays and ferry-based batching. This structure forces importers to maintain large inventory buffers and exposes biofertilizers—especially live inoculants—to quality degradation during storage and transport, increasing operational costs and wastage risk.
Warm-chain stability and seasonal shipment variability: Microbial biofertilizers are highly sensitive to temperature fluctuations during storage and shipping. Monthly import values vary significantly—USD 221,950 in August, USD 274,750 in July, and USD 550,340 for the second quarter—against an annual total of USD 2,120,000. These irregular inbound pulses lead to uneven stock rotation and strain shelf-life management systems. Without localized micro-warehousing near Malé and controlled-environment storage, inoculant viability can decline before distribution to distant atolls.
Ultra-small arable base and exposure to external shocks: With only 4,000 hectares of arable land and 27 km² of cultivable area, agricultural production in the Maldives operates on a fragile base. Tourism arrivals exceeding 2,034,000 annually compete for logistics capacity during peak periods, while total merchandise imports of USD 3,637,000,000 illustrate structural dependence on inbound supplies. This dependency makes agriculture highly vulnerable to freight disruptions, port congestion, or global supply volatility, which can directly delay planting cycles and biofertilizer application schedules.
What are the Regulations and Initiatives which have Governed the Market:
Customs classification and external-sector tracking for fertilizers (HS 31): All fertilizers—including organic and microbial biofertilizers—are recorded under HS Chapter 31, ensuring transparent trade tracking and import compliance. Annual entries under this category total USD 2,120,000, with India and Sri Lanka as leading source markets. Importers must provide classification details, certificates of analysis, and labeling documentation at customs clearance to meet both agricultural and resort procurement verification requirements, creating a consistent traceability framework for biofertilizer imports.
Environmental and food-safety interfaces for input claims and labelling: Biofertilizer labeling and claim validation intersect with the mandates of national environmental and food-safety authorities. The Maldives’ administrative structure—22 atolls and about 200 inhabited islands—necessitates uniform compliance standards for all imported agricultural inputs. For products used in resort horticulture and food production, labeling integrity, batch tracking, and conformity with environmental standards are essential to ensure resort procurement teams can verify input safety for edible crop programs.
Institutional procurement and vendor-list validation in tourism supply chains: With 63,248 operational beds and 170 resorts nationwide, procurement for biofertilizers often flows through resort-approved vendor lists. Importers are required to furnish documentation demonstrating origin, composition, and compliance with environmental and safety norms before onboarding. This resort-driven validation system acts as a de facto licensing mechanism for biofertilizer products. Given merchandise imports of USD 3,637,000,000, these compliance checks safeguard quality assurance while maintaining traceability across institutional buyers throughout the tourism-dominated economy.
Maldives Biofertilizers Market Segmentation
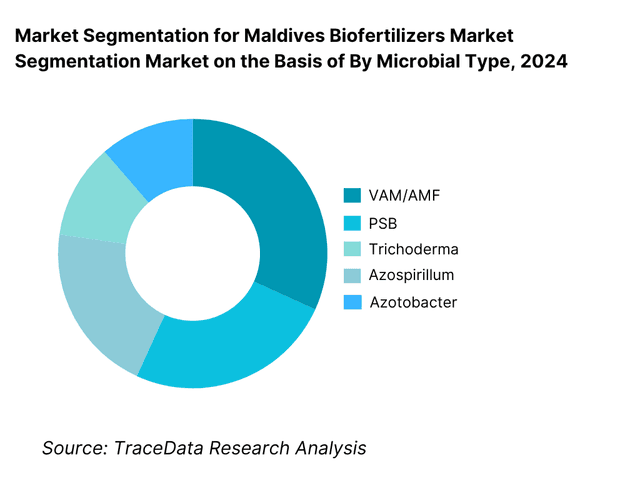
By Microbial Type: The Maldives biofertilizers market is segmented by microbial type into rhizobium, azospirillum, azotobacter, PSB, VAM/AMF, trichoderma, KSB and cyanobacteria. Recently, VAM/AMF has a dominant market share within this segmentation, due to the coco-peat substrate prevalence in protected cultivation, salinity stress mitigation, and consistent yield responses in leafy greens, cucurbits and fruiting vegetables. Resort kitchen gardens and hydroponic-adjacent nurseries prefer AMF consortia for root volume, nutrient uptake and water-use efficiency, while trichoderma rides as a complementary input in nursery and transplant windows for damping-off control and root vigor.
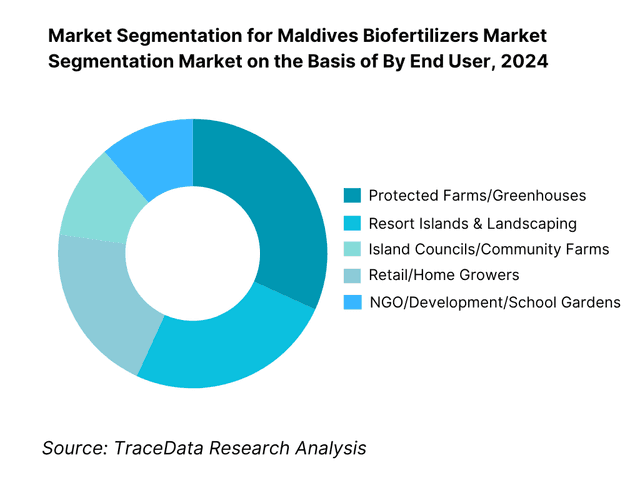
By End User: The Maldives biofertilizers market is segmented by end user into protected farms/greenhouses, resort islands & landscaping, island councils/community farms, retail/home growers, and NGO-supported plots. Recently, protected farms and greenhouses dominate because urban-proximate, high-frequency harvest models (leafy greens/herbs) demand consistent rooting, nutrient mobilization and disease suppression. Drip systems make fertigation compatible with liquid inoculants and AMF drenches, while predictable replenishment cycles ensure repeat orders. Resorts increasingly buy for landscaping and kitchen gardens, but protected farms remain the highest-intensity users due to controlled environments and tighter agronomy protocols.
Competitive Landscape in Maldives Biofertilizers Market
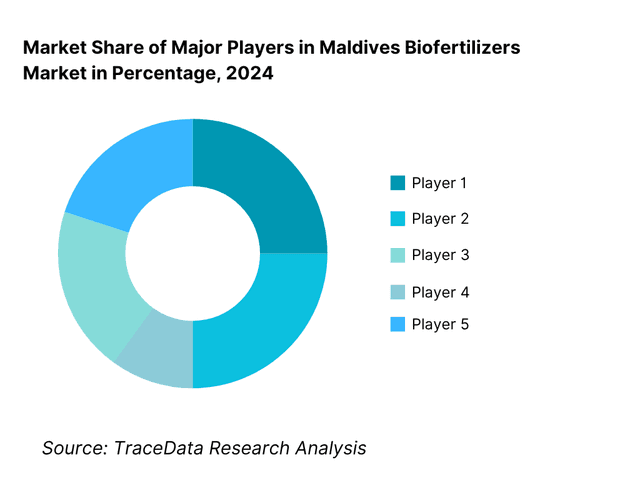
The Maldives biofertilizers market is importer-led with established global and regional brands competing via distributor partnerships and resort vendor lists. A few capability-rich biologicals players—with broad microbial portfolios, liquid high-CFU lines, and organic compliance—anchor premium demand, while Indian and Sri Lankan suppliers provide price-efficient consortia aligned to island cropping needs. This structure concentrates influence among brands with cold-chain awareness, salt-tolerant strains, and after-sales agronomy.
Name | Founding Year | Original Headquarters |
Novonesis | 2024 | Bagsværd, Denmark |
Lallemand Plant Care | 1915 | Montreal, Canada |
Rizobacter (Bioceres Group) | 1977 | Pergamino, Argentina |
Symborg (Corteva Biologicals) | 2010 | Murcia, Spain |
UPL – Natural Plant Protection (NPP) | 1969 | Mumbai, India |
IPL Biologicals | 1991 | Gurgaon, India |
T. Stanes & Co. | 1861 | Coimbatore, India |
Kan Biosys | 2005 | Pune, India |
AMVAC Biologicals | 1945 | California, USA |
Seawin Biotech | 2001 | Qingdao, China |
Sea6 Energy | 2010 | Bangalore, India |
Hayleys Agriculture | 1878 | Colombo, Sri Lanka |
CIC Agri Businesses | 1964 | Colombo, Sri Lanka |
Agro National Corporation (AgroNat) | 2020 | Malé, Maldives |
State Trading Organization (STO) | 1964 | Malé, Maldives |
Some of the Recent Competitor Trends and Key Information About Competitors Include:
Novonesis (Novozymes + Chr. Hansen Biosolutions): Following the merger of Novozymes and Chr. Hansen, Novonesis has strengthened its bio-agriculture portfolio, focusing on advanced microbial consortia and enzyme-enabled formulations tailored for tropical regions. The company has enhanced its global R&D integration, improving strain tolerance to saline and heat-stressed soils—an adaptation particularly relevant for the Maldives’ coral-sand substrates and protected cultivation environments.
Lallemand Plant Care: Lallemand has expanded its biofertilizer product range with proprietary Bacillus and Trichoderma formulations designed for organic-certified agriculture. Its recent emphasis on liquid inoculants with extended shelf life in warm climates makes it a preferred supplier in island markets. Strategic regional distribution partnerships in South Asia have strengthened its availability for Maldivian resorts and community farms.
Rizobacter (Bioceres Group): Rizobacter has recently advanced its biotechnological research in seed inoculants and phosphate-solubilizing bacteria. The company introduced enhanced formulations under the Rizoliq brand to improve nutrient absorption and drought resilience. In the Indian Ocean market, Rizobacter collaborates with regional importers to service high-value crops like cucurbits and leafy greens, aligning with Maldives’ hydroponic and protected farming expansion.
IPL Biologicals: IPL Biologicals has diversified its biofertilizer line to include multi-strain consortia and crop-specific blends catering to vegetables, cereals, and fruit crops. The company has optimized product stability under high humidity conditions—addressing key storage and transport challenges in the Maldives’ atoll-based logistics chain. IPL’s technical support and field trials across coastal and island environments enhance its regional credibility.
T. Stanes & Co.: T. Stanes & Co. has upgraded its microbial product range with formulations that combine mycorrhiza, Trichoderma, and nitrogen-fixing strains in a single carrier matrix. Its ongoing collaboration with agritech distributors in Sri Lanka and the Maldives ensures localized supply and technical support. The company has also initiated pilot projects focusing on integrating biofertilizers into island compost systems for sustainable soil health management.
What Lies Ahead for the Maldives Biofertilizers Market?
The Maldives biofertilizers market is poised for consistent growth through the end of the decade, supported by the nation’s strategic shift toward sustainable agriculture, protected cultivation, and import substitution for fresh produce. With fertilizer imports valued at USD 2.12 million according to the Maldives Monetary Authority, the demand for eco-friendly microbial inputs continues to grow in response to rising resort food demand, soil restoration needs, and government-backed climate adaptation measures. The market’s next phase will revolve around marine biotechnology integration, waste-to-compost programs, and atoll-level self-reliance in nutrient management.
Adoption of Protected and Controlled Environment Farming: The Maldives’ limited arable area—approximately 4,000 hectares according to the World Bank—is driving investment in hydroponic and greenhouse systems that support year-round cultivation. The Ministry of Tourism recorded 2,034,223 international arrivals and 63,248 operational beds, creating consistent farm-to-resort demand for vegetables, herbs, and fruits. Biofertilizers such as mycorrhiza and phosphate-solubilizing bacteria are becoming essential for yield stability in coco-peat substrates and nutrient-deficient soils under controlled conditions. This adoption trend is expected to scale across Malé, Addu, and Fuvahmulah, where protected farming infrastructure is expanding.
Integration of Marine-Derived Biofertilizers and Circular Economy Principles: The Maldives’ “Blue Economy” framework encourages harnessing its 3,000,000 km² Exclusive Economic Zone (EEZ) for sustainable resource use. Companies like Sea6 Energy and Seawin Biotech are leading in seaweed-based biofertilizer innovation, offering formulations suited for saline and sandy soils typical of the islands. With USD 3.63 billion in merchandise imports, the country is moving to replace imported synthetics with marine biomass-derived inputs, turning waste and seaweed into compostable biofertilizer bases. These circular-economy models directly support national sustainability targets and resort-sector greening programs.
Government-Led Food Self-Sufficiency and Waste-to-Farm Initiatives: Public-sector entities such as Agro National Corporation (AgroNat) are spearheading island-level composting and local biofertilizer production using resort organic waste streams. The Maldives features around 1,200 islands, of which 200 are inhabited, and 170 host resorts with 42,147 beds. These resorts generate high volumes of biodegradable waste suitable for inoculant-enriched composting. Integration of microbial biofertilizers into municipal composts is helping island councils close nutrient loops, reduce dependency on imported chemicals, and strengthen the local agriculture value chain under government sustainability programs.
Growing Role of Regional Supply Chains and Digital Trade Platforms: According to World Bank/WITS, fertilizer imports are led by India (USD 642,570) and Sri Lanka (USD 641,220), forming predictable, short-haul supply corridors. These trade relationships underpin the Maldives’ access to microbial inoculants, liquid consortia, and carrier-based biofertilizers optimized for tropical conditions. With improved logistics from Colombo and Kochi ports, and increased e-commerce adoption across agri-supply channels, the country is developing a digitally enabled market where resort buyers, councils, and small growers can order directly through verified distributors.
Maldives Biofertilizers Market Segmentation
By Microbial Type
Rhizobium
Azospirillum
Azotobacter
Phosphate-Solubilizing Bacteria (PSB)
Potassium-Solubilizing Bacteria (KSB)
Vesicular–Arbuscular Mycorrhiza (VAM/AMF)
Trichoderma
Cyanobacteria/Blue-Green Algae (BGA)
Multi-strain consortia
By Formulation
Liquid inoculants (high-CFU)
Carrier-based powders (talc/peat/lignite)
Water-soluble powders
Granules/prills
Encapsulated gels/beads
By Application Method
Seed treatment / seed coating
Seedling root-dip / transplant shock management
Soil drench / nursery media enrichment
Fertigation via drip/venturi injection
Foliar/immersion for nursery trays (where label-approved)
By Crop / Use Case (island systems)
Leafy greens & herbs under protected cultivation (lettuce, basil, coriander)
Fruiting & vine crops (cucumbers, tomatoes, melons)
Perennials & fruit trees (coconut, banana, papaya)
Root & tuber crops (taro, sweet potato)
Resort landscaping & ornamentals (turf, hedges, palms)
By End User
Protected farms/greenhouses (commercial)
Resort islands (kitchen gardens & landscaping)
Island councils & community farms
Retail/home growers & hobbyists
NGO/development & school garden programs
Players Mentioned in the Report:
Novonesis (biosolutions portfolio)
Lallemand Plant Care
Rizobacter (Bioceres)
Symborg (Corteva Biologicals)
UPL – Natural Plant Protection
IPL Biologicals
T. Stanes & Co.
Kan Biosys
AMVAC Biologicals
Seawin Biotech
Sea6 Energy
Hayleys Agriculture
CIC Agri
Agro National Corporation (AgroNat) — national aggregator/distributor role
State Trading Organization (STO) — import & retail channel role
Key Target Audience
Importing & distribution companies (island-to-island agricultural input distributors)
Protected-farming operators & greenhouse integrators
Investments and venture capitalist firms (bio-inputs, cold-chain light logistics)
Resort chains & landscaping procurement managers
Island councils & community farm programs
Government and regulatory bodies
Large retail garden centers & DIY agri outlets
Development agencies & NGO program managers
Time Period:
Historical Period: 2019-2024
Base Year: 2025
Forecast Period: 2025-2030
Explore Flexible Purchase Options or Have Limited Budget?
Pay only for relevant chapters • Customizable report sections
Table of Contents
Choose individual sections to purchase. Mix and match as you like.
4.1. Delivery Model Analysis for Biofertilizers in Maldives-Direct Import, Distributor-Retail Model, PPP Procurement, Resort Vendor Supply, Hydroponic Integration
4.2. Revenue Streams for Biofertilizer Market in Maldives-Retail Sales, Institutional Contracts, Resort Landscaping Supply, PPP Demonstration Projects, Compost Enrichment
4.3. Business Model Canvas for Maldives Biofertilizers Market-Key Partners, Value Propositions, Customer Segments (Protected Farms, Resorts, Island Councils), Cost Structure, Revenue Streams
5.1. Imported vs. Locally Formulated Products
5.2. Investment Model in Maldives Biofertilizers Market
5.3. Comparative Analysis of Procurement Process: Public vs. Private Sector
5.4. Budget Allocation for Biofertilizer Adoption by Sector
8.1. Revenues (Historical)
9.1. By Market Structure (In-House Compost Integration vs. Outsourced Biofertilizer Imports)
9.2. By Microbial Type (Rhizobium, Azospirillum, Azotobacter, PSB, KSB, Mycorrhiza, Trichoderma, Cyanobacteria)
9.3. By Application Method (Seed Treatment, Root Dip, Soil Drench, Fertigation, Nursery Enrichment)
9.4. By End User (Protected Farms, Resorts, Island Councils, Retail Growers, NGOs/Development Projects)
9.5. By Distribution Channel (Government Procurement, Import Distributors, Retail Agro-dealers, E-Commerce, Resort Contracts)
9.6. By Mode of Usage (Stand-alone Application vs. Integrated Nutrient Management)
9.7. By Product Customization (Generic Products vs. Crop-Specific Blends)
9.8. By Region (Malé & Kaafu, Addu, Fuvahmulah, North Atolls, South Atolls)
10.1. End-User Landscape and Cohort Analysis-resorts, island cooperatives, individual hydroponic growers
10.2. Adoption Behavior and Decision-Making Process-awareness, pricing sensitivity, technical guidance
10.3. Effectiveness and ROI Analysis-yield improvements, cost-per-acre impact, soil organic carbon index
10.4. Gap Analysis Framework-availability, affordability, awareness, accessibility
11.1. Trends and Developments-salt-tolerant inoculants, compost+bio mix, drip fertigation adoption, marine-derived strains
11.2. Growth Drivers-food self-reliance mission, import substitution, sustainable tourism push, government pilot farms
11.3. SWOT Analysis
11.4. Issues and Challenges-logistics, cold-chain, technical skill deficit, quality control
11.5. Government Regulations-registration process, labeling norms, customs code, quality testing standards
12.1. Market Size and Future Potential for Online Biofertilizer Sales Platforms in Maldives
12.2. Business Model and Revenue Streams-WhatsApp orders, aggregator logistics, digital invoicing
12.3. Delivery Models and Type of Products Offered-farm inputs, compost blends, drip kits
15.1. Market Share of Key Players (By Imports/Revenue)
15.2. Benchmark of Key Competitors (Company Overview, Product Portfolio, Pricing, USP, Distribution Reach, Shelf Life, CFU Strength, Clients, Marketing Strategy, Technical Support, Partnerships, Innovation Focus)
15.3. Operating Model Analysis Framework-Importer-Distributor-Retailer structure
15.4. Gartner-style Quadrant Positioning (Innovation vs. Execution)
15.5. Bowman’s Strategic Clock for Competitive Advantage
16.1. Revenues (Forecast)
17.1. By Market Structure (In-House Compost Integration vs. Outsourced Imports)
17.2. By Microbial Type (as in Section 9)
17.3. By Application Method (as in Section 9)
17.4. By End User
17.5. By Distribution Channel
17.6. By Mode of Usage
17.7. By Product Customization
17.8. By Region (Malé, Addu, Fuvahmulah, North, South Atolls)
Discuss a Customized Research Scope
Custom research scope • Tailored insights • Industry expertise
Research Methodology
Step 1: Ecosystem Creation
Map the ecosystem and identify all the demand-side and supply-side entities for the Maldives Biofertilizers Market. Based on this ecosystem, we will shortlist leading 5–6 biofertilizer suppliers and distributors operating within or supplying to the Maldives, using criteria such as product portfolio, supply reliability, regional presence, and import records verified through Maldives Monetary Authority (MMA) and World Bank WITS data. Sourcing is conducted through industry articles, FAO and Ministry of Agriculture publications, trade portals (HS 31/3101 import data), and proprietary databases to perform desk research around the market to collate industry-level information.
Step 2: Desk Research
Subsequently, we engage in an exhaustive desk research process by referencing diverse secondary and proprietary databases. This approach enables a thorough analysis of the market, aggregating industry-level insights from official sources such as Maldives Monetary Authority trade statistics, World Bank WITS, FAO, and Ministry of Fisheries, Marine Resources and Agriculture publications. We examine total fertilizer imports (USD 2.12 million), microbial inoculant subcategories, and channel mapping by atoll. The analysis covers biofertilizer types (AMF, PSB, Trichoderma, Azospirillum, Azotobacter), carriers (liquid, talc, peat, granules), and shelf-life adaptations for tropical climates. Company-level information is compiled through press releases, sustainability reports, certification filings, and product catalogs of suppliers such as Novonesis, Lallemand, and IPL Biologicals. This establishes a foundation for quantitative validation and channel profiling.
Step 3: Primary Research
We initiate a series of in-depth interviews with C-level executives, agronomists, and procurement heads representing Maldives biofertilizer importers, resort buyers, and regional manufacturers. This process serves a multi-faceted purpose: to validate market hypotheses, authenticate customs trade data, and extract operational and financial insights directly from industry practitioners. A bottom-to-top approach is employed to evaluate revenue contributions and product movement per supplier. Primary research also includes structured interviews with resort horticulture managers, island council farm coordinators, and greenhouse operators to understand dosage, frequency of application, and adoption barriers. As part of validation, disguised interviews are conducted by approaching importers and distributors as potential buyers to verify logistical details such as cold-chain handling, lead times to atolls, and product expiry rates. The outcomes are cross-verified with MMA and WITS datasets for triangulation.
Step 4: Sanity Check
A bottom-to-top and top-to-bottom analysis, coupled with market modeling exercises, is undertaken to assess data sanity and consistency. Top-down validation uses aggregated import values under HS 31/3101 (USD 2.12 million), while bottom-up modeling estimates consumption based on the number of greenhouses, average treated area (4,000 ha arable land per World Bank), and application frequency. Both layers are reconciled by factoring logistics losses, shelf-life degradation, and resort versus community-farm usage ratios. Discrepancies beyond tolerance levels are reviewed through follow-up expert consultations. The outcome ensures an accurate and defensible market model representing the Maldives Biofertilizers Market, validated through multi-source cross-checking and aligned with official trade and agricultural datasets.
See What's Inside the Report
Get a preview of key findings, methodology and report coverage
Frequently Asked Questions
The Maldives Biofertilizers Market presents significant potential driven by the nation’s transition toward sustainable and self-reliant agriculture. According to the Maldives Monetary Authority, fertilizers and organic inputs under HS Chapter 31 recorded imports worth USD 2.12 million, evidencing an active and growing input base. The market’s potential is reinforced by the rise of protected cultivation and hydroponic farms, particularly near Malé, Addu, and Fuvahmulah, as well as resort-based kitchen gardens serving the tourism sector. The combination of high input dependency, government sustainability initiatives, and expanding resort horticulture underlines the strong potential for biofertilizers as a key agricultural input across the islands.
The Maldives Biofertilizers Market features a mix of international manufacturers and regional distributors supplying microbial inoculants tailored for tropical environments. Key players include Novonesis (Novozymes + Chr. Hansen Biosolutions), Lallemand Plant Care, Rizobacter (Bioceres Group), IPL Biologicals, T. Stanes & Co., and Kan Biosys. Regional suppliers such as Hayleys Agriculture and CIC Agri Businesses in Sri Lanka support island distribution, while Agro National Corporation (AgroNat) and State Trading Organization (STO) manage import, storage, and retail logistics within the Maldives. These firms dominate due to their diversified microbial lines (AMF, PSB, Trichoderma), warm-climate formulations, and compliance with environmental and organic-input standards.
Several structural factors underpin the Maldives Biofertilizers Market growth. The World Bank reports only 4,000 hectares of arable land in the country, highlighting the critical need for high-efficiency, microbial soil enhancers to sustain productivity in limited spaces. Simultaneously, the Ministry of Tourism recorded 2,034,223 international arrivals and 63,248 operational beds, spurring steady demand for fresh produce and resort horticulture inputs. Government-backed programs through AgroNat are promoting organic composting and soil restoration. Together, these forces—limited cultivable land, tourism-linked food supply requirements, and the sustainability agenda—drive sustained adoption of biological fertilizers for both commercial farms and resort operations.
The market faces challenges stemming from logistics, climate, and regulatory constraints. The Maldives Monetary Authority highlights that fertilizer imports fluctuate between USD 221,950 and USD 274,750 per month, indicating supply irregularities that affect product availability. Transport across 22 atolls and over 200 inhabited islands results in long lead times and storage difficulties under tropical heat, impacting microbial viability. Additionally, the absence of a domestic manufacturing base and limited agronomic expertise in biofertilizer handling add complexity to adoption. Compliance with EPA and MFDA labeling and quality norms further extends import clearance timelines, posing hurdles for smaller distributors.
License Options
PDF + Excel
Complete report package
$4,000
Excel Only
Data and analytics
$2,500
Custom Sections
Starts from $100
$0