Myanmar Biofertilizers Market Outlook to 2030
By Microbial Type, By Formulation & Carrier, By Application Method, By Crop/End-Use, and By Distribution Channel
Report Overview
Report Code
TDR0349
Coverage
Asia
Published
October 2025
Pages
80
Flexible Purchase Options
Select and purchase only the chapters you need for your strategic decisions
On This Page
Report Overview
The report titled “Myanmar Biofertilizers Market Outlook to 2030 — By Microbial Type, By Formulation & Carrier, By Application Method, By Crop/End-Use, and By Distribution Channel” provides a comprehensive analysis of Myanmar’s biofertilizers industry. The report covers the market’s overview and genesis, overall market size in value terms, detailed segmentation, key trends and developments, regulatory and licensing landscape (Fertilizer Law, MAIRS workflows, labeling norms), customer-level profiling (farmer cohorts and adoption funnels), issues and challenges (power/logistics, QA/CFU compliance), and a competitive landscape including competition scenario, cross-comparison, opportunities and bottlenecks, and company profiling of major players active in Myanmar.
Report Coverage
Verified Market Sizing
Multi-layer forecasting with historical data and 5–10 year outlook
Deep-Dive Segmentation
Cross-sectional analysis by product type, end user, application and region
Competitive Benchmarking & Positioning
Market share, operating model, pricing and competition matrices
Actionable Insights & Risk Assessment
High-growth white spaces, underserved segments, technology disruptions and demand inflection points
Review Methodology & Data Structure
Preview report structure, data sources and research framework
Executive Summary
The report titled “Myanmar Biofertilizers Market Outlook to 2030 — By Microbial Type, By Formulation & Carrier, By Application Method, By Crop/End-Use, and By Distribution Channel” provides a comprehensive analysis of Myanmar’s biofertilizers industry. The report covers the market’s overview and genesis, overall market size in value terms, detailed segmentation, key trends and developments, regulatory and licensing landscape (Fertilizer Law, MAIRS workflows, labeling norms), customer-level profiling (farmer cohorts and adoption funnels), issues and challenges (power/logistics, QA/CFU compliance), and a competitive landscape including competition scenario, cross-comparison, opportunities and bottlenecks, and company profiling of major players active in Myanmar. The report concludes with future market projections by segment (microbial type, formulations, crops, channels), region-wise outlook, cause-and-effect linkages shaping demand creation, and success case studies highlighting the most attractive white spaces and execution cautions for new and existing market participants.
Myanmar Biofertilizers Market Overview and Size
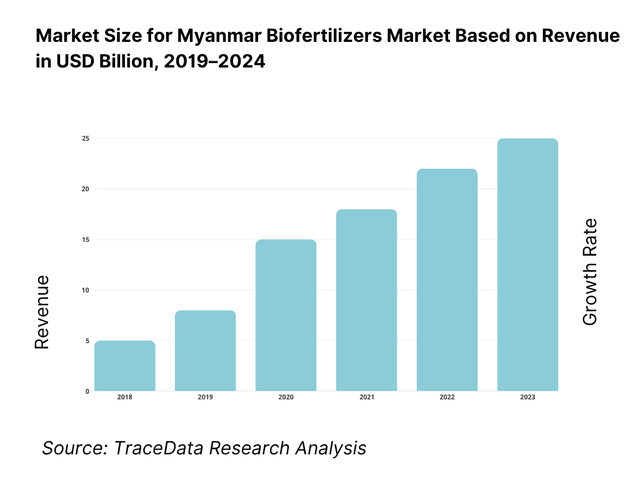
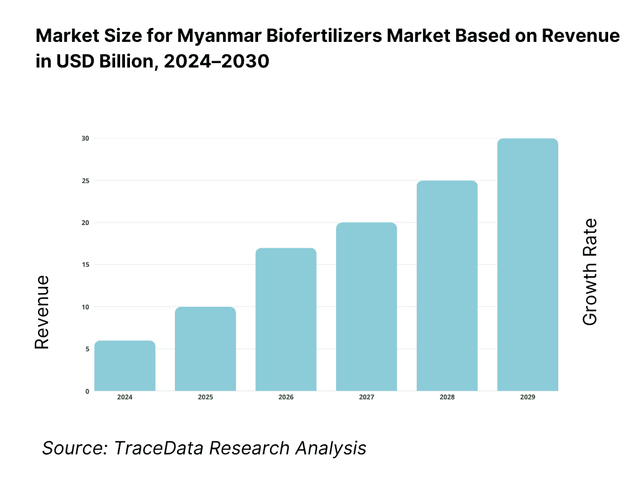
The Myanmar Biofertilizers market is currently valued at USD 15 million as of 2024. Global context shows biofertilizers at USD 2.31 billion (global) with strong momentum, while Myanmar’s fertilizer demand backdrop is expanding—authorities targeted 1.047 million tons of fertilizer imports in 2023–24 and 1.6 million tons in 2024–25, signalling room for biologicals within nutrient programs.
Adoption clusters are anchored in Ayeyarwady and Bago deltas, Mandalay, Sagaing and Shan, where paddy and pulses intensity, dealer density, and organized extension intersect. USDA-cited analysis notes expanded rice planting in 2023/24 despite high fertilizer costs, while 2024 corporate sustainability disclosures show private agronomy programs training 122,500+ farmers—concentrated in major rice belts—thus amplifying on-farm trials for seed-coat inoculants and PSB/KSB consortia.
What Factors are Leading to the Growth of the Myanmar Biofertilizers Market:
Scale of rice cultivation and nutrient demand creates a large biological addressable base: Myanmar’s rice harvested area is 6.86 million hectares and milled rice output is 11.95 million metric tons in the current crop year, anchoring the country’s nutrient demand and continuous soil-health needs; authorities also organized fertilizer procurement where the steering committee targeted 1.6 million tons of fertilizer imports for the 2024–25 fiscal cycle, indicating a system moving large nutrient volumes through which biofertilizer's can substitute or complement. With a national population recorded at 54,500,091 people, broad food-grain intensity and farmer exposure remain high, supporting biological adoption pathways across paddy, pulses and oilseeds.
Agro-logistics footprint enables inbound inputs and distribution to farming belts: Myanmar’s container ports processed 761,557 TEU in 2023, sustaining inbound flows of agricultural inputs, packaging and carriers needed for microbial products. National electricity generation from hydropower alone delivered 9,070 GWh in 2022/23, providing an essential baseline for fermentation, cold storage and retail operations in urban nodes even as the grid faces constraints. These hard logistics numbers, combined with strong agro belts in Ayeyarwady, Bago, Mandalay, Sagaing and Shan, underpin the physical feasibility of scaling biofertilizer shipments and dealer replenishment to township markets.
Institutional demand signals and organized procurement channels: The government procurement framework for crop inputs included an actual 2023–24 import reference and a targeted 1,600,000 tons of fertilizer for 2024–25, creating predictable windows for distributors to piggyback biological lines through the same customs and warehousing corridors. USDA crop reporting adds scale clarity with a five-year national rice area average of 6.872 million hectares, reinforcing the steady installed base of seed treatments and soil inoculant opportunities at planting. The combination of these numeric anchors facilitates year-round planning of biofertilizer demos and township stocking.
Which Industry Challenges Have Impacted the Growth of the Myanmar Biofertilizers Market:
Power supply gaps raise production and cold-chain risks for microbial products: World Bank diagnostics indicate the country’s available generation capacity fell by more than 2.5 GW versus expectations, with ~2 GW of planned gas-based projects on hold and prior shortages of ~300 MW already documented before recent shocks. Such absolute capacity deficits complicate sterile fermentation runs, climate-controlled storage for liquid inoculants, and reliable dealer refrigeration during monsoon months, forcing firms to budget generators and fuel logistics for production and township warehouses.
Port and hinterland constraints limit speed to market despite throughput: While UNCTAD reports 761,557 TEU handled in 2023, Myanmar’s relative scale remains modest compared with regional hubs, translating into fewer weekly services and longer lead times for specialized carriers, sterilized packaging, and imported strains. The World Bank’s Myanmar infrastructure monitoring further flags logistics bottlenecks that slow domestic distribution from ports to delta and dry-zone townships, increasing dwell times for biofertilizer consignments and elevating stock-out risk at peak sowing windows.
Macroeconomic volatility complicates inventory and working-capital planning: The IMF country page underscores continued macro pressure, including high consumer-price dynamics and a population marker of ~55.182 million which magnifies exposure to staples and input costs across a broad agrarian base. For biofertilizer firms, such macro signals translate into shorter dealer credit cycles and cautious stocking, especially for higher-value liquid inoculants with tighter shelf-life. These hard numbers reinforce the need for phased shipments, smaller pack sizes, and localized safety stocks close to rice and pulses belts.
What are the Regulations and Initiatives which have Governed the Market:
Centralized online licensing via MAIRS with defined certificate types: Myanmar’s Department of Agriculture operates the MAIRS portal that accepts applications for Seed Recognition, Fertilizer Registration, Pesticide Registration, Seed Business License, Fertilizer Storage License, and Import/Export Endorsements—a total of 6 distinct certificate/license categories administered online. For biofertilizer companies, this numerical clarity reduces offline steps and concentrates filings and renewals within one government system.
Labelling obligations enumerate explicit particulars, including Myanmar language: Official trade-portal guidance (updated 2023) specifies that any fertilizer package or container must state trademark, product name, net weight, storage instructions, and prescription and cautions, and that foliar fertilizer and bio-fertilizer information must be in Myanmar language or Myanmar plus other languages—yielding 5+ mandatory particulars that directly shape biofertilizer artwork and pack-size decisions.
Registration workflow documented with online submission and departmental routing: The Trade Portal’s procedure note (2023) confirms that applicants apply online via MAIRS for a fertilizer registration certificate and proceed through departmental review, offering a transparent step count and digital routing rather than paper-only filings. The measure page further directs applicants to the Land Use Division for business registration details, consolidating the number of official touchpoints to a small set of government URLs, which reduces ambiguity for new biological entrants.
Myanmar Biofertilizers Market Segmentation
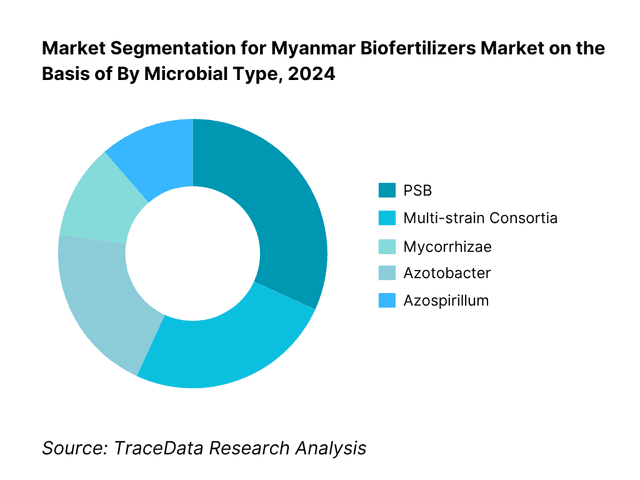
By Microbial Type: Myanmar Biofertilizers market is segmented by microbial type into Rhizobium, Azotobacter, Azospirillum, PSB, KSB, mycorrhizae, and multi-strain consortia. Recently, PSB-led and consortia products have a dominant market share under microbial type because they address Myanmar’s widely reported phosphorus fixation issues in paddy soils and mixed smallholder systems, delivering visible yield responses across rice, pulses, and oilseeds with simpler farmer instructions than crop-specific Rhizobium. Private agronomy networks and NGO demonstration plots in the delta and dry zones have prioritized seed-coat PSB and PSB+KSB stacks due to consistent field feedback and easier dealer messaging relative to strain-specific inoculants. Moreover, policy and labeling rules recognize biofertilizers alongside chemical fertilizers, which supports compliant roll-outs of multi-microbe packs with Myanmar-language instructions, reinforcing retailer confidence and repeat use.
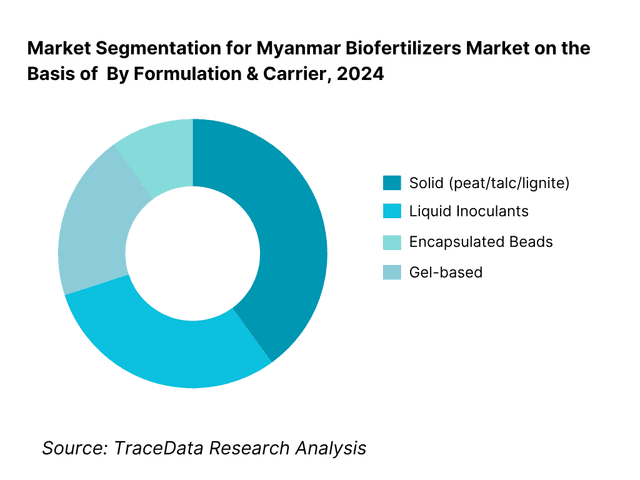
By Formulation & Carrier: Biofertilizers market is segmented by formulation into solid (peat/talc/lignite), liquid inoculants, encapsulated beads, and gel-based. Recently, solid carrier products have a dominant market share under formulation type due to easier ambient storage through monsoon logistics, longer perceived shelf-life at township shops, and reduced cold-chain dependence relative to liquids. Dealer familiarity with talc/peat packs simplifies stocking and advisory, while Myanmar’s labeling and registration regime explicitly covers biofertilizers, enabling compliant Myanmar-language packs for solids. That said, liquid inoculants are gaining traction via company-led demos and large agronomy teams focusing on seed-treatment convenience in paddy nurseries. The coexistence of NGO pilots and private extension keeps liquids’ growth strong, but solids still anchor volumes in rural retail where warehousing and transport conditions are variable.
Competitive Landscape in Myanmar Biofertilizers Market
The Myanmar biofertilizers space mixes a strong local anchor (Myanma Awba Group) with imported biologicals from global players such as Rizobacter (Bioceres), Koppert, UPL BioSolutions, and Lallemand Plant Care—typically routed through distributors or regional partners. This pattern concentrates influence among a handful of firms that maintain compliance with labeling rules, run demo plots, and field sizeable agronomy teams, giving them outsized sway over dealer recommendations and farmer adoption funnels.
Name | Founding Year | Original Headquarters |
Myanma Awba Group | 1995 | Yangon, Myanmar |
Proximity Designs | 2004 | Yangon, Myanmar |
Rizobacter (Bioceres) | 1977 | Pergamino, Argentina |
Koppert | 1967 | Berkel en Rodenrijs, Netherlands |
UPL BioSolutions | 1969 | Mumbai, India |
Lallemand Plant Care | 2012 (Plant Care unit) | Montreal, Canada |
T. Stanes & Co. | 1861 | Coimbatore, India |
Kan Biosys | 2005 | Pune, India |
Novozymes | 1925 | Bagsværd, Denmark |
Valagro | 1980 | Atessa, Italy |
Biostadt | 2003 | Mumbai, India |
ProFarm | 2006 | Davis, USA |
Map Pacific | 1990 | Singapore |
Local Township SMEs | Various | Myanmar |
Great Wall Agri Inputs | 1990s | China |
Some of the Recent Competitor Trends and Key Information About Competitors Include:
Myanma Awba Group: As the largest local agribusiness in Myanmar, Awba has expanded its biofertilizer portfolio by integrating multi-strain consortia and mycorrhizae products. In 2024, the company strengthened its agronomy outreach, conducting nationwide demo plots for rice and pulses, ensuring stronger adoption at the township level.
Proximity Designs: Known for its deep rural extension network, Proximity Designs has scaled its soil health and bio-decomposer programs across the Ayeyarwady Delta. In 2024, the NGO focused on farmer-led trials and bundled biofertilizers with soil advisory services, targeting smallholder adoption and organic certification readiness.
Rizobacter (Bioceres): A global leader in Rhizobium inoculants, Rizobacter has increased its Myanmar presence through distributors. In 2024, it introduced pulse-specific inoculants to support export-oriented mung bean growers, backed by field demonstrations and dealer training.
Koppert: Specializing in mycorrhizae and biological inputs, Koppert extended its product distribution into Myanmar’s horticulture clusters in 2024. The company emphasized demonstration programs for vegetable and fruit growers, reinforcing its role in high-value crop markets.
UPL BioSolutions: UPL has broadened its biofertilizer footprint in Myanmar by offering Azotobacter, Azospirillum, and PSB inoculants. In 2024, it partnered with local distributors to introduce bundled packages combining biofertilizers with micronutrients, enhancing adoption among rice and oilseed farmers.
What Lies Ahead for Myanmar Biofertilizers Market?
The Myanmar biofertilizers market is expected to witness steady expansion over the next five years, supported by the government’s continued efforts to secure fertilizer supplies, rising demand for sustainable crop inputs, and the increasing role of NGOs and private agronomy networks in farmer training. With 1.6 million tons of fertilizer imports targeted for the 2024–25 fiscal cycle, biofertilizers are positioned as an attractive complement to chemical fertilizers, reducing dependency on imports and improving soil health for Myanmar’s 6.86 million hectares of rice farmland.
Rise of Multi-Strain Consortia and PSB/KSB Products: The future of the market will see greater emphasis on consortia-based products and phosphate/potassium solubilizing inoculants, which address key nutrient limitations in Myanmar soils. Their adaptability across multiple crops will strengthen adoption among smallholders in paddy and pulses belts.
Focus on Farmer-Centric Demonstrations: NGOs and companies are expected to scale farmer field demonstrations, ensuring measurable outcomes in terms of yield gains and soil quality. These evidence-based programs will accelerate trust and repeat purchases in rural markets.
Expansion of Crop-Specific Solutions: Demand is set to rise for tailored biofertilizers designed for Myanmar’s dominant crops—rice, pulses, and sesame. Sector-specific formulations and application methods such as seed coating and root dipping will improve compatibility with traditional farming practices.
Integration with Digital Extension Services: The use of mobile advisory platforms and agronomy apps will grow, enabling personalized guidance on dosage, timing, and crop-specific benefits. This integration will improve training effectiveness and extend the reach of biofertilizer adoption across remote regions.
Myanmar Biofertilizers Market Segmentation
By Microbial Type
Rhizobium
Azotobacter
Azospirillum
Phosphate-Solubilizing Bacteria (PSB)
Potassium-Solubilizing Bacteria (KSB)
Mycorrhizae
Multi-strain Consortia
By Formulation & Carrier
Solid (peat, lignite, talc-based)
Liquid Inoculants
Encapsulated Beads
Gel-based Formulations
By Application Method
Seed Coating
Root Dipping
Soil Drenching
Fertigation/Drip Integration
Nursery/Seedling Treatment
By Crop / End-Use
Paddy Rice
Pulses (green gram, black gram, pigeon pea)
Oilseeds (sesame, groundnut, sunflower)
Maize
Horticulture (vegetables, fruits, plantation crops)
By Distribution Channel
Company-led Agronomy Teams
Township Dealers & Retailers
NGO & Social Enterprise Programs
E-commerce / Tele-order Platforms
Farmer Cooperatives & Groups
Players Mentioned in the Report:
Myanma Awba Group
Proximity Designs (soil health programs)
Rizobacter (Bioceres)
Lallemand Plant Care
Koppert
UPL BioSolutions
T. Stanes & Co.
Kan Biosys
Novozymes (Microbial Solutions)
Valagro (Syngenta Biologicals)
Biostadt; ProFarm (MBI)
Map Pacific
Local township-scale SMEs/fermenters
Distributor alliances serving horticulture clusters.
Key Target Audience
Input distributors & dealer chains (township agri-retail networks)
Large farming enterprises & contract grower schemes (rice mills/exporters)
Agri-input manufacturers entering Myanmar (biofert & biostimulant lines)
Food exporters & organic value-chain aggregators (rice/pulses exporters)
Government & regulatory bodies
Myanmar National Trade Portal
Investments and venture capitalist firms (biologicals, ag-retail, cold-chain)
NGOs & social enterprises running agronomy programs (e.g., Proximity Designs)
Proximity Designs
International development partners & donors
Time Period:
Historical Period: 2019-2024
Base Year: 2025
Forecast Period: 2025-2030
Explore Flexible Purchase Options or Have Limited Budget?
Pay only for relevant chapters • Customizable report sections
Table of Contents
Choose individual sections to purchase. Mix and match as you like.
4.1 Delivery Model Analysis for Biofertilizers-Direct Distribution, Dealer-led, NGO-led, Cooperative-led, Digital/Tele-order [margins, preference, strengths & weaknesses]
4.2 Revenue Streams for Myanmar Biofertilizers Market [product sales, bundled soil health kits, demo-based sales, subscription/advisory integration]
4.3 Business Model Canvas for Myanmar Biofertilizers Market [key partners, key activities, value propositions, customer relationships, cost structure, revenue streams]
5.1 Local Manufacturers vs. Imported Products [production share, quality perception, reliance on imports]
5.2 Investment Model in Myanmar Biofertilizers Market [government-backed vs. donor-backed pilot plants, private investment, SME scaling challenges]
5.3 Comparative Analysis of Distribution Funnels by Private Sector and NGO-led Programs [reach, effectiveness, adoption rates]
5.4 Farmer Expenditure Allocation for Inputs by Farm Size [input spend composition, share of biofertilizers within fertilizer budgets]
8.1 Revenues [historical market size, CAGR, key milestones]
9.1 By Market Structure [local manufacturing vs. imports]
9.2 By Microbial Type [Rhizobium, Azotobacter, Azospirillum, PSB, Mycorrhizae, Consortia]
9.3 By Crop/End-Use [paddy rice, pulses, oilseeds, maize, horticulture]
9.4 By Farmer Segment [large farms, SMEs, smallholders, cooperatives]
9.5 By Distribution Channel [dealers, direct company agronomists, NGO/social enterprises, e-commerce/tele-order]
9.6 By Formulation [solid, liquid, encapsulated, gel-based]
9.7 By Region [Ayeyarwady, Bago, Sagaing, Mandalay, Shan]
10.1 Farmer Landscape and Cohort Analysis [adoption typologies, awareness levels]
10.2 Decision-Making Process for Biofertilizer Adoption [dealer influence, NGO demonstrations, peer learning]
10.3 Program Effectiveness and ROI Analysis [yield gains, cost-benefit ratios, input substitution]
10.4 Gap Analysis Framework [knowledge gaps, infrastructure bottlenecks, policy gaps]
11.1 Trends and Developments in Myanmar Biofertilizers Market [rise of liquid inoculants, digital agronomy bundling, multi-microbe consortia]
11.2 Growth Drivers [soil degradation, government sustainability goals, NGO-led programs, demand for organic exports]
11.3 SWOT Analysis [strengths: low cost; weaknesses: quality inconsistency; opportunities: regenerative practices; threats: subsidized chemical fertilizers]
11.4 Issues and Challenges [CFU compliance, cold-chain logistics for liquid formulations, counterfeit products, dealer training gaps]
11.5 Government Regulations [Fertilizer Law, product registration, label compliance, inspection & sampling]
12.1 Market Size and Future Potential of Digital Agronomy & Advisory Platforms
12.2 Business Models and Revenue Streams [farmer subscription, bundled input-advisory]
12.3 Delivery Models and Type of Services Offered [apps, helplines, village kiosks]
15.1 Market Share of Key Players [local vs. imported, by microbial type]
15.2 Benchmark of Key Competitors (company overview, USP, product portfolio, distribution reach, demo strategies, revenues, margins, clients, tie-ups, pricing, technology, CFU compliance, recent developments)
15.3 Operating Model Analysis Framework [manufacturing, QA, distribution, demo-led selling]
15.4 Gartner Magic Quadrant [placement of local vs. global players]
15.5 Bowman’s Strategic Clock for Competitive Advantage
16.1 Revenues [market projections, drivers of future growth]
17.1 By Market Structure [local vs. imports]
17.2 By Microbial Type [Rhizobium, Azotobacter, PSB, Mycorrhizae, Consortia]
17.3 By Crop/End-Use [paddy, pulses, oilseeds, maize, horticulture]
17.4 By Farmer Segment [large, medium, smallholders, cooperatives]
17.5 By Distribution Channel [dealer, direct, NGO, digital]
17.6 By Formulation [solid, liquid, encapsulated, gel-based]
17.7 By Region [Ayeyarwady, Bago, Sagaing, Mandalay, Shan]
Discuss a Customized Research Scope
Custom research scope • Tailored insights • Industry expertise
Research Methodology
Step 1: Ecosystem Creation
We begin by mapping the Myanmar biofertilizers ecosystem, identifying all demand-side entities (smallholder farmers, large commercial farms, cooperatives, organic clusters, rice millers, and exporters) and supply-side entities (local manufacturers such as Myanma Awba Group, NGOs like Proximity Designs, importers/distributors of global brands, township-level dealers, and government agencies including the Department of Agriculture under MOALI). Based on this mapped ecosystem, we shortlist 5–6 leading biofertilizer providers in Myanmar using criteria such as product portfolio, distribution reach across regions like Ayeyarwady and Mandalay, farmer adoption rates, and presence in NGO/private demonstration programs. Sourcing is carried out through agriculture ministry portals, USDA reports, government trade data, and international development partner publications.
Step 2: Desk Research
An exhaustive desk research phase follows, referencing trusted secondary databases such as the World Bank, FAO, USDA, IMF, Myanmar Trade Portal, and official publications from MOALI. This process helps collate industry-level insights including fertilizer import volumes, cropping patterns, port/container throughput for agricultural inputs, and regulatory licensing requirements. We also analyze company-level information from press releases, annual reports, and donor-funded agronomy program disclosures. Key aspects covered include production capacity of local SMEs, distribution networks, labeling and licensing compliance via MAIRS, and the number of extension programs run by NGOs and private agribusinesses. This forms a robust foundation for understanding the operational environment of Myanmar’s biofertilizers sector.
Step 3: Primary Research
We then conduct structured interviews with stakeholders across the ecosystem, including C-level executives from agribusinesses, representatives of NGOs/social enterprises, township dealers, and extension agents. These interviews validate market hypotheses, cross-check adoption patterns, and reveal farmer-level perceptions of product performance. A bottom-to-top approach is employed to estimate sales volumes and revenue contributions of individual players, which are then aggregated to approximate the overall market structure. To ensure accuracy, disguised interviews are conducted under the guise of potential customers, which allows us to validate data on product pricing, strain CFU guarantees, value chain practices, and distributor margins. This method helps align reported numbers with observed field realities and secondary data.
Step 4: Sanity Check
A rigorous top-to-bottom and bottom-to-top triangulation is applied to validate all findings. Market size models are stress-tested against agricultural statistics (such as rice area at 6.86 million hectares and fertilizer import targets of 1.6 million tons for FY 2024–25). Regulatory licensing data, infrastructure throughput (761,557 TEU containers processed at ports in 2023), and rural energy availability are used as boundary checks to ensure feasibility of production and distribution. The combined validation loop confirms the consistency of assumptions, resulting in a reliable and defensible market analysis for Myanmar’s biofertilizers sector.
See What's Inside the Report
Get a preview of key findings, methodology and report coverage
Frequently Asked Questions
The Myanmar Biofertilizers Market holds strong potential as the country seeks to reduce its reliance on chemical fertilizers. Myanmar imported 1.047 million tons of fertilizer in FY 2023–24 and has set a higher target of 1.6 million tons for FY 2024–25, reflecting heavy dependence on imports. With 6.86 million hectares of rice under cultivation and a total population of over 54.5 million, the adoption of biofertilizers provides a cost-effective and sustainable path to improve soil fertility, reduce import reliance, and enhance yields across rice, pulses, and oilseeds.
The Myanmar Biofertilizers Market features several prominent players. Myanma Awba Group leads as the largest domestic agribusiness with nationwide reach. Proximity Designs plays a key role through farmer training and soil health programs. International players active through distributors include Rizobacter (Bioceres), UPL BioSolutions, Koppert, Lallemand Plant Care, and Novozymes. Other important contributors are T. Stanes & Co., Kan Biosys, Valagro (Syngenta Biologicals), Biostadt, ProFarm (MBI), and Map Pacific, along with local SMEs and township-scale fermenters.
Key growth drivers include the expansion of Myanmar’s agricultural base, with rice production recorded at 11.95 million metric tons in 2023, supporting high nutrient demand. Government-backed fertilizer import targets ensure organized distribution channels, which biofertilizers can leverage for market entry. Additionally, Myanmar’s population of 54.5 million sustains a large farming community, while NGO and private agronomy networks are expanding farmer demonstrations, particularly in rice and pulses belts. These combined macro and institutional factors create a conducive environment for biofertilizer adoption.
The Myanmar Biofertilizers Market faces significant challenges, including infrastructure and power constraints. The World Bank reports a generation shortfall of over 2.5 GW, which affects fermentation and cold-chain storage for liquid inoculants. Logistics bottlenecks also persist, with container throughput of 761,557 TEU in 2023 far below regional peers, slowing import of inputs and packaging. Additionally, compliance requirements under the Fertilizer Law and the MAIRS portal demand strict Myanmar-language labeling and detailed dossiers, increasing time-to-market for new entrants and posing regulatory hurdles.
License Options
PDF + Excel
Complete report package
$4,000
Excel Only
Data and analytics
$2,500
Custom Sections
Starts from $100
$0