Myanmar Logistics and Warehousing Market Outlook to 2029
By Mode of Transport, By Type of Warehousing, By End-User Industries, By International and Domestic Freight, and By Region
Report Overview
Report Code
TDR0194
Coverage
Asia
Published
June 2025
Pages
80
Flexible Purchase Options
Select and purchase only the chapters you need for your strategic decisions
On This Page
Report Overview
The report titled “Myanmar Logistics and Warehousing Market Outlook to 2029 – By Mode of Transport, By Type of Warehousing, By End-User Industries, By International and Domestic Freight, and By Region” provides a comprehensive analysis of the logistics and warehousing sector in Myanmar. The report covers an overview and genesis of the industry, overall market size in terms of revenue, market segmentation, key trends and developments, regulatory landscape, customer level profiling, issues and challenges, and comparative landscape including competition scenario, cross comparison, opportunities and bottlenecks, and company profiling of major logistics and warehousing service providers in the country.
Report Coverage
Verified Market Sizing
Multi-layer forecasting with historical data and 5–10 year outlook
Deep-Dive Segmentation
Cross-sectional analysis by product type, end user, application and region
Competitive Benchmarking & Positioning
Market share, operating model, pricing and competition matrices
Actionable Insights & Risk Assessment
High-growth white spaces, underserved segments, technology disruptions and demand inflection points
Review Methodology & Data Structure
Preview report structure, data sources and research framework
Executive Summary
The report titled “Myanmar Logistics and Warehousing Market Outlook to 2029 – By Mode of Transport, By Type of Warehousing, By End-User Industries, By International and Domestic Freight, and By Region” provides a comprehensive analysis of the logistics and warehousing sector in Myanmar. The report covers an overview and genesis of the industry, overall market size in terms of revenue, market segmentation, key trends and developments, regulatory landscape, customer level profiling, issues and challenges, and comparative landscape including competition scenario, cross comparison, opportunities and bottlenecks, and company profiling of major logistics and warehousing service providers in the country. The report concludes with future market projections based on revenue, by segment and region, cause and effect relationships, and success case studies highlighting major opportunities and cautions.
Myanmar Logistics and Warehousing Market Overview and Size
The Myanmar logistics and warehousing market reached a valuation of MMK 3.7 Trillion (approx. USD 1.75 Billion) in 2023, driven by trade liberalization, infrastructure development, and increased regional connectivity under initiatives like the China-Myanmar Economic Corridor (CMEC). The market is characterized by key players such as Kerry Logistics, DB Schenker, CEVA Logistics, RMA Group, and DHL. These companies stand out for their diversified logistics solutions, regional networks, and investment in last-mile delivery and cold chain infrastructure.
In 2023, Kerry Logistics expanded its warehouse footprint in Yangon Industrial Zone, integrating digital inventory management systems to improve efficiency and reduce turnaround times. Yangon, Mandalay, and Thilawa SEZ remain key logistic hubs due to their proximity to ports, trade routes, and industrial activity.
Market Size for Myanmar Logistics and Warehousing Industry on the Basis of Revenue in USD Billion, 2018-2024

What Factors are Leading to the Growth of Myanmar Logistics and Warehousing Market:
Trade Expansion and Regional Connectivity: Myanmar's strategic geographic location linking Southeast Asia, China, and India has positioned it as a crucial transit route. Under the Belt and Road Initiative, investments in highways, ports, and rail are supporting cross-border trade. In 2023, over 62% of Myanmar’s freight volume was linked to international trade activity, particularly with China and Thailand.
Rising Demand from E-Commerce and Retail: With over 7 million digital buyers in 2023 and growing smartphone penetration, Myanmar’s e-commerce sector is driving demand for urban warehousing and last-mile delivery services. Online platforms like Shop.com.mm and rgo47 have increased their reliance on 3PL providers to ensure timely and efficient deliveries, fueling logistics growth.
Government Policy and SEZ Development: The Myanmar Investment Commission (MIC) has approved several incentives for logistics companies including tax holidays, land lease support, and foreign ownership allowances in SEZs. These reforms have encouraged private investments and partnerships in logistics infrastructure development.
Which Industry Challenges Have Impacted the Growth for Myanmar Logistics and Warehousing Market
Underdeveloped Infrastructure: Despite ongoing investments, Myanmar still faces major infrastructure limitations across roadways, railways, and port connectivity. According to industry estimates, over 45% of freight routes suffer from poor road conditions, increasing transit time and vehicle wear-and-tear. These bottlenecks hamper efficient cargo movement, especially in rural and remote regions.
Political Instability and Security Risks: The political landscape has created an unpredictable business environment. As per a 2023 report, nearly 30% of logistics firms reported disruptions in operations due to security-related concerns or regional transport restrictions. This poses a major hurdle for foreign investors and large-scale supply chain expansion.
Fragmented Market and Informal Operators: The dominance of small-scale and informal logistics providers makes standardization and service quality inconsistent. Approximately 60% of local logistics businesses operate without formal licenses or adherence to global standards, creating inefficiencies, especially in time-sensitive or high-value goods transportation.
What are the Regulations and Initiatives which have Governed the Market:
Myanmar Investment Law and Logistics Liberalization: Under the Myanmar Investment Law, 100% foreign ownership is permitted in the logistics sector (excluding road transport). This has encouraged the entry of regional logistics players and led to joint ventures in areas like last-mile delivery and warehousing. As of 2023, over 20 new FDI applications were approved under this framework, signaling increasing investor interest.
SEZ and Free Trade Zone Incentives: The government has prioritized the development of Thilawa, Dawei, and Kyaukphyu SEZs, offering tax holidays, duty exemptions, and expedited customs processing. These areas are expected to anchor the country's future logistics infrastructure. In 2023, Thilawa SEZ alone handled 40% of Myanmar’s containerized trade.
Customs Modernization Program: Supported by international bodies like the World Bank and JICA, Myanmar is implementing an automated customs clearance system (MACCS) to streamline cross-border processes. By the end of 2023, clearance time at major ports reduced by 20–25%, leading to improved cargo throughput.
Myanmar Logistics and Warehousing Market Segmentation
By Mode of Transport: Road transport dominates Myanmar's logistics sector due to its flexibility, cost-efficiency, and deep penetration into rural and semi-urban areas. Trucks and light commercial vehicles are widely used for both short-haul and long-distance cargo. However, road logistics often face delays due to poor infrastructure in interior regions. Sea and inland waterways play a significant role, especially for international freight, with ports like Yangon and Thilawa handling the bulk of import/export cargo. Air freight, while limited in volume, is crucial for time-sensitive and high-value goods, particularly pharmaceuticals and electronics. Rail logistics remains underutilized due to outdated infrastructure but is gaining attention with ongoing modernization plans under BRI initiatives.
By Type of Warehousing: General warehousing services make up the largest segment, offering storage for non-specialized goods like garments, retail inventory, and household items. These warehouses are common near industrial clusters and consumption hubs such as Yangon, Mandalay, and Bago.
Cold chain warehousing is an emerging segment, driven by demand from the food processing, fisheries, and pharmaceutical industries. In 2023, cold storage facilities grew significantly, particularly around ports and SEZs.
Bonded warehouses are primarily used for re-export trade and imported goods awaiting duty clearance, mostly in SEZs and port cities.By End-User Industries: The retail and FMCG sectors are major users of logistics and warehousing, contributing significantly due to the rise in modern trade formats and e-commerce penetration. Agriculture and food processing industries rely on bulk storage and temperature-controlled supply chains to maintain quality during transport and storage. Pharmaceuticals and healthcare logistics have also grown, driven by new compliance requirements and increasing urban demand. Automotive and electronics sectors continue to rely on organized warehousing for spare parts distribution and just-in-time logistics.
Competitive Landscape in Myanmar Logistics and Warehousing Market
The Myanmar logistics and warehousing market is moderately fragmented, with a mix of international 3PL players, regional operators, and local logistics firms. However, recent government liberalization and infrastructure upgrades have encouraged the entry of global players and digital logistics startups, making the ecosystem more competitive and diversified.
Company Name | Founding Year | Original Headquarters |
Premium Distribution Co., Ltd. | 2003 | Yangon, Myanmar |
Frozen Warehousing & Logistics (FWL) | 2015 | Yangon, Myanmar |
KOSPA Limited (JV of Yoma Strategic and Kokubu Group) | 2014 | Yangon, Myanmar / Tokyo, Japan |
Cold Chain Logistics Myanmar Co., Ltd. | 2016 | Yangon, Myanmar |
Eastern Alliance Co., Ltd. | 2001 | Yangon, Myanmar |
MyanCold Logistics Co., Ltd. | 2019 | Yangon, Myanmar |
Yoma Logistics (Cold Chain Division) | 2013 | Yangon, Myanmar |
Kaung Swann Htet Trading Co., Ltd. | 2005 | Yangon, Myanmar |
DHL Global Forwarding Myanmar | 1969 (MM: ~2014) | Bonn, Germany |
Kuehne + Nagel Myanmar | 1890 (MM: ~2015) | Schindellegi, Switzerland |
DB Schenker Myanmar | 1872 (MM: ~2013) | Essen, Germany |
Maersk Myanmar (Cold Chain Services) | 1904 (MM: ~2000s) | Copenhagen, Denmark |
CEVA Logistics Myanmar | 2006 (MM: ~2015) | Marseille, France |
Agility Logistics Myanmar | 1979 (MM: ~2013) | Kuwait City, Kuwait |
Some of the recent competitor trends and key information about major players include:
Kerry Logistics: A major logistics provider with strong presence across ASEAN, Kerry expanded its warehousing space in Yangon by 30% in 2023, focusing on e-commerce fulfillment and pharma logistics. The company introduced temperature-controlled facilities and digital inventory systems to improve operational efficiency.
RMA Group: RMA has invested in fleet expansion and last-mile capabilities, especially for FMCG and cold chain services. In 2023, the company began trial runs of EV delivery vehicles in Yangon and Mandalay, positioning itself as a sustainable logistics provider.
DB Schenker: Known for its multimodal logistics solutions, DB Schenker experienced a 22% increase in demand for cross-border trucking services with Thailand and China in 2023. The company is investing in smart freight tracking and warehouse automation solutions to boost regional competitiveness.
CEVA Logistics: CEVA strengthened its Myanmar operations with the launch of a new 3,000 sqm bonded warehouse at Thilawa SEZ. The facility supports automotive, industrial, and retail clients, focusing on integrated logistics and customs clearance services.
Ever Flow River Group (EFR): One of Myanmar's largest domestic logistics players, EFR operates across freight forwarding, warehousing, and customs brokerage. In 2023, it partnered with regional fintech providers to offer digitized payment solutions for SMEs, enabling faster and more secure transactions.
Yamato Transport: The Japanese logistics giant has been focusing on cold chain delivery and high-precision last-mile services in urban areas. Their 2023 collaboration with local courier partners helped expand network coverage to over 120 townships, improving rural connectivity.
What Lies Ahead for Myanmar Logistics and Warehousing Market?
The Myanmar logistics and warehousing market is projected to witness steady growth through 2029, driven by regional trade expansion, infrastructure upgrades, and digital transformation. The sector is expected to grow at a moderate CAGR as both domestic and international firms invest in supply chain efficiency and connectivity.
Expansion of Cross-Border Trade and Economic Corridors: As regional cooperation deepens under the China-Myanmar Economic Corridor (CMEC), India–Myanmar–Thailand Trilateral Highway, and ASEAN connectivity programs, Myanmar is poised to become a strategic logistics hub. Increased cross-border trade will drive demand for integrated logistics and multimodal transport systems.
Digitalization and Automation of Warehousing: The adoption of Warehouse Management Systems (WMS), Internet of Things (IoT), and automation tools is expected to rise significantly by 2029. These technologies will enhance inventory accuracy, reduce human error, and increase throughput across major logistics hubs like Yangon, Thilawa, and Mandalay.
Growth of Cold Chain and Pharmaceutical Logistics: With growing demand for quality healthcare, food exports, and vaccines, cold chain logistics will emerge as a high-growth subsegment. Government mandates on food safety, pharma compliance, and vaccine distribution will push investment in refrigerated storage and temperature-controlled distribution networks.
Increased Role of 3PL and E-Commerce Fulfillment: As e-commerce continues to expand, there will be a sharp rise in third-party logistics (3PL) providers offering warehousing, last-mile delivery, and reverse logistics. By 2029, it is anticipated that 3PLs will manage more than 40% of e-commerce logistics volumes, especially in urban areas.
Future Outlook and Projections for Myanmar Logistics and Warehousing Market on the Basis of Revenues in USD Billion, 2024-2029

Myanmar Logistics and Warehousing Market Segmentation
- By Mode of Transport:
o Road Freight
o Rail Freight
o Air Freight
o Sea and Inland Waterways
o Multimodal Logistics - By Type of Warehousing:
o General Warehousing
o Bonded Warehousing
o Cold Chain Warehousing
o Distribution Centers
o Container Freight Stations (CFS)
o E-commerce Fulfillment Centers - By End-User Industry:
o Retail & FMCG
o Agriculture & Food Processing
o Pharmaceuticals & Healthcare
o Automotive
o Electronics & Consumer Durables
o Industrial & Manufacturing
o Apparel and Textiles - By Freight Flow:
o Domestic Logistics
o International / Cross-Border Logistics
o Import-Oriented
o Export-Oriented
o Transit Cargo - By Ownership Structure:
o Third-Party Logistics Providers (3PL)
o In-House Logistics / Captive Units
o Joint Ventures
o Government-Operated Facilities - By Region:
o Yangon
o Mandalay
o Bago
o Shan
o Ayeyarwady
o Thilawa SEZ
Players Mentioned in the Report:
Freight Forwarding Companies
- Golden Star Myanmar Company Limited
- Radius Myanmar Services Co., Ltd.
- Success Partners Co., Ltd.
- Reliance Myanmar Logistics Co., Ltd.
- M5 International Co., Ltd.
- West East Freight Forwarding Co., Ltd.
- ZNT Transportation & Logistic
- Wings of Golden Eagle Freight Forwarding Services Co., Ltd.
- DB Schenker Myanmar
- Rhenus Myanmar Co., Ltd.
- DHL Global Forwarding Myanmar
- Kuehne + Nagel Myanmar
- JSL Global Myanmar Co., Ltd.
Warehousing Companies
- Unilink Logistic Warehouse (Haven Group)
- CJ Logistics RT Myanmar
- Pebsteel Myanmar Warehouses
- Zamil Steel Myanmar Warehouses
- CEA Project Logistics (Myanmar)
- DB Schenker Myanmar
- Rhenus Myanmar Co., Ltd.
- DHL Global Forwarding Myanmar
- Kuehne + Nagel Myanmar
E-Commerce Logistics Companies
- Yusen Logistics Myanmar
- DHL Express Myanmar
- Ninja Van Myanmar
- Local last-mile providers (e.g., Mobile-based couriers)
- FreightAmigo (digital logistics platform)
Express Logistics Companies
DHL Express Myanmar
FedEx Myanmar
Aramex Myanmar
UPS Myanmar
Ninja Van Myanmar
Key Target Audience:
- Logistics and Transportation Companies
- Warehousing and Cold Chain Providers
- E-commerce and Retail Companies
- International Development Organizations
- Industrial and SEZ Developers
- Government Ministries and Regulatory Bodies (e.g., Ministry of Transport and Communications)
- Investors and Private Equity Firms
- Research and Consulting Institutions
Time Period:
- Historical Period: 2018–2023
- Base Year: 2024
- Forecast Period: 2024–2029
Explore Flexible Purchase Options or Have Limited Budget?
Pay only for relevant chapters • Customizable report sections
Table of Contents
Choose individual sections to purchase. Mix and match as you like.
4.1. Macroeconomic framework for Myanmar Including GDP (2018-2024), GDP Growth (2018-2024), GDP Contribution by Sector
4.2. Logistics Sector Contribution to GDP and how the contribution has been changing in the historical assessment
4.3. Ease of Doing Business in Myanmar
4.4. LPI Index of Myanmar and Improvements in the last 10-15 Years
4.5. Custom Procedure and Custom Charges in Myanmar Logistics market
5.1. Landscape of Investment Parks and Free Trade Zones in Myanmar
5.2. Current Scenario for Logistics Infrastructure in Myanmar
5.3. Road Infrastructure in Myanmar including Road Network, Toll Charges and Toll Network, Major Goods Traded through Road, Major Flow Corridors for Road (Inbound and Outbound)
5.4. Air Infrastructure in Myanmar including Total Volume Handled, FTK for Air Freight, Major Inbound and Outbound Flow Corridors, Major Goods traded through Air, Number of Commercial and passenger Airports, Air Freight Volume by Ports and other Parameters
5.5. Sea Infrastructure in Myanmar including Total Volume Handled, FTK for Sea Freight, Major Inbound and Outbound Flow Corridors, Major Goods Traded through Sea, Number of Ports for Coastal and Ocean Freight, Number of Vessels, Sea Freight Volume by Ports and other Parameters
5.6. Rail Infrastructure in Myanmar including Total Volume Handled, FTK for Rail Freight, Major Inbound and Outbound Flow Corridors, Major Goods Traded through Rail and others
6.1. Basis Revenues, 2018-2024P
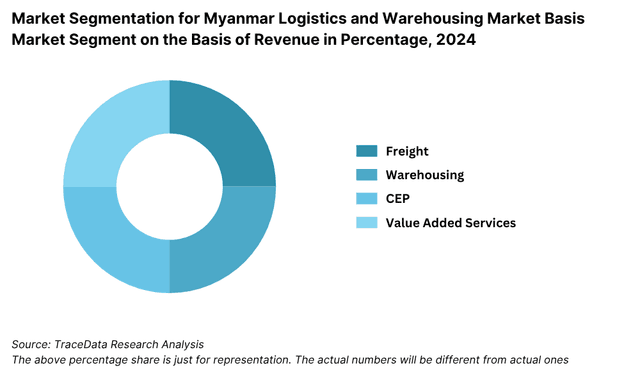
7.1. By Segment (Freight Forwarding, Warehousing, CEP and Value-Added Services), 2018-2024P
7.2. By End User Industries, 2018-2024P
8.1. Market Overview and Genesis
8.2. Myanmar Freight Forwarding Market Size by Revenues, 2018-2024P
8.3. Myanmar 3PL Freight Forwarding Market Segmentation, 2018-2024P
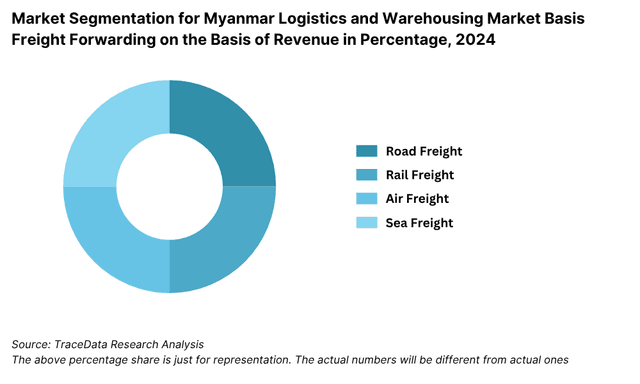
8.3.1. By Mode of Freight Transport (Road, Sea, Air and Rail), 2018-2024P
8.3.1.1. Price per FTK for Road/Air/Sea and Rail in Myanmar
8.3.1.2. Road Freight (Domestic and International Volume, FTK and Revenue; Number of Registered Vehicles)
8.3.1.3. Road Freight Domestic and International Corridors
8.3.1.4. Ocean Freight (Domestic and International Volume, FTK and Revenue; Volume by Commodity; Sea Ports Key Statistics)
8.3.1.5. Air Freight (Domestic and International Volume, FTK and Revenue)
8.3.1.6. Rail Freight (Domestic and International Volume, FTK and Revenue; Volume by Commodity and Region)
8.3.1.7. Export-Import Scenario (Value by Mode of Transport, Commodity and Country; Volume by Principal Commodities)
8.3.2. By Intercity Road Freight Corridors, 2018-2024P
8.3.3. By International Road Freight Corridors, 2018-2024P
8.3.4. By End User (Industrial, FMCG, F&B, Retail and Others), 2018-2024P
8.4. Snapshot of Freight Truck Aggregators in Myanmar Including Company Overview, USP. Business Strategies, Future Plans, Business Model, Number of Fleets, Margins/Commission, Number of Booking, Major Clients, Average Booking Amount, Major Routes and others
8.5. Competitive Landscape in Myanmar Freight Forwarding Market, 2021
8.5.1. Heat Map of Major Players in Myanmar Freight Forwarding on the Basis of Service offering
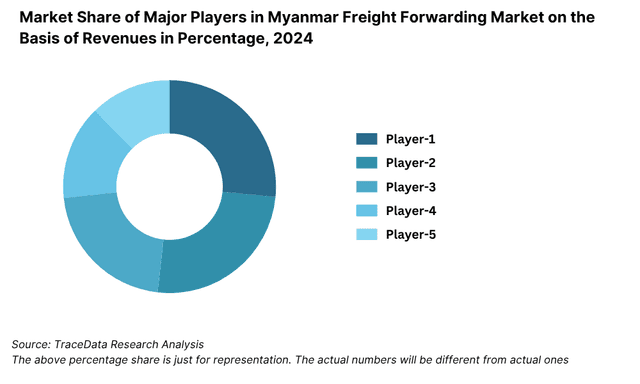
8.5.2. Market Share of Maior Players in Myanmar Freight Forwarding Market, 2023
8.5.3. Cross Comparison of Major Players in Freight Forwarding Companies on the Basis of Parameters including Volume of Road Freight, Inception Year, Number of Fleets (Owned and Subcontracted), Fleets by Type, Occupancy Rate, Number of Employees, Major Route Network, Major Clients, Revenues, Volume of Sea Freight, Volume of Air Freight, USP, Business Strategy, Technology, (2023)
8.6. Myanmar 3PL Freight Forwarding Future Market Size by Revenues, 2025-2029
8.7. Myanmar Freight Forwarding Market Segmentation, 2025-2029
8.7.1. Future Market Segmentation by Mode of Freight Transport (Road, Sea, Air and Rail), 2025-2029
8.7.2. Future Market Segmentation by International Road Freight Corridors (China, Thailand and Myanmar), 2025-2029
8.7.3. Future Market Segmentation by End User (Industrial, FMCG, F&B, Retail and Others), 2025-2029
9.1. Market Overview and Genesis
9.2. Value Chain Analysis in Myanmar Warehousing Market including entities, margins, role of each entity, process flow, challenges and other aspects
9.3. Myanmar Warehousing Market Size on the Basis of Revenues and Warehousing Space, 2018-2024P
9.4. Myanmar 3PL Warehousing Segmentation
9.4.1. Myanmar Warehousing Revenue by Business Model (Industrial/Retail, ICD/CFS and Cold Storage), 2018-2024P
9.4.2. Myanmar Warehousing By Type of Warehouse (General, Open Yard, Freezer/Chiller, Ambient and Bonded Warehouses), 2018-2024P
9.4.3. Myanmar Warehousing Revenue by End User (Industrial & Construction, FMCG, Retail, Food & Beverage and Others), 2018-2024P
9.4.4. 3PL Warehousing Space by Region, 2024P
9.5. Competitive Landscape in Myanmar 3PL Warehousing Market
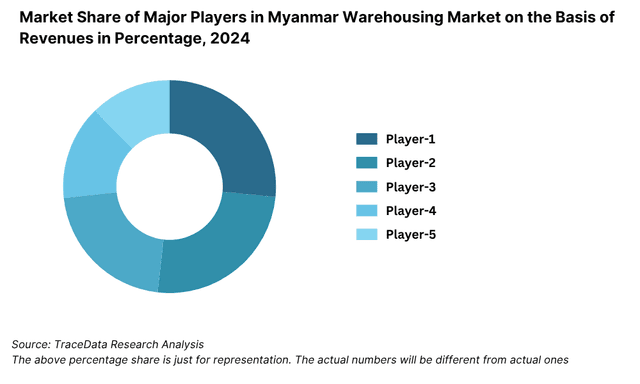
9.5.1. Market share of Top 10 Companies in Myanmar Warehousing Market, 2023
9.5.2. Cross Comparison of Top 10 3PL Warehousing Companies on the Basis of Parameters including Company Overview, USP, Business Strategy, Future Plans, Technology, Revenues from Warehousing, Number of Warehouses, Warehousing Space, Location of Warehouses, Type of Warehouses, Occupancy Rate, Rental Rates, Clients and others, (2023)
9.6. Myanmar Warehousing Future Market Size on the Basis of Revenues, 2025-2029
9.7. Myanmar Warehousing Market Future Segmentation
9.7.1. Myanmar Warehousing Revenue by Business Model (Industrial/Retail, ICD/CFS and Cold Storage), 2025-2029
9.7.2. Myanmar Warehousing Revenue By Type of Warehouse (General, Open Yard, Freezer/Chiller, Ambient and Bonded Warehouses), 2025-2029
9.7.3. Myanmar Warehousing Revenue by End User (Industrial & Construction, FMCG, Retail, Food & Beverage and Others), 2025-2029
10.1. Market Overview and Genesis
10.2. Value Chain Analysis in Myanmar CEP Market including entities, margins, role of each entity, process flow, challenges and other aspects
10.3. Revenue Composition and Contribution Between First Mile/Mid Mile and Last Mile Delivery-Analysis for Domestic and International Shipments
10.4. Myanmar CEP Market Size on the Basis of Revenues and Shipments, 2018-2024P
10.5. Myanmar CEP Market Segmentation, 2021
10.5.1. Segmentation by Mails and Documents, E-Commerce Shipments and Express Cargo, 2023-2024P
10.5.2. Segmentation by International and Domestic Express, 2023-2024P
10.5.3. Segmentation by B2B, B2C and C2C, 2023-2024P
10.5.4. Segmentation by Period of Delivery, 2023-2024P
10.6. Competitive Landscape in 3PL Market, 2021
10.6.1. Overview and Genesis, Market Nature, Market Stage and Major Competing Parameters
10.6.2. Market Share of Companies in Myanmar CEP Market on the Basis of Revenues/Number of Shipments, 2023
10.6.3. Market Share of Top 5 Companies in Myanmar E-Commerce Shipment Market on the Basis of Revenues/Number of Shipments, 2023
10.6.4. Cross Comparison of Top 10 Myanmar CEP Companies on the Basis of Parameters including Company Overview, USP, Business Strategy, Future Plans, Technology, Number of last Mile Delivery Shipments, Revenues, Major Clients, Number of Fleets, Number of Employees, Number of Riders, Number of Pin Code Served, Major Service Offering and others
10.7. Myanmar CEP Market Size on the Basis of Revenues and Shipments, 2025-2029
10.8. Myanmar CEP Market Segmentation
10.8.1. Segmentation by Mails and Documents, E-Commerce Shipments and Express Cargo, 2025-2029
10.8.2. Segmentation by International and Domestic Express, 2025-2029
10.8.3. Segmentation by B2B, B2C and C2C, 2025-2029
10.8.4. Segmentation by Period of Delivery, 2025-2029
11.1. Customer Cohort Analysis and End User Paradigm for Different Industry Verticals under Logistics Sector (Telecommunications, FMCG, Automotive, Apparel, F&B, Construction and Pharmaceuticals)
11.2. Understanding on Logistics Spend by End User, 2023-2024P
11.3. End User Preferences in terms of In-House or Outsourcing Logistics Services and Reason for Selection; Segregate this by Size of Company on the Basis of Revenues
11.4. Major Logistics Company who are Specialized in Serving Each Type of End User (Telecommunications, FMCG, Apparel, F&B, Construction and Pharmaceuticals)
11.5. Detailed Landscape of Each End Users across Parameters including Major Products Manufactured and Traded, Emerging Products, Type of Services Required, and Type of Services Outsourced, Major Companies, Contract Duration, Likelihood to Recommend, Market Orientation, Major Clusters, Type of Sourcing Preference, Pain Points, Facilities/Services Required, Future Outlook. Market Size for End User Industry Vertical with Growth Rate, 2018-2024P
12.1. Basis Revenues, 2025-2029
13.1. By Segment (Freight Forwarding, Warehousing, CEP and Value-Added Services), 2025-2029
13.2. By End User Industries, 2025-2029
13.3. Recommendation
13.4. Opportunity Analysis
Discuss a Customized Research Scope
Custom research scope • Tailored insights • Industry expertise
Research Methodology
Step 1: Ecosystem Creation
Map the ecosystem and identify all the demand-side (e.g., e-commerce players, FMCG companies, manufacturers, exporters/importers) and supply-side (e.g., 3PL providers, warehousing operators, freight forwarders) entities within the Myanmar Logistics and Warehousing Market.
Basis this ecosystem, we shortlisted leading 6–8 logistics providers and infrastructure operators in the country based on their operational presence, infrastructure capacity, and service coverage.
Sourcing is conducted through government publications, regional transport bodies, industry articles, and proprietary databases to build an initial understanding of the sector.
Step 2: Desk Research
We engage in an extensive desk research process leveraging multiple secondary sources including industry reports, logistics association data, UN Comtrade, World Bank Logistics Performance Index, and corporate press releases.
This enables us to assess variables such as revenue contribution by segment, infrastructure availability, growth trends, import/export volumes, trade routes, and regional distribution hubs.
Company-level data (warehousing capacity, fleet size, SEZ presence) is drawn from public disclosures, annual reports, official websites, and investor presentations.
Step 3: Primary Research
Conducted detailed interviews with supply chain heads, senior executives from 3PL companies, warehouse developers, port authorities, and policy stakeholders.
These interviews help validate our desk findings, understand industry bottlenecks, and gather first-hand operational and financial insights.
A bottom-up approach is undertaken to estimate cargo volume handled by major providers, which is then aggregated to determine national-level logistics volume and value.
Disguised interviews were also executed with operators across Yangon, Thilawa, and Mandalay regions, posing as prospective clients to validate service pricing, handling time, and fleet availability.
Step 4: Sanity Check
A rigorous top-down and bottom-up market triangulation exercise is conducted.
Multiple scenario models and historical growth trend comparisons are used to ensure accuracy.
Cross-verification is done with trade statistics, freight index data, and regional market benchmarks to validate assumptions and projected CAGR.
See What's Inside the Report
Get a preview of key findings, methodology and report coverage
Frequently Asked Questions
The Myanmar logistics and warehousing market reached an estimated valuation of MMK 3.7 Trillion (USD 1.75 Billion) in 2023, with strong growth potential through 2029. Factors such as regional trade integration, SEZ development, rising e-commerce demand, and growing investments in cold chain and warehousing infrastructure are expected to drive expansion. Myanmar’s strategic location as a trade bridge between Southeast Asia, China, and India further enhances its long-term logistics potential.
Key players operating in the market include Kerry Logistics, DB Schenker, RMA Group, CEVA Logistics, Ever Flow River Group, and Yamato Transport. These companies have established a significant footprint across major logistics corridors, offering services such as warehousing, freight forwarding, cold chain logistics, and last-mile delivery. Their investments in digital infrastructure and regional coverage have positioned them as market leaders.
Major growth drivers include infrastructure development under SEZ programs, growing e-commerce activity, cold chain demand from agro and pharma sectors, and regional trade corridors under Belt and Road and ASEAN initiatives. In addition, government reforms encouraging foreign direct investment (FDI) in logistics and the push for digital transformation are supporting sector modernization.
The market faces several challenges, including poor road and rail infrastructure, fragmentation of logistics services, and political and regulatory instability. Additionally, limited cold chain availability, low digital adoption, and lack of skilled labor hinder operational efficiency. Informal logistics operations and inconsistent service standards remain barriers to scaling up organized logistics in the country.
License Options
PDF + Excel
Complete report package
$4,000
Excel Only
Data and analytics
$2,500
Custom Sections
Starts from $100
$0