Netherlands Alcoholic Drinks Market Outlook to 2029
By Branded and Local Players, By Product Type (Beer, Wine, Spirits, Ready-to-Drink Beverages, Ciders, and Other Alcoholic Beverages), By Age Group, By Distribution Channel, and By Region
Report Overview
Report Code
TDR0113
Coverage
Europe
Published
January 2025
Pages
80
Flexible Purchase Options
Select and purchase only the chapters you need for your strategic decisions
On This Page
Report Overview
The report titled "Netherlands Alcoholic Drinks Market Outlook to 2029 - By Branded and Local Players, By Product Type (Beer, Wine, Spirits, Ready-to-Drink Beverages, Ciders, and Other Alcoholic Beverages), By Age Group, By Distribution Channel, and By Region" provides a comprehensive analysis of the Dutch alcoholic drinks industry. This report covers an overview and genesis of the industry, overall market size in terms of revenue, market segmentation, emerging trends and developments, regulatory landscape, consumer profiles, challenges, and the competitive landscape, including competition scenarios, opportunities, and profiles of key players in the market.
Report Coverage
Verified Market Sizing
Multi-layer forecasting with historical data and 5–10 year outlook
Deep-Dive Segmentation
Cross-sectional analysis by product type, end user, application and region
Competitive Benchmarking & Positioning
Market share, operating model, pricing and competition matrices
Actionable Insights & Risk Assessment
High-growth white spaces, underserved segments, technology disruptions and demand inflection points
Review Methodology & Data Structure
Preview report structure, data sources and research framework
Executive Summary
The report titled "Netherlands Alcoholic Drinks Market Outlook to 2029 - By Branded and Local Players, By Product Type (Beer, Wine, Spirits, Ready-to-Drink Beverages, Ciders, and Other Alcoholic Beverages), By Age Group, By Distribution Channel, and By Region" provides a comprehensive analysis of the Dutch alcoholic drinks industry. This report covers an overview and genesis of the industry, overall market size in terms of revenue, market segmentation, emerging trends and developments, regulatory landscape, consumer profiles, challenges, and the competitive landscape, including competition scenarios, opportunities, and profiles of key players in the market. The report concludes with future market projections based on sales revenue, product types, age groups, and success stories that highlight major opportunities and challenges within the market.
Netherlands Alcoholic Drinks Market Overview and Size
The Netherlands alcoholic drinks market reached a valuation of EUR 10 billion in 2023, driven by increasing consumer spending on premium and craft beverages, the influence of European tourism, and a growing interest in sustainable and innovative products. The market is led by key players like Heineken, Bavaria, Grolsch, and Diageo, which are well-known for their strong brand presence, extensive distribution networks, and innovative product offerings that cater to both local preferences and international tastes.
In 2023, Heineken introduced a new line of organic and low-alcohol beer options aimed at health-conscious and environmentally aware consumers, seeking to tap into the growing demand for sustainable products. Major regions such as North Holland and South Holland are prominent in market growth due to their high population density, higher disposable incomes, and significant contributions from the hospitality sector, all contributing to the overall positive trajectory of the market.
Market Size for Netherlands Alcoholic Drinks Industry on the Basis of Revenue in EUR Billion, 2018-2024

Factors Leading to the Growth of the Netherlands Alcoholic Drinks Market:
Rising Health-Conscious Consumer Base: With a growing focus on wellness, Dutch consumers increasingly seek low-alcohol or non-alcoholic options. In 2023, low-alcohol and alcohol-free beverages made up nearly 20% of total alcoholic drink sales, catering to younger and health-conscious demographics. This trend is also reflected in the rising popularity of craft beers and organic wines.
Tourism and Hospitality Boom: The Netherlands, especially cities like Amsterdam and Rotterdam, attracts millions of tourists each year, significantly contributing to on-premise alcoholic beverage consumption. In 2023, over 30% of total alcohol sales came from on-premise locations such as bars and restaurants, driven by a robust tourism industry and a lively nightlife culture.
Premiumization and Craft Trends: Dutch consumers are increasingly inclined toward premium and craft beverages, with demand for locally sourced, artisanal options rising steadily. In 2023, premium brands accounted for over 25% of sales, with spirits and craft beers seeing strong growth as consumers look for unique and high-quality drinking experiences.
Which Industry Challenges Have Impacted the Growth for Netherlands Alcoholic Drinks Market
Quality and Health Concerns: Consumer awareness about the health risks associated with alcohol consumption has led to a cautious approach toward traditional alcoholic products. According to recent surveys, approximately 35% of Dutch consumers are reducing their alcohol intake due to health concerns. This shift impacts sales of high-alcohol-content beverages and pushes producers to invest in low-alcohol and non-alcoholic options, increasing costs and complicating production processes.
Regulatory Constraints: Strict regulations on alcohol marketing and high excise taxes have created significant barriers for growth in the Netherlands' alcoholic drinks market. In 2023, new advertising restrictions targeted at protecting young consumers were implemented, reducing advertising reach by approximately 12% for certain brands. Additionally, compliance with these regulations adds operational costs, particularly affecting smaller brands and new market entrants.
Sustainability Pressures and Production Costs: With rising demand for sustainable and organic products, many manufacturers face increased production costs to meet environmentally friendly standards. In 2023, about 30% of Dutch consumers preferred sustainably produced alcoholic beverages, yet this shift adds costs and logistical complexities for producers, limiting competitive pricing for these options.
What are the Regulations and Initiatives Governing the Netherlands Alcoholic Drinks Market:
Advertising and Marketing Restrictions: The Dutch government enforces strict advertising regulations to limit the exposure of alcohol advertisements, especially among young audiences. In 2023, new restrictions were introduced that restrict alcohol advertisements on public transport and online platforms targeted at younger demographics. Approximately 15% of alcoholic beverage brands reported a decline in marketing reach due to these restrictions, emphasizing the regulatory impact on brand visibility.
Excise Taxes on Alcoholic Beverages: The Netherlands imposes significant excise taxes on alcoholic beverages, contributing to higher retail prices, particularly for high-alcohol-content products. In 2023, excise tax rates were increased by 4%, impacting both producers and consumers, as higher taxes often lead to increased shelf prices, thereby potentially reducing demand among price-sensitive consumers.
Sustainability Incentives and Certifications: The Dutch government has introduced incentives for sustainability in the alcoholic drinks market, encouraging producers to adopt eco-friendly practices. These incentives include grants for sustainable packaging, reduced taxes on low-alcohol or organic beverages, and certifications for eco-friendly production practices. In 2023, approximately 20% of new product launches were certified as sustainable, reflecting a positive response to these initiatives within the market.
Netherlands Alcoholic Drinks Market Segmentation
By Market Structure: The Netherlands alcoholic drinks market is segmented between local producers and international brands. Local breweries and distilleries dominate the craft segment due to their focus on unique, locally sourced ingredients and regional flavors. These producers often emphasize sustainability and authenticity, appealing to environmentally conscious consumers. International brands hold a significant share due to their strong distribution networks, established brand reputation, and extensive marketing reach. Consumers often turn to these brands for reliability and a wide variety of products across different alcoholic beverage types.
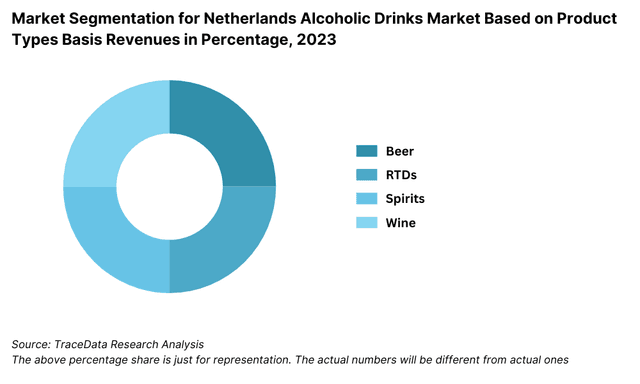
By Product Type: Beer is the leading segment in the Dutch alcoholic drinks market, driven by the popularity of both mainstream and craft options. Craft beers, in particular, have experienced rapid growth due to the rising consumer preference for artisanal and locally produced beverages. Spirits, including gin and vodka, follow closely, benefiting from the recent trend toward cocktails and mixology culture. Wine also holds a substantial share, particularly among older demographics and health-conscious consumers, who favor organic and low-alcohol wine options.
Market Segmentation for Netherlands Alcoholic Drinks Market Based on Product Types Basis Revenues in Percentage, 2023
By Distribution Channel: Supermarkets and hypermarkets lead in alcoholic beverage sales due to their convenience, wide selection, and competitive pricing. Specialized liquor stores hold a notable share, particularly for premium and craft beverages, offering a curated selection for discerning customers. Online retail is growing significantly, as consumers increasingly appreciate the convenience of home delivery and access to a broader range of products through e-commerce platforms.
Competitive Landscape in the Netherlands Alcoholic Drinks Market
The Netherlands alcoholic drinks market is moderately concentrated, with a mix of well-established global brands and prominent local producers. However, the rise of craft breweries and distilleries, along with the expansion of e-commerce platforms such as Drankgigant.nl, Gall & Gall, and Mitra, has diversified the market, providing consumers with a greater variety of choices and convenient purchasing options.
Company Name | Establishment Year | Headquarters |
|---|---|---|
Heineken N.V. | 1864 | Amsterdam, Netherlands |
Grolsch Brewery | 1615 | Enschede, Netherlands |
Bavaria Brewery | 1719 | Lieshout, Netherlands |
Lucas Bols | 1575 | Amsterdam, Netherlands |
Royal Swinkels Family Brewers | 1680 | Lieshout, Netherlands |
De Kuyper Royal Distillers | 1695 | Schiedam, Netherlands |
Herman Jansen Beverages | 1777 | Schiedam, Netherlands |
Brouwerij 't IJ | 1985 | Amsterdam, Netherlands |
Moortgat Brewery (Duvel Moortgat) | 1871 | Breendonk, Belgium (with operations in Netherlands) |
Hooghoudt Distillery | 1888 | Groningen, Netherlands |
Some recent competitor trends and key information about competitors include:
Heineken: As one of the largest global beer producers, Heineken saw a 10% increase in the Netherlands' market share in 2023, driven by its strong brand presence and innovative product lines, including low-alcohol and non-alcoholic beers. Heineken’s emphasis on sustainability and eco-friendly packaging has further strengthened its consumer appeal.
Bavaria: Known for its family-owned heritage and quality, Bavaria reported an 8% growth in sales in 2023, particularly in the low-alcohol segment. The brand’s focus on affordability and local appeal has attracted a broad customer base across both urban and rural areas in the Netherlands.
Grolsch: With its reputation for craft-style beer and premium quality, Grolsch saw a 12% growth in sales of its specialty beers in 2023. The brand's emphasis on heritage and unique flavor profiles has been well-received by consumers seeking artisanal options in the premium segment.
Gall & Gall: One of the Netherlands' largest alcoholic beverage retail chains, Gall & Gall experienced a 15% increase in online sales in 2023. Its wide product selection and seamless integration of in-store and online shopping have enhanced customer convenience, making it a popular choice for purchasing alcoholic beverages.
Drankgigant.nl: As a leading e-commerce platform for alcoholic drinks, Drankgigant.nl recorded over 5 million site visits in 2023, marking a 20% increase from the previous year. The platform’s extensive selection of local and international brands, coupled with efficient delivery services, has made it a go-to resource for Dutch consumers.
Mitra: Specializing in wine and spirits, Mitra saw a 10% rise in sales of organic and sustainably sourced beverages in 2023. The company’s focus on high-quality, niche products has attracted a growing segment of environmentally conscious consumers, strengthening its position in the premium alcoholic drinks market.
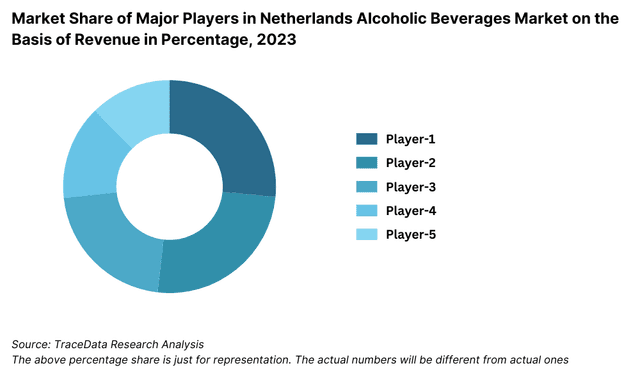
Market Share of Major Players in Netherlands Alcoholic Beverages Market on the Basis of Revenue in Percentage, 2023
What Lies Ahead for Netherlands Alcoholic Drinks Market?
The Netherlands alcoholic drinks market is projected to grow steadily through 2029, exhibiting a moderate CAGR during the forecast period. Growth is expected to be driven by changing consumer preferences, rising demand for premium and sustainable options, and increasing interest in healthier beverage alternatives.
Shift Towards Low-Alcohol and Non-Alcoholic Beverages: As health-conscious trends continue, there is anticipated growth in the low-alcohol and non-alcoholic beverage segments. Supported by a rising preference for wellness, these products are expected to attract a larger consumer base, particularly among younger adults and health-focused demographics. Major brands are already investing in expanding their alcohol-free product lines to meet this demand.
Advancements in Sustainable Production: The integration of sustainable practices in production and packaging is expected to play a key role in the market’s future. Companies are adopting eco-friendly packaging, reducing carbon footprints, and using organic ingredients, driven by both regulatory encouragement and consumer demand. These initiatives are likely to boost brand loyalty and market appeal among environmentally conscious consumers.
Growth in E-Commerce and Digitalization: With the increasing popularity of e-commerce, online sales of alcoholic beverages are projected to grow significantly. Many companies are investing in digital platforms, offering consumers convenience and access to a wider selection. Additionally, the adoption of digital marketing strategies, including targeted ads and social media engagement, is expected to enhance brand visibility and consumer outreach.
Rise in Premiumization and Craft Beverage Market: The market is seeing a strong trend toward premium and craft alcoholic drinks, as consumers seek unique and artisanal products. Craft beers, specialty wines, and high-quality spirits are expected to gain popularity, with both local and international brands capitalizing on the demand for exclusive, high-end experiences. This trend is particularly prominent in urban areas, where consumers are willing to pay a premium for quality and distinctiveness.
Focus on Healthier Ingredients and Functional Beverages: In response to a growing health trend, companies are exploring healthier ingredient alternatives and functional beverages. This includes low-calorie, low-sugar options, as well as drinks infused with vitamins and botanicals. These innovations are anticipated to appeal to health-conscious consumers and further diversify the product offerings in the market.
Future Outlook and Projections for Netherlands Alcoholic Beverages Market on the Basis of Revenues in USD Billion, 2024-2029


Netherlands Alcoholic Drinks Market Segmentation
- By Alcohol Type:
- Beer
- Spirits (Whiskey, Vodka, Rum)
- Wine (Red, White, Sparkling)
- Cider
- Ready-to-Drink (RTD) Cocktails
- By Beer
- Lager
- Dark Beer and others
- By Beer
- Craft
- Standard Beer
- By RTDs
- Malt based RTDs
- Spirit Based RTDs
- Wine Based RTDs
- Non-Alcoholic RTDs and others
- By Spirits
- Brandy
- Dark Rum
- White Rum
- Whiskies
- Gin
- Vodka and others
- By Vodka
- Flavoured
- Non-Flavoured Vodka
- By Wine
- Fortified Wine
- Champagne
- Other Sparkling Wine
- Red Wine
- White Wine and others
- By Distribution Channel:
- On-Trade (Bars, Restaurants, Hotels)
- Off-Trade (Supermarkets, Hypermarkets, Convenience Stores)
- By Price Segment:
- Economy
- Mid-Range
- Premium
- Super Premium
- By Consumer Age:
- 18-24
- 25-34
- 35-54
- 55+
- By Region:
- North Holland
- South Holland
- Utrecht
- Gelderland
- North Brabant
- Other Regions
Players Mentioned in the Report:
- Heineken N.V.
- Koninklijke (Royal) Grolsch
- AB InBev Netherlands
- Diageo Netherlands
- Pernod Ricard Netherlands
- Bacardi Netherlands
- Swinkels Family Brewers (Bavaria)
- United Dutch Breweries
- Lucas Bols N.V.
- Herman Jansen Beverages
Key Target Audience:
- Alcoholic Beverage Manufacturers
- Alcoholic Beverage Retailers
- E-commerce Platforms
- Hospitality Sector (Bars and Restaurants)
- Regulatory Bodies (e.g., Dutch Food and Consumer Product Safety Authority)
- Research and Development Institutions
Time Period:
- Historical Period: 2018-2023
- Base Year: 2024
- Forecast Period: 2024-2029
Explore Flexible Purchase Options or Have Limited Budget?
Pay only for relevant chapters • Customizable report sections
Table of Contents
Choose individual sections to purchase. Mix and match as you like.
4.1. Value Chain Process-Role of Entities, Stakeholders, Gross Margins, and Challenges they Face
4.2. Business Model Canvas for Netherlands Alcoholic Drinks Market
4.3. Consumer Buying Decision Process
5.1. Market Overview and Genesis
5.2. Number of Breweries and Microbreweries, as on Date
8.1. Revenues, 2018-2024
8.2. Sales Volume, 2018-2024
9.1. By Type (Beer, Cider, RTDs, Spirits and Wine), 2018-2023
9.1.1. By Beer (Lager, Dark Beer and others), 2018-2023
9.1.1.1. By Lager (Domestic Premium and Imported Premium), 2018-2023
9.1.1.2. By Craft and Standard Beer, 2018-2023
9.1.1.3. By Price (Super Premium, Premium, Standard and Economy), 2018-2023
9.1.2. By RTDs (Malt based RTDs, Spirit Based RTDs, Wine Based RTDs, Non-Alcoholic RTDs and others), 2018-2023
9.1.2.1. By Price (Super Premium, Premium, Standard and Economy), 2018-2023
9.1.3. By Spirits (Brandy, Dark Rum, White Rum, Whiskies, Gin, Vodka and others), 2018-2023
9.1.3.1. By Price (Super Premium, Premium, Standard and Economy), 2018-2023
9.1.3.2. By Flavoured and Non-Flavoured Vodka, 2018-2023
9.1.4. By Wine (Fortified Wine, Champagne, Other Sparkling Wine, Red Wine, White Wine and others), 2018-2023
9.1.4.1. By Price (Super Premium, Premium, Standard and Economy), 2018-2023
9.2. By Off Trade and On Trade for Each Type of Alcoholic Beverages, 2023
9.2.1. By Distribution Channel for Off Trade, 2023
9.3. By Region, 2023-2024P
10.1. Customer Landscape and Segment Analysis
10.2. Customer Journey and Decision-Making Process
10.3. Consumer Needs, Preferences, and Pain Points
10.4. Gap Analysis Framework
11.1. Trends and Developments in Netherlands Alcoholic Drinks Market
11.2. Growth Drivers for Netherlands Alcoholic Drinks Market
11.3. SWOT Analysis for Netherlands Alcoholic Drinks Market
11.4. Issues and Challenges for Netherlands Alcoholic Drinks Market
11.5. Government Regulations for Netherlands Alcoholic Drinks Market
14.1. Market Share of Key Players in Alcoholic Beverages Market, 2023
14.2. Market Share of Key Players in Beer Market, 2023
14.3. Market Share of Key Players in Wine Market, 2023
14.4. Market Share of Key Players in Spirits Market, 2023
14.5. Market Share of Key Players in RTDs Market, 2023
14.6. Benchmark of Key Competitors in Netherlands Alcoholic Drinks Market Basis 15-20 Operational and Financial Parameters
14.7. Strength and Weakness of Key Competitors
14.8. Operating Model Analysis Framework
14.9. Gartner Magic Quadrant for Market Positioning
14.10. Bowmans Strategic Clock for Competitive Advantage
15.1. Revenues, 2025-2029
15.2. Sales Volume, 2025-2029
16.1. By Type (Beer, Cider, RTDs, Spirits and Wine), 2025-2029
16.1.1. By Beer (Lager, Dark Beer and others), 2025-2029
16.1.1.1. By Lager (Domestic Premium and Imported Premium), 2025-2029
16.1.1.2. By Craft and Standard Beer, 2025-2029
16.1.1.3. By Price (Super Premium, Premium, Standard and Economy), 2025-2029
16.1.2. By RTDs (Malt based RTDs, Spirit Based RTDs, Wine Based RTDs, Non-Alcoholic RTDs and others), 2025-2029
16.1.2.1. By Price (Super Premium, Premium, Standard and Economy), 2025-2029
16.1.3. By Spirits (Brandy, Dark Rum, White Rum, Whiskies, Gin, Vodka and others), 2025-2029
16.1.3.1. By Price (Super Premium, Premium, Standard and Economy), 2025-2029
16.1.3.2. By Flavoured and Non-Flavoured Vodka, 2025-2029
16.1.4. By Wine (Fortified Wine, Champagne, Other Sparkling Wine, Red Wine, White Wine and others), 2025-2029
16.1.4.1. By Price (Super Premium, Premium, Standard and Economy), 2025-2029
16.2. By Off Trade and On Trade for Each Type of Alcoholic Beverages, 2025-2029
16.2.1. By Distribution Channel for Off Trade, 2025-2029
16.3. By Region, 2025-2029
17.1. Strategic Recommendation
17.2. Opportunity Identification
Discuss a Customized Research Scope
Custom research scope • Tailored insights • Industry expertise
Research Methodology
Step 1: Ecosystem Creation
Map the Ecosystem: Identify all demand- and supply-side entities in the Netherlands Alcoholic Drinks Market. Based on this ecosystem, we shortlist 5-6 leading producers in the country using criteria such as financial performance, production capacity, and market presence.
Sourcing Information: Conduct desk research by gathering data from industry articles, secondary sources, and proprietary databases to collect comprehensive information at the industry level, identifying market dynamics and prominent players.
Step 2: Desk Research
In-Depth Desk Research: Engage in extensive desk research utilizing diverse secondary and proprietary databases. This method enables a detailed analysis of the market, aggregating industry insights on sales revenues, the number of market players, price levels, demand trends, and other factors.
Company-Level Data Analysis: Examine data at the company level through sources such as press releases, annual reports, and financial statements. This process constructs a foundational understanding of the market and its key players, offering insight into their market strategies, growth patterns, and operational capacities.
Step 3: Primary Research
Stakeholder Interviews: Conduct in-depth interviews with C-level executives and other stakeholders within the Netherlands Alcoholic Drinks Market. These interviews validate market hypotheses, authenticate statistical data, and gather insights on operations and financials directly from industry representatives.
Disguised Validation Strategy: As part of the validation strategy, our team performs disguised interviews, approaching each company as potential customers to corroborate operational and financial information provided by company executives. These discussions offer a deeper understanding of revenue streams, the value chain, pricing mechanisms, and additional relevant market factors.
Step 4: Sanity Check
- Sanity Checks and Modeling: Utilize both bottom-up and top-down analyses alongside market size modeling to perform a thorough sanity check, ensuring the accuracy and reliability of all gathered data and market projections.
See What's Inside the Report
Get a preview of key findings, methodology and report coverage
Frequently Asked Questions
The Netherlands alcoholic drinks market is projected to experience steady growth, reaching a valuation of EUR 10 billion by 2023. Key growth factors include increasing consumer preference for premium and sustainable options, a rising interest in low-alcohol and non-alcoholic beverages, and a strong craft beer culture. The market's potential is further supported by the growing e-commerce sector, which provides easier access to a wide range of products.
The Netherlands alcoholic drinks market features several key players, including Heineken, Bavaria, and Grolsch. These companies dominate the market due to their strong brand presence, extensive distribution networks, and product diversity. Other notable players include Gall & Gall, Drankgigant.nl, and Mitra, each recognized for their focus on customer convenience and wide product selection.
Primary growth drivers include an increasing demand for craft and premium products, a shift towards low-alcohol and non-alcoholic beverages, and a consumer focus on health-conscious and sustainable products. The expansion of e-commerce also contributes significantly to market growth, providing consumers with convenient access to a broad selection of beverages and personalized recommendations.
The Netherlands alcoholic drinks market faces several challenges, including stringent advertising and regulatory restrictions on alcohol, which limit market reach. Additionally, health concerns surrounding alcohol consumption impact demand, pushing companies to innovate in low- and non-alcoholic alternatives. High excise taxes and increasing production costs due to sustainability practices also present barriers, particularly for smaller and emerging brands.
License Options
PDF + Excel
Complete report package
$4,000
Excel Only
Data and analytics
$2,500
Custom Sections
Starts from $100
$0