Netherlands Consumer Electronics Market Outlook to 2029
By Market Structure (Branded and Local), By Product Type (Computer and Peripherals, In-Car Entertainment, In-Home Consumer Electronics, Television, Headphones and Imaging Devices), By Distribution Channel, By Consumer Demographics, and By Region
Report Overview
Report Code
TDR0074
Coverage
Asia
Published
November 2024
Pages
80-100
Flexible Purchase Options
Select and purchase only the chapters you need for your strategic decisions
On This Page
Report Overview
The report titled "Netherlands Consumer Electronics Market Outlook to 2029 - By Market Structure (Branded and Local), By Product Type (Computer and Peripherals, In-Car Entertainment, In-Home Consumer Electronics, Television, Headphones and Imaging Devices), By Distribution Channel, By Consumer Demographics, and By Region" provides a comprehensive analysis of the consumer electronics market in the Netherlands.
Report Coverage
Verified Market Sizing
Multi-layer forecasting with historical data and 5–10 year outlook
Deep-Dive Segmentation
Cross-sectional analysis by product type, end user, application and region
Competitive Benchmarking & Positioning
Market share, operating model, pricing and competition matrices
Actionable Insights & Risk Assessment
High-growth white spaces, underserved segments, technology disruptions and demand inflection points
Review Methodology & Data Structure
Preview report structure, data sources and research framework
Executive Summary
The report titled "Netherlands Consumer Electronics Market Outlook to 2029 - By Market Structure (Branded and Local), By Product Type (Computer and Peripherals, In-Car Entertainment, In-Home Consumer Electronics, Television, Headphones and Imaging Devices), By Distribution Channel, By Consumer Demographics, and By Region" provides a comprehensive analysis of the consumer electronics market in the Netherlands. The report covers an overview and genesis of the industry, overall market size in terms of revenue, market segmentation; trends and developments, regulatory landscape, customer profiling, issues and challenges, and competitive landscape including competition scenario, cross-comparison, opportunities and bottlenecks, and company profiling of major players in the Consumer Electronics Market. The report concludes with future market projections based on sales revenue, by product type, region, consumer demographics, and success case studies highlighting the major opportunities and challenges.
Netherlands Consumer Electronics Market Overview and Size
The Netherlands consumer electronics market reached a valuation of EUR 8 Billion in 2023, driven by the increasing demand for smart devices, growing technological advancements, and shifting consumer preferences towards high-quality electronics. The market is characterized by major players such as Philips, MediaMarkt, Coolblue, Bol.com, and BCC, known for their extensive distribution networks, diverse product offerings, and customer-focused services.
In 2023, Philips launched a new range of smart home products, enhancing customer experience and aiming to provide a more integrated living environment. Major cities such as Amsterdam and Rotterdam are key markets due to their high population density and robust retail infrastructure.
Market Size for Netherlands Consumer Electronics Industry on the Basis of Revenues in USD Billion, 2018-2024
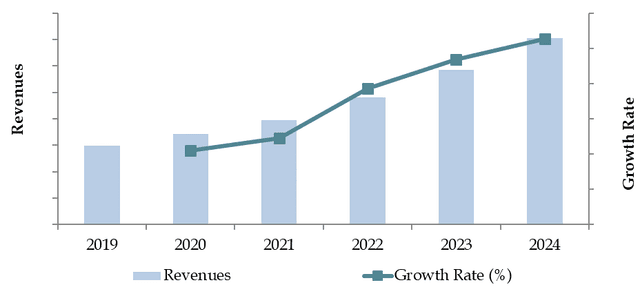
Source: TraceData Research Analysis
What Factors are Leading to the Growth of Netherlands Consumer Electronics Market:
Technological Advancements: The proliferation of IoT (Internet of Things) devices and the rising adoption of 5G technology are significant growth drivers. In 2023, smart home devices accounted for approximately 35% of total consumer electronics sales, as consumers increasingly seek connected ecosystems that provide convenience and energy efficiency.
Rising Disposable Income: The increasing purchasing power of Dutch consumers has led to higher spending on premium consumer electronics. In recent years, the disposable income of households in the Netherlands has risen by 10%, and this financial capacity has driven demand for high-end electronics such as smart TVs, advanced home appliances, and wearable devices.
E-commerce Growth: The rise of online marketplaces has revolutionized the consumer electronics market, enhancing accessibility and convenience. In 2023, around 45% of consumer electronics sales in the Netherlands were conducted online, reflecting a growing preference for digital shopping channels. These platforms offer comprehensive product listings, price comparisons, and customer reviews, which have significantly boosted market growth by making the buying process more accessible and user-friendly.
Which Industry Challenges Have Impacted the Growth for Netherlands Consumer Electronics Market
High Competition and Price Sensitivity: The consumer electronics market in the Netherlands is highly competitive, with several players offering similar products at competitive prices. This has resulted in significant price sensitivity among consumers, with around 60% of buyers citing price as the primary decision-making factor. Consequently, many companies are compelled to lower prices, affecting profit margins.
Supply Chain Disruptions: In 2023, global supply chain issues due to geopolitical tensions and logistical constraints resulted in delays and increased costs. Approximately 15% of consumer electronics products in the Netherlands faced delays or increased costs, leading to stock shortages and impacting sales.
Environmental Regulations: Stringent regulations concerning e-waste management and sustainability standards can increase costs for companies. In 2023, about 25% of consumer electronics firms in the Netherlands reported additional expenses due to compliance with new e-waste management regulations. These regulatory pressures can impose significant costs, particularly on smaller retailers and manufacturers.
What are the Regulations and Initiatives which have Governed the Market:
E-Waste Management Regulations: The Dutch government enforces stringent regulations on the disposal and recycling of electronic waste to mitigate environmental impact. Companies are required to adhere to these regulations by ensuring proper collection, recycling, or disposal of used electronic devices. In 2023, around 85% of consumer electronics firms complied with these regulations, showcasing a high level of adherence and commitment towards sustainability in the industry.
Energy Efficiency Standards: The Netherlands has implemented robust energy efficiency standards for consumer electronics to promote sustainability and reduce energy consumption. All electronics sold in the country must meet the minimum energy efficiency requirements set by the EU’s Ecodesign Directive. In 2023, approximately 75% of new consumer electronics met the high-efficiency standards, reflecting an industry-wide shift towards greener practices.
Government Incentives for Green Technologies: To encourage the adoption of energy-efficient and environmentally friendly technologies, the Dutch government has introduced several incentives such as tax reductions, subsidies, and grants. These incentives are particularly aimed at promoting the purchase of energy-efficient appliances and smart home products. In 2023, green technology products accounted for 18% of the total consumer electronics sales, a figure that is expected to increase as these incentives gain traction.
Netherlands Consumer Electronics Market Segmentation
By Product Type: The consumer electronics market in the Netherlands is segmented into mobile devices, home appliances, computing devices, and audio-visual equipment. Mobile devices, including smartphones and tablets, dominate the market due to their widespread use and rapid technological advancements. Home appliances such as refrigerators and washing machines also hold a significant share, driven by increasing demand for energy-efficient and smart home-compatible products. Audio-visual equipment, including smart TVs and sound systems, is gaining traction due to rising consumer interest in immersive home entertainment experiences.
By Distribution Channel: The market is divided into online and offline channels. Online channels, including e-commerce platforms and brand-specific websites, account for a growing share of sales due to the convenience they offer. In 2023, online sales represented around 45% of the total consumer electronics market, reflecting the strong shift towards digital retailing. Offline channels, including specialty stores and large retail chains, continue to maintain a significant share by providing experiential purchasing opportunities and personalized customer service.
By Consumer Demographics: Consumers aged 18-34 exhibit a strong preference for the latest technological innovations and are more likely to adopt new gadgets and smart devices. They account for approximately 40% of total consumer electronics spending in the Netherlands. Meanwhile, the 35-54 age group prioritizes reliability and long-term value, favoring established brands known for durability and post-purchase support. The 55+ demographic is more focused on functionality and ease of use, often opting for simplified devices with essential features.
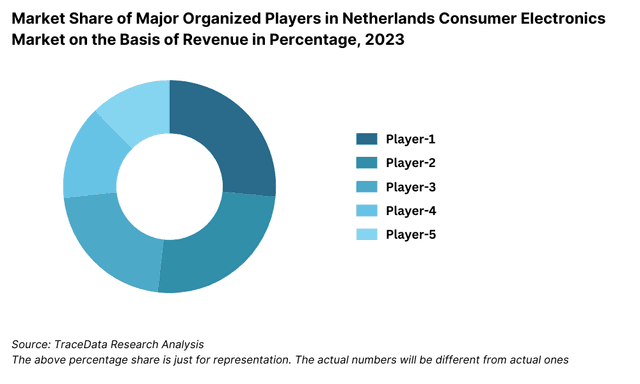
Competitive Landscape in Netherlands Consumer Electronics Market
The Netherlands consumer electronics market is relatively concentrated, with a few major players dominating the space. However, the entry of new firms and the expansion of e-commerce platforms such as Bol.com, Coolblue, and Amazon have diversified the market, offering consumers more choices and services.
Company Name | Segment | Establishment Year | Headquarters |
|---|---|---|---|
Philips Electronics | Home Appliances, Televisions, Audio | 1891 | Amsterdam, Netherlands |
Sony Corporation | Televisions, Imaging Devices, Audio | 1946 | Tokyo, Japan |
Samsung Electronics | Televisions, Mobile Devices, Home Appliances | 1938 | Suwon, South Korea |
Apple Inc. | Computers, Mobile Devices, Wearables | 1976 | Cupertino, California, USA |
LG Electronics | Televisions, Home Appliances | 1958 | Seoul, South Korea |
Canon Inc. | Imaging Devices | 1937 | Tokyo, Japan |
Dell Technologies | Computers and Peripherals | 1984 | Round Rock, Texas, USA |
ASUS | Computers and Peripherals | 1989 | Taipei, Taiwan |
JBL (Harman) | Audio Devices, Headphones | 1946 | Stamford, Connecticut, USA |
Coolblue BV | Multi-category Consumer Electronics Retailer | 1999 | Rotterdam, Netherlands |
bol.com bv | Multi-category Consumer Electronics Retailer | 1999 | Utrecht, Netherlands |
Some of the recent competitor trends and key information about competitors include:
Philips: A leading manufacturer of consumer electronics, Philips reported a 12% increase in smart home product sales in 2023. The company’s focus on innovative health-tech and smart solutions has strengthened its market position.
MediaMarkt: Known for its extensive retail presence, MediaMarkt reported a 15% growth in online sales in 2023. The company's strategy of integrating offline and online experiences has contributed to its strong market presence.
Coolblue: A popular e-commerce platform, Coolblue expanded its physical store network in 2023, recording a 20% increase in overall sales. The company’s focus on customer service and fast delivery has made it a preferred choice for electronics buyers.
Bol.com: The leading online marketplace in the Netherlands, Bol.com, saw a 25% growth in electronics sales in 2023. Its competitive pricing strategy and diverse product offerings have enhanced its market position.
BCC: BCC’s focus on personalized service and customer experience led to a 10% increase in sales in 2023. The company has been investing in its digital platform to offer a seamless shopping experience.
What Lies Ahead for Netherlands Consumer Electronics Market?
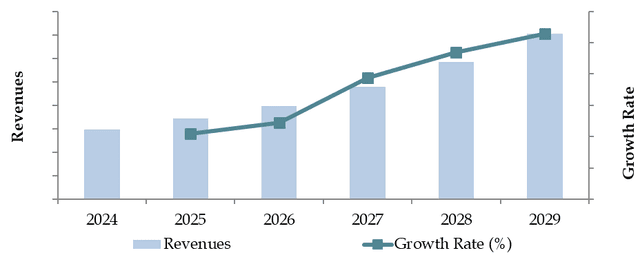
The Netherlands consumer electronics market is projected to experience steady growth through 2029, with a moderate CAGR anticipated during the forecast period. This growth will be driven by factors such as rising disposable incomes, technological advancements, and increasing consumer demand for smart and energy-efficient products.
Rise in Smart Home Adoption: The growing interest in smart home solutions is expected to significantly drive the market. Products like smart speakers, security systems, and connected home appliances are anticipated to see increased demand as consumers seek more integrated and automated living environments. This trend is supported by advancements in IoT technology and rising awareness of home automation benefits.
Growth in E-commerce Sales: E-commerce is expected to continue gaining traction, with an increasing number of consumers opting to purchase electronics online due to the convenience, competitive pricing, and comprehensive product information offered by online platforms. This trend will likely be bolstered by the ongoing expansion of e-commerce giants like Bol.com, Amazon, and Coolblue.
Emphasis on Energy Efficiency and Sustainability: With the Dutch government’s focus on sustainability and energy efficiency, there is expected to be a surge in demand for energy-efficient consumer electronics. Products with high energy efficiency ratings and compliance with stringent EU standards will be preferred by environmentally conscious consumers, driving the adoption of green technologies in the market.
Integration of Advanced Technologies: The integration of cutting-edge technologies such as artificial intelligence (AI), virtual reality (VR), and 5G connectivity into consumer electronics is expected to shape the market's future. These technologies will enhance product functionality, providing consumers with more intelligent, connected, and immersive experiences.
Future Outlook and Projections for Netherlands Consumer Electronics Market on the Basis of Revenue, 2024-2029
Netherlands Consumer Electronics Market Segmentation
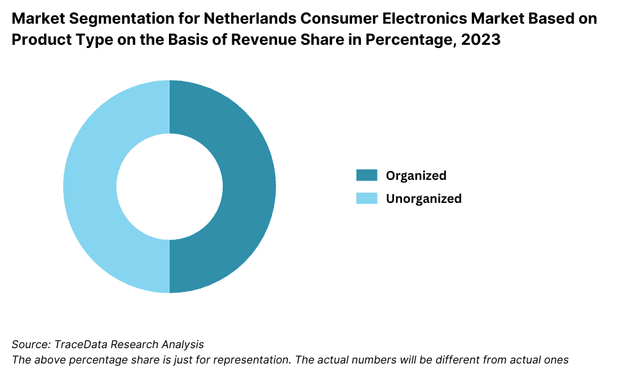
- By Market Structure:
- Organized Sector
- Unorganized Sector
- By Product Type:
- Computer and Peripherals
- In-Car Entertainment
- In-Home Consumer Electronics
- Television
- Headphones
- Imaging Devices
- By Computer and Peripherals
- Desktops
- Laptops
- Tablets
- Monitors
- Printers
- In-Car Entertainment:
- In-Car Navigation
- In-Car Speakers
- In-Dash Media Players
- In-Home Consumer Electronics:
- Audio Separates
- Digital Media Player Docks
- Hi-Fi System
- Home Cinema & Speaker System
- Speakers
- Others
- Television and Video Players:
- TV Types:
- Analog TV
- LCD
- OLED
- Plasma
- Other TVs
- Video Players:
- BD Players
- DVD Players
- Video Recorders
- TV Types:
- Headphones:
- Wireless Headbands
- Wireless Earphones
- TWS Earbuds
- Imaging Devices:
- Cameras
- Camcorders
- By Distribution Channel:
- Online Platforms (E-commerce)
- Offline Retail Stores
- Multi-brand Showrooms
- Exclusive Brand Outlets
- Wholesale Channels
- By Consumer Demographics:
- Age Group:
- 18-24
- 25-34
- 35-44
- 45-54
- 55+
- Income Group:
- Lower-Income
- Middle-Income
- Upper-Middle-Income
- High-Income
- Age Group:
Players Mentioned in the Report:
- Samsung Electronics
- Sony Corporation
- LG Electronics
- Apple Inc.
- Dell Technologies
- Hewlett-Packard (HP)
- Lenovo Group Ltd.
- Philips
- Canon Inc.
- Nikon Corporation
- GoPro
- Bose Corporation
- JBL
- Pioneer Corporation
- Coolblue BV
- bol.com bv
- Hisense Co., Ltd.
- TCL Corporation
- Microsoft Corporation
- Huawei Technologies Co., Ltd
Key Target Audience:
- Consumer Electronics Manufacturers
- E-commerce Platforms
- Retailers and Distributors
- Regulatory Bodies (e.g., Netherlands Authority for Consumers & Markets)
- Research and Development Institutions
Time Period:
- Historical Period: 2018-2023
- Base Year: 2024
- Forecast Period: 2024-2029
Explore Flexible Purchase Options or Have Limited Budget?
Pay only for relevant chapters • Customizable report sections
Table of Contents
Choose individual sections to purchase. Mix and match as you like.
3.1. Manufacturers and Suppliers
3.2. Distribution Channels
3.3. Retailers and E-commerce Platforms
3.4. Consumer Groups
4.1. Value Chain Process-Entity relationships, Margin Analysis, Distributor, Dealers, Traders and Retailers
4.2. Business Model Canvas for the Netherlands Consumer Electronics Market
5.1. Overview and Business Cycle
5.2. Household Penetration for Each Type of Consumer Electronics in Netherlands, 2018-2023
5.3. Replacement Cycle of Consumer Electronics by Each Category, 2018-2023
8.1. Revenues, 2018-2024
8.2. Sales Volume, 2018-2024
9.1. By Market Structure (Branded and Local Brands), 2023-2024P
9.2. By Type (Computer and Peripherals, In-Car Entertainment, In-Home Consumer Electronics, Television, Headphones and Imaging Devices), 2018-2024
9.2.1. By Computer and Peripherals (Desktops, Laptops, Tablets, Monitors and Printers), 2018-2024
9.2.2. By In-Car Entertainment (In-Car Navigation, In-Car Speakers, In-Dash Media Players), 2018-2024
9.2.3. By In-Home Consumer Electronics (Audio Separates, Digital Media Player Docks, Hi-Fi System, Home Cinema & Speaker System, Speakers and others), 2018-2024
9.2.4. By Television and Video Players
9.2.4.1. By TV (Analog TV, LCD, OLED, Plasma, Other TVs), 2018-2024
9.2.4.2. By Video Players (BD Players, DVD Players and Video Recorders), 2018-2024
9.2.5. By Headphones (Wireless Headbands, Wireless Earphones and TWS Earbuds) 2018-2024
9.2.6. By Imaging Devices (Camers and Camcorders), 2018-2024
9.3. By Distribution Channel (MBOs, EBOs, Online and others), 2023-2024P
9.4. By Region, 2023-2024P
9.5. By Technology Adoption (Smart, AI-Enabled, IoT-Enabled, and Non-Smart), 2023-2024P
10.1. Consumer Landscape and Segment Analysis
10.2. Customer Journey and Decision-Making Process
10.3. Need, Desire, and Pain Point Analysis
10.4. Gap Analysis Framework
10.5. By Income, Age and Gender Split, 2024
11.1. Trends and Developments in the Netherlands Consumer Electronics Market
11.2. Growth Drivers for Netherlands Consumer Electronics Market
11.3. SWOT Analysis for Netherlands Consumer Electronics Market
11.4. Issues and Challenges in the Netherlands Consumer Electronics Market
11.5. Government Regulations and Initiatives for Netherlands Consumer Electronics Market
12.1. Market Size and Future Potential for Online Consumer Electronics Market, 2018-2029
12.2. Business Model and Revenue Streams of Leading Online Platforms
12.3. Cross Comparison of Leading Online Consumer Electronics Platforms Based on Operational and Financial Parameters
13.1. Finance Penetration Rate and Average Ticket Size for Consumer Electronics, 2018-2029
13.2. Trends in Financing Options for Consumer Electronics
13.3. Popular Consumer Electronics Segments with Higher Finance Penetration Rates
13.4. Finance Split by Banks/NBFCs/Private Finance Companies, 2023-2024P
13.5. Average Loan Tenure for Consumer Electronics Financing in Netherlands
13.6. Finance Disbursement for Consumer Electronics in INR Crores, 2018-2024P
16.1. Market Share of Key Players in Netherlands Consumer Electronics Market, 2018-2024
16.2. Market Share of Key Players in Netherlands Computer and Peripherals Market, 2018-2024
16.3. Market Share of Key Players in Netherlands In-Car Entertainment Market, 2018-2024
16.4. Market Share of Key Players in Netherlands In-Home Consumer Electronics Market, 2018-2024
16.5. Market Share of Key Players in Netherlands Television Market, 2018-2024
16.6. Market Share of Key Players in Netherlands Headphones Market, 2024
16.7. Market Share of Key Players in Netherlands Imaging Devices Market, 2024
16.8. Benchmarking of Key Competitors in Netherlands Consumer Electronics Market including Operational and Financial Parameters
16.9. Heat Map Analysis for Major Players in Netherlands Consumer Electronics Market
16.10. Strengths and Weaknesses Analysis
16.11. Operating Model Analysis Framework
16.12. Gartner Magic Quadrant
16.13. Bowmans Strategic Clock for Competitive Advantage
17.1. Revenues, 2025-2029
17.2. Sales Volume, 2025-2029
18.1. By Market Structure (Branded and Local Brands), 2025-2029
18.2. By Type (Computer and Peripherals, In-Car Entertainment, In-Home Consumer Electronics, Television, Headphones and Imaging Devices), 2025-2029
18.2.1. By Computer and Peripherals (Desktops, Laptops, Tablets, Monitors and Printers), 2025-2029
18.2.2. By In-Car Entertainment (In-Car Navigation, In-Car Speakers, In-Dash Media Players), 2025-2029
18.2.3. By In-Home Consumer Electronics (Audio Separates, Digital Media Player Docks, Hi-Fi System, Home Cinema & Speaker System, Speakers and others), 2025-2029
18.2.4. By Television and Video Players
18.2.4.1. By TV (Analog TV, LCD, OLED, Plasma, Other TVs), 2025-2029
18.2.4.2. By Video Players (BD Players, DVD Players and Video Recorders), 2025-2029
18.2.5. By Headphones (Wireless Headbands, Wireless Earphones and TWS Earbuds) 2025-2029
18.2.6. By Imaging Devices (Camers and Camcorders), 2025-2029
18.3. By Distribution Channel (MBOs, EBOs, Online and others), 2025-2029
18.4. By Region, 2025-2029
18.5. By Technology Adoption (Smart, AI-Enabled, IoT-Enabled, and Non-Smart), 2025-2029
18.6. Recommendations
18.7. Opportunity Analysis
Discuss a Customized Research Scope
Custom research scope • Tailored insights • Industry expertise
Research Methodology
Step 1: Ecosystem Creation
Map the ecosystem and identify all the demand side and supply side entities for the Netherlands Consumer Electronics Market. Based on this ecosystem, we will shortlist leading 5-6 key players in the country based on their financial information, market presence, and product portfolio.
Sourcing is carried out through industry articles, multiple secondary sources, and proprietary databases to perform desk research around the market to collate industry-level information.
Step 2: Desk Research
Subsequently, an exhaustive desk research process is conducted by referencing diverse secondary and proprietary databases. This approach enables a comprehensive analysis of the market, aggregating industry-level insights such as revenue trends, number of market players, product pricing, and demand. We supplement this with detailed examinations of company-level data, relying on sources like press releases, annual reports, financial statements, and industry journals. This step aims to construct a foundational understanding of both the market dynamics and the entities operating within it.
Step 3: Primary Research
A series of in-depth interviews are initiated with C-level executives and other stakeholders representing various consumer electronics companies and end-users in the Netherlands. This interview process serves a multi-faceted purpose: to validate market hypotheses, authenticate statistical data, and extract valuable operational and financial insights from industry representatives. A bottom-up approach is undertaken to evaluate sales volume and market size for each player, thereby aggregating to the overall market.
As part of the validation strategy, our team conducts disguised interviews, wherein we approach each company under the guise of potential customers. This approach enables validation of operational and financial information shared by company executives, corroborating this data against what is available in secondary databases. These interactions also provide a comprehensive understanding of revenue streams, value chain, process, pricing, and other critical factors.
Step 4: Sanity Check
- Bottom-up and top-down analysis, along with market size modeling exercises, is conducted as part of the sanity check process. The results are cross-verified with industry experts and validated against known market trends and benchmarks to ensure accuracy and reliability.
See What's Inside the Report
Get a preview of key findings, methodology and report coverage
Frequently Asked Questions
The Netherlands consumer electronics market is expected to witness steady growth, reaching a projected valuation of EUR 12 Billion by 2029. This growth is driven by factors such as increasing consumer spending on electronics, rising adoption of smart home products, and the widespread digitization of retail channels. The market's potential is further enhanced by advancements in technology and an expanding e-commerce landscape, which facilitate easier access to a wide range of electronic devices.
The Netherlands Consumer Electronics Market features several key players, including Philips, Media Market, Coolblue, and Bol.com. These companies dominate the market due to their extensive distribution networks, strong brand presence, and diverse product offerings. Other notable players include Amazon, Samsung Electronics, and Sony, which have a significant presence in both online and offline channels.
The primary growth drivers include technological advancements, such as the integration of AI and IoT in consumer electronics, rising disposable incomes, and increasing consumer preference for premium and energy-efficient products. Additionally, the growing trend of e-commerce and the shift towards digital retail channels have made it easier for consumers to access a wider selection of products, boosting market growth.
The Netherlands Consumer Electronics Market faces several challenges, including price sensitivity among consumers, which puts pressure on profit margins. Regulatory challenges related to energy efficiency and e-waste management can also increase compliance costs for companies. Additionally, supply chain disruptions and shortages of key components, such as semiconductors, pose significant barriers to market growth and affect product availability.
License Options
PDF + Excel
Complete report package
$4,000
Excel Only
Data and analytics
$2,500
Custom Sections
Starts from $100
$0