Netherlands Renewable Energy Market Outlook to 2030
By Technology, By Application, By Market Mechanism, By Project Configuration, By Grid Connection Status, and By Region
Report Overview
Report Code
TDR0350
Coverage
Europe
Published
October 2025
Pages
80
On This Page
Report Overview
The report titled “Netherlands Renewable Energy Market Outlook to 2030 - By Technology, By Application, By Market Mechanism, By Project Configuration, By Grid Connection Status, and By Region” provides a comprehensive analysis of the renewable energy market in the Netherlands. The report covers an overview and genesis of the industry, overall market size in terms of revenue and generation, market segmentation; trends and developments, regulatory landscape, customer level profiling, issues and challenges, and competitive landscape including competition scenario, cross-comparison, opportunities and bottlenecks, and company profiling of major players in the renewable energy market.
Report Coverage
Verified Market Sizing
Multi-layer forecasting with historical data and 5–10 year outlook
Deep-Dive Segmentation
Cross-sectional analysis by product type, end user, application and region
Competitive Benchmarking & Positioning
Market share, operating model, pricing and competition matrices
Actionable Insights & Risk Assessment
High-growth white spaces, underserved segments, technology disruptions and demand inflection points
Review Methodology & Data Structure
Preview report structure, data sources and research framework
Executive Summary
The report titled “Netherlands Renewable Energy Market Outlook to 2030 - By Technology, By Application, By Market Mechanism, By Project Configuration, By Grid Connection Status, and By Region” provides a comprehensive analysis of the renewable energy market in the Netherlands. The report covers an overview and genesis of the industry, overall market size in terms of revenue and generation, market segmentation; trends and developments, regulatory landscape, customer level profiling, issues and challenges, and competitive landscape including competition scenario, cross-comparison, opportunities and bottlenecks, and company profiling of major players in the renewable energy market. The report concludes with future market projections based on capacity additions, generation volumes, offtake structures, regions, cause-and-effect relationships, and success case studies highlighting the major opportunities and cautions.
Netherlands Renewable Energy Market Overview and Size
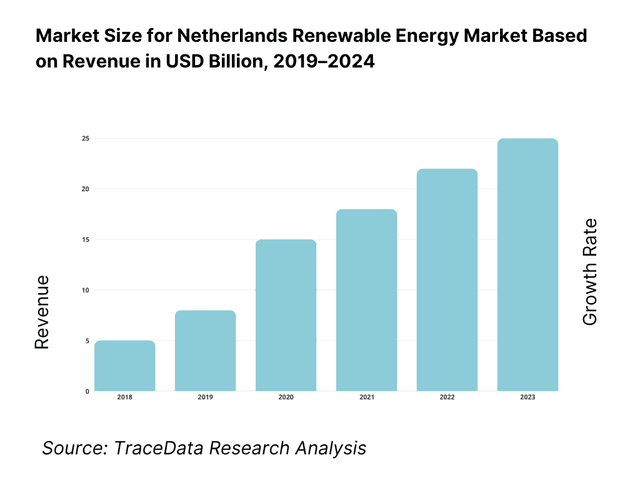
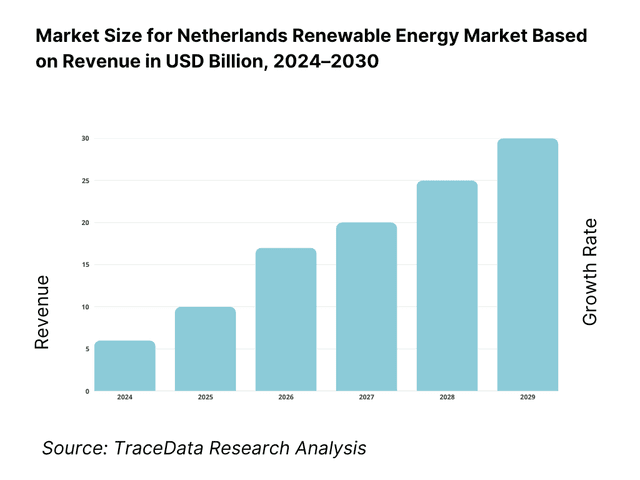
The Netherlands renewable energy market is anchored by capital formation into generation assets: more than €10 billion was invested in producing renewable energy, led by €4.6 billion in solar, €2.7 billion in wind, and €2.1 billion in heat pumps. Throughput expanded to 57 billion kWh of renewable electricity and 308 PJ of renewable energy consumption, with the subsequent period reaching 61 billion kWh of renewable electricity—evidence of momentum from SDE++ auctions and the offshore wind roadmap.
Industrial-port ecosystems and grid nodes confer advantage. Rotterdam/Maasvlakte concentrates hydrogen pilots and grid connections; IJmuiden serves North Sea wind zones including IJmuiden Ver (4 GW permits awarded); Eemshaven is a principal offshore O&M and installation base; Zeeland (Vlissingen/Borssele) hosts export-class port services; and inland provinces such as Flevoland and North Brabant benefit from land availability and rooftops supporting 23.9 GW of solar capacity. Logistics readiness, TenneT interconnections, and clustering of OEM/EPCI contractors sustain these hubs.
What Factors are Leading to the Growth of the Netherlands Renewable Energy Market:
Electrification of mobility and buildings is accelerating renewable electricity demand: The Netherlands is shifting end-use energy from molecules to electrons at national scale. On roads, 558,000 battery-electric passenger cars are registered, with ~183,000 public charge points and ~1,000,000 total charge points supporting usage; both figures materially rose through 2024 as government programs matured. In homes and small businesses, installed heat pump capacity reached ~16,000 MW (thermal) at the close of 2023, giving a large, flexible electric load that pairs with variable renewables. The housing stock adds scale, with ~8.2 million dwellings connected to distribution grids. On the supply side, solar PV generated 21.27 TWh in 2024, deepening the incentive to electrify heat and transport. A resilient macro base underpins investment appetite: nominal GDP totaled ~US$1.23 trillion in 2024. Together these demand- and supply-side numbers show a self-reinforcing loop—more electric end-uses pull in more renewable generation, and more renewable output encourages further electrification.
Scale and diffusion of solar PV across households and businesses: Solar is now a mass technology in the Netherlands, anchored by both utility-scale parks and a vast rooftop base. Total installed PV panel capacity reached 28,620 MWp at year-end 2024, with 11,672 MWp on dwellings and 16,949 MWp on non-residential rooftops and ground-mount systems. That hardware produced 21.27 TWh of electricity in 2024 versus 19.58 TWh a year earlier, despite less sunny weather—evidence that structural capacity, not only irradiation, now drives output. The policy plumbing to sustain diffusion remains in place: small users can still apply net metering and cooperatives benefit from SCE, while business users rely on instruments such as SDE++ and EIA—mechanisms cited by CBS as central to project realization and pipeline conversion. With tens of thousands of megawatts already wired into distribution networks, PV’s physical footprint is the single largest contributor to renewable generation growth momentum and to behind-the-meter flexibility potential (e.g., pairing with heat pumps and EV charging).
North Sea offshore wind pipeline, ports and transmission standardization: System-scale growth is reinforced offshore. In 2024, the state awarded permits for 4,000 MW at IJmuiden Ver (two 2,000 MW sites: Alpha and Beta), formalized by the Netherlands Enterprise Agency; these projects integrate grid and, in one case, electrolysis plans linked to industrial coastal hubs. Logistics capacity is commensurate: the Port of Rotterdam handled 435.8 million tonnes of cargo in 2024 and received 27,617 seagoing vessels, providing heavy-lift, assembly and export cable staging that de-risks gigawatt-class builds and O&M. Grid connection is being standardized via TenneT’s 2-GW HVDC program for Dutch offshore hubs, simplifying permitting and accelerating time to energization for multiple wind zones. This combination—bankable concessions, deep-water port scale, and repeatable 2-GW links—creates a durable runway for renewable expansion and industrial demand-matching onshore.
Which Industry Challenges Have Impacted the Growth of the Netherlands Renewable Energy Market:
Grid congestion and connection queues constrain timely renewable build-out: Rapid load electrification and record PV additions are outpacing available capacity on high-voltage and regional networks. TenneT reported 9,396 demand-side and 7,539 feed-in applications on its congestion waiting lists in 2024, a clear sign that both consumption and generation projects face delays. To mitigate, TenneT introduced off-peak contracting that unlocked ~9.1 GW of time-bound capacity, but aggregate connection requests exceed 70 GW, illustrating the magnitude of pent-up projects seeking access. The situation became acute when Zuid-Holland—home to Rotterdam’s industrial cluster—hit available-capacity limits by late 2024. As developers pile up in queues, curtailment and deferred grid hookups can defer revenue realization and increase balancing costs, challenging financing for storage-coupled or hybrid renewable assets.
Scarce space and protected areas complicate siting for wind, solar and grid: The Netherlands is compact and densely utilized, requiring developers to navigate intense spatial trade-offs. The country manages 162 Natura 2000 protected areas on land and sea, which adds layers to ecological assessment and routing for cables, turbines and PV parks. The Environment and Planning Act (Omgevingswet) streamlined the process in 2024 with a single online portal and a standard 8-week decision period for many permits (extensions up to 26 weeks), yet cumulative spatial constraints remain binding in energy-dense provinces. Coastal logistics corridors must also stay open: the Port of Rotterdam alone spans 42 km of waterfront with ~28,000 annual sea calls, all of which must co-exist with offshore grid landfalls, hydrogen corridors and e-fuel projects. These hard spatial numbers underscore why integrated planning and repowering existing sites are pivotal.
Price volatility and frequent negative wholesale hours challenge revenue stability: Intermittency combined with limited flexibility is reshaping price formation. On the EPEX day-ahead market, the Netherlands posted 316 negative-price hours in 2023, reflecting frequent midday oversupply. The count rose further: analyses of 2024 trading show ~458 negative-price hours in the Netherlands, a steep increase that complicates merchant exposure for solar- and wind-heavy portfolios and can erode capture prices without storage or demand response. ENTSO-E and IEA commentary corroborate a Europe-wide rise in negative occurrences as solar additions accelerate—evidence that flexibility (batteries, electrolysers, demand shifting) must scale alongside generation. Asset owners therefore need hedging, hybridization, and ancillary-services strategies to stabilize cash flows in a system with hundreds of sub-zero price hours.
What are the Regulations and Initiatives which have Governed the Market:
Environment and Planning Act (Omgevingswet) — “one-stop” permits with defined decision terms: Since 2024, the Omgevingswet consolidates environmental and spatial rules and routes most project applications via the Omgevingsloket. For many permits, authorities must decide within 8 weeks, extendable to 26 weeks for complex cases—figures that help developers plan critical path for wind, solar, storage and grid connections. The Act’s integrated approach reduces duplication across municipal, provincial and national bodies and creates a common digital record, which is vital when projects traverse multiple jurisdictions (e.g., offshore landfalls into industrial clusters). In a high-density country with thousands of concurrent construction and network works, regulated time boxes and a single portal materially lower process risk and cost of delay.
Offshore Wind Energy Act & IJmuiden Ver permitting — large, standardized sites: Dutch offshore wind licensing proceeds via site-specific Ministerial Orders under the Offshore Wind Energy Act. In 2024, the state awarded two permits at IJmuiden Ver totaling 4,000 MW (Alpha and Beta, 2,000 MW each) to consortia required to meet system-integration and ecological criteria. This scale matches TenneT’s 2-GW HVDC connection standard, enabling repeatable engineering and predictable construction interfaces from platform to onshore converter. The framework’s clarity on site size, grid role and evaluation method (comparative test with financial offer) helps bidders quantify risk and align port logistics, vessel campaigns and supply chain commitments.
Guarantees of Origin (GoO) — national registry (VertiCer) linking metered output to claims: The Netherlands issues digital Guarantees of Origin as evidence of renewable generation; one GoO equals 1 MWh of electricity (or renewable heat) tied to a specific installation, time and location. GoOs are a prerequisite for subsidy eligibility and are cancellable against supply portfolios to substantiate “green” consumption. Administration is handled by VertiCer, the national body created from CertiQ and Vertogas integration, which also tracks renewable heat and green gas. Certificates have a validity of one year after the month of production, anchoring disclosure and preventing carryover of outdated claims. For developers, rigorous issuance and retirement records reduce offtake disputes and enable structured PPAs and corporate claims.
Netherlands Renewable Energy Market Segmentation
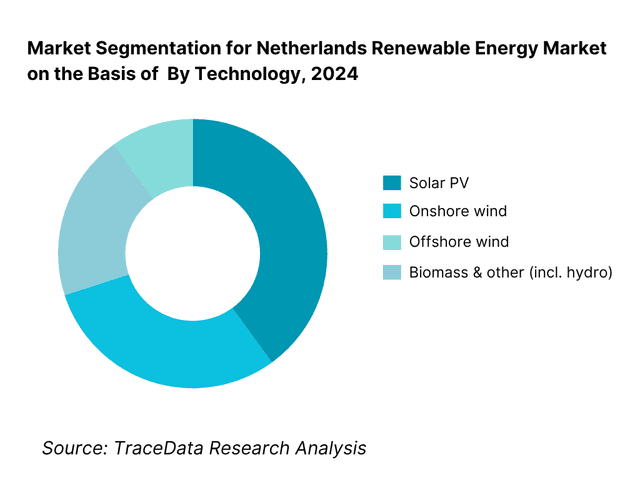
By Technology: The Netherlands Renewable Energy market is segmented by technology into solar PV, onshore wind, offshore wind, and biomass & other (incl. waste-to-energy, hydro, geothermal). Recently, solar PV has consolidated a leading position within electricity additions due to favorable SDE++ support, rapid rooftop proliferation and falling module costs, while onshore wind retains deep grid reach and mature permitting pipelines. Offshore wind is scaling on the back of multi-GW zones and port infrastructure, and biomass & other provide system balancing and CHP contributions. In electricity output terms, solar and wind jointly dominate; wind’s split between onshore and offshore underscores port-centric supply chains and TenneT’s offshore grid build-out.
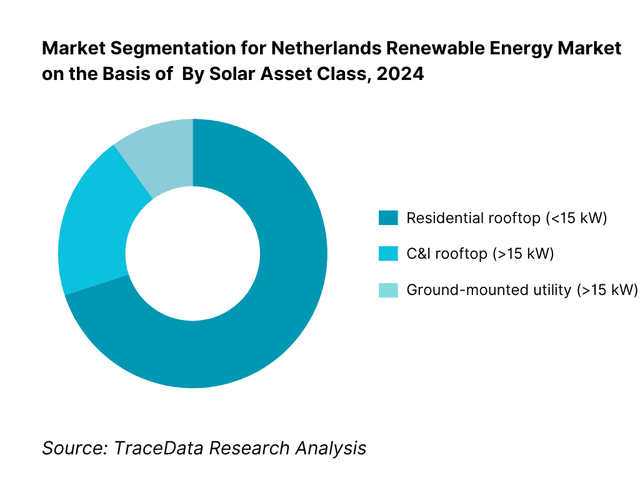
By Solar Asset Class: Netherlands Renewable Energy market is segmented by solar asset class into residential rooftop (<15 kW), C&I rooftop (>15 kW), and ground-mounted utility (>15 kW). Recently, residential rooftop holds a dominant share because of widespread net-metering legacy, abundant small-roof stock, fast install cycles and standardized kit availability through national installers. C&I rooftops accelerate via corporate decarbonization and onsite economics for warehouses/logistics, while ground-mounted parks expand where land-use consents, grid capacity and environmental co-use (agrivoltaics, buffer zones) align. This pattern mirrors the Netherlands’ urban density and port-centric land constraints, which naturally prioritize rooftops for speed-to-power and grid-friendly profiles.
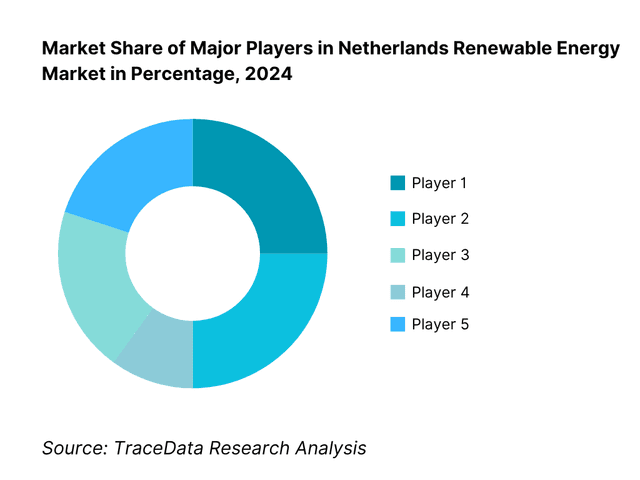
Competitive Landscape in Netherlands Renewable Energy Market
The Netherlands renewable energy competitive landscape features integrated utilities, IPPs, funds and maritime EPCIs. Scale effects in offshore wind (port access, vessels, financing capability) and portfolio hedging across onshore/solar provide durable advantages. Recent North Sea tenders, corporate PPAs, grid-congestion risk management and storage adjacency (BESS) are key battlegrounds. A handful of multinationals and strong domestic champions (Eneco, Shell’s joint ventures) shape auctions and merchant strategies, while Dutch EPCIs (Van Oord, Boskalis) underpin installation and O&M depth.
Name | Founding Year | Original Headquarters |
Vattenfall | 1909 | Stockholm, Sweden |
Eneco (incl. Ecowende/CrossWind JVs) | 1995 | Rotterdam, Netherlands |
RWE | 1898 | Essen, Germany |
Ørsted | 1972 | Fredericia, Denmark |
Shell Renewables & Energy Solutions | 1907 | The Hague, Netherlands |
Equinor | 1972 | Stavanger, Norway |
Statkraft | 1895 | Oslo, Norway |
TotalEnergies Renewables NL | 1924 | Paris, France |
Northland Power | 1987 | Toronto, Canada |
Copenhagen Infrastructure Partners | 2012 | Copenhagen, Denmark |
Some of the Recent Competitor Trends and Key Information About Competitors Include:
Vattenfall: As one of the leading offshore wind developers in the Netherlands, Vattenfall fully commissioned the 1,500 MW Hollandse Kust Zuid project in 2024, pairing generation with multi-year corporate PPAs and advanced wake-steering pilots to improve yields and stabilize merchant exposure.
Eneco / Ecowende: Known for its integrated utility-developer model, Eneco’s Ecowende JV advanced the biodiversity-first Hollandse Kust West VI (~760 MW) program in 2024, initiating ecological monitoring, supply-chain contracting, and grid-readiness work to de-risk construction while meeting stringent nature-inclusive criteria.
RWE: Specializing in large-scale renewables across wind and solar, RWE progressed the OranjeWind (~795 MW) offshore wind project in 2024, aligning permitting, early works, and offtake preparations, while expanding Dutch onshore repowering and solar pipelines to enhance portfolio balancing and flexibility.
Shell (CrossWind JV): A major energy transition player, Shell’s CrossWind (with Eneco) brought the 759 MW Hollandse Kust Noord wind farm into full operation in 2024, launching innovation pilots including floating solar, battery storage, and turbine wake-steering to boost system resilience and integrate variable output.
Northland Power: Operator of the 600 MW Gemini offshore wind farm, Northland Power focused in 2024 on O&M optimization and digital performance analytics, leveraging multi-year reliability data to increase availability, reduce corrective maintenance, and strengthen cash-flow predictability for Dutch offshore assets.
What Lies Ahead for the Netherlands Renewable Energy Market?
The Netherlands renewable energy market is poised for strong expansion through the forecast horizon, anchored by multi-gigawatt offshore wind zones, rapid rooftop/C&I solar adoption, and accelerating electrification of heat and mobility. Standardized 2-GW HVDC offshore grid links, grid-reinforcement programs, and a maturing corporate PPA ecosystem will help translate pipeline into operating assets. As flexibility scales via batteries, electrolysers, and demand response, developers will increasingly stack revenues across energy, capacity, and ancillary services while meeting stricter nature-inclusive and system-integration criteria.
Rise of Hybrid Project Models: The next phase will see hybridization become standard—co-locating offshore wind with floating solar, batteries, and onshore electrolysers tied to port industrial clusters. Cable pooling and shared transformers will spread onshore, allowing solar-plus-storage and wind-plus-storage to optimize connections in congested areas. Hybrids reduce curtailment risk, improve capture prices, and enable firmed delivery profiles for corporate buyers. Developers that can engineer and operate multi-asset nodes—integrating grid code compliance, forecasting, and real-time dispatch—will outcompete single-tech projects on both bankability and utilization of scarce grid capacity.
Focus on System-Value Outcomes: Policy and procurement are shifting from pure megawatt delivery to measurable system benefits. Tenders increasingly reward biodiversity safeguards, grid friendliness, and contribution to flexibility. Asset owners will prioritize storage participation in FCR/aFRR/mFRR, dynamic line-rating opportunities, and congestion-management programs, while adopting hedging constructs that blend pay-as-produced, baseload blocks, and imbalance sharing. Repowering of onshore wind and digital O&M will lift availability, and operational analytics will target fewer negative-price hours’ exposure by time-shifting output or redirecting energy to electrolysis and power-to-heat.
Expansion of Sector-Specific Electrification & Hydrogen: Decarbonization of refineries, chemicals, food processing, and logistics will pull more renewable electricity ashore. Industrial e-boilers and heat pumps will absorb midday solar, shore-power will electrify major ports, and district-heating operators will integrate geothermal and e-boilers with renewable supply. Green hydrogen, produced at coastal hubs, will emerge as a sink for windy hours and grid-constrained nodes, with oxygen/heat valorization improving project economics. Asset developers that align with cluster-level offtakers—through long-tenor CPPAs, behind-the-meter links, and pipeline-synchronized electrolyser buildouts—will unlock superior utilization and credit strength.
Leveraging AI and Analytics: AI-driven forecasting, curtailment prediction, and bid automation will become core differentiators. Owners will deploy digital twins for turbines, inverters, and batteries, and use ML models to optimize augmentation, warranty windows, and degradation management. For traders and corporate buyers, advanced analytics will enable 24/7 carbon-matching, marginal-emission-based dispatch, and better shaping of renewable blocks to actual load. On congested grids, data-led siting and connection-sharing strategies will cut queue times and boost realized yield, while cybersecurity hardening of OT systems becomes table stakes for lenders and insurers.
Netherlands Renewable Energy Market Segmentation
By Technology
Offshore Wind
Onshore Wind
Solar PV – Rooftop
Solar PV – Ground-mount
Bioenergy & Waste-to-Energy
Geothermal & Aquathermal
Hydro & Others
By Application / End-Use
Utility-scale power
Commercial & Industrial onsite
Residential prosumers
District heating & heat networks
E-mobility ecosystems
Green hydrogen / electrolyzers
By Market Mechanism / Offtake Model
SDE++/CfD-supported generation.
Merchant/market-exposed (day-ahead/imbalance).
Corporate PPAs
Ancillary & Flex Services
Community/Cooperatives
Renewable Heat & GoOs/CoOs backed deliveries.
By Project Configuration
Single-technology assets
Hybrid co-located
Grid-optimized
Repowering
Behind-the-meter microgrids
Agrivoltaics & dual-use
By Grid Connection & Status
Connection type
Status
Balancing setup
Players Mentioned in the Report:
Vattenfall
Eneco (incl. Ecowende/CrossWind JVs)
RWE
Shell Renewables & Energy Solutions (NL)
Ørsted
SSE Renewables
Copenhagen Infrastructure Partners (CIP/Zeevonk)
Equinor
Statkraft
Northland Power
Iberdrola
Vestas
Siemens Gamesa
Van Oord
Boskalis.
Key Target Audience
Utility and IPP leadership teams
Project developers & EPC/EPCI contractors (offshore & onshore)
Component OEMs and Tier-1 suppliers (turbines, inverters, cables)
Large industrial & data-center offtakers (corporate PPAs)
Grid and flexibility providers (DSOs/aggregators, storage operators)
Investments and venture capitalist firms (infrastructure funds, climate-tech VC)
Government and regulatory bodies
Ports, O&M bases and maritime logistics operators
Time Period:
Historical Period: 2019-2024
Base Year: 2025
Forecast Period: 2025-2030
See What's Inside the Report
Get a preview of key findings, methodology and report coverage
Table of Contents
1. Executive Summary [installed capacity (GW) by technology; RES share in electricity (%); pipeline by stage (GW); LCOE bands (-c/kWh) by tech; PPA price corridor (-/MWh) range; auction/tender outcomes overview; grid congestion severity index; capex/opex benchmarks]
2. Research Methodology [market definitions & scoping; top-down/bottom-up sizing; data triangulation; primary interviews (developers/TSO/DSOs/offtakers/banks); forecasting logic & scenarios; assumptions & limitations; glossary of NL-specific terms]
3. Ecosystem of Key Stakeholders in Netherlands Renewable Energy Market [ministries/regulators (EZK, ACM); TSO/DSOs (TenneT, Alliander, Enexis, Stedin); project developers/IPPs; OEMs/EPCs/ports; financiers & insurers; corporate offtakers & traders; community/co-ops; research institutes & NGOs]
4. Value Chain Analysis [resource assessment → site control → permitting/EIA → grid connection → financing → EPC/supply chain → commissioning → O&M/asset management → trading/imbalance management → repowering/decommissioning; margin pools by stage; bottlenecks/lead times]
4.1. Delivery Model Analysis for Renewable Energy-Utility-Scale, C&I Onsite, Community Energy, Merchant IPP, Hybrid Co-Located [gross margin/IRR ranges; buyer preference by offtaker class; strengths/weaknesses; risk allocation; scalability & grid access]
4.2. Revenue Streams for Netherlands Renewable Energy Market [SDE++/CfD; merchant day-ahead; corporate/sleeved/virtual PPA; Guarantees of Origin; ancillary & flex markets (FCR/aFRR/mFRR); congestion management/capacity curtailment compensation; balancing service premiums; revenue stacking mix]
4.3. Business Model Canvas for Netherlands Renewable Energy Market [customer segments (utilities, C&I, communities); value propositions (price hedging, 24/7 matching); key partners (ports, OEMs, DSOs); key activities (development, trading, O&M); key resources (grid rights, permits); cost structure (capex-/MW, opex-/kW-yr); KPIs (availability %, yield MWh/MW, curtailment %)]
5. Market Structure [ownership models (utility, IPP, community); concentration (HHI); asset mix by tech; contract mix (CfD/merchant/CPPA); provincial & offshore zone distribution]
5.1. External O&M/EPC Contractors vs In-House Operations [workforce intensity (FTE/MW); opex-/kW-yr; availability & response SLAs; warranty coverage; digitalization maturity]
5.2. Investment Model in Netherlands Renewable Energy Market [project finance vs hold-co; leverage/DSCR norms; WACC bands; debt tenor & hedging; risk mitigants (flooring, collars, baseload PPAs); refinancing/asset rotation]
5.3. Comparative Analysis of the Project Funnelling Process-Private Developers vs Government-Led Tenders [pre-qualification criteria; tender scoring (price/qualitative); win-rate %; stage-gate cycle time (site→FID→COD); permitting timelines]
5.4. Corporate Renewable Procurement Budget Allocation by Company Size, 2024 [Large, Mid-market, SME;-/MWh budgets; % load under CPPAs/GoO; tenor & indexation preferences; credit/ESG constraints]
6. Market Attractiveness for Netherlands Renewable Energy Market [province/offshore zone heatmap; resource quality; grid access & connection wait; policy/regulatory stability; LCOE vs market prices; supply-chain readiness; ESG & biodiversity risk; overall investment score]
7. Supply-Demand Gap Analysis [demand growth (TWh); RES generation & firming needs; capacity adequacy (GW); storage/flex requirement (MW/MWh); grid capacity vs requested connections; hydrogen & heat demand pull]
8. Market Size for Netherlands Renewable Energy Market Basis
8.1. Revenues, 2019-2024
9. Market Breakdown for Netherlands Renewable Energy Market Basis
9.1. By Market Structure (Utility-Owned, IPP-Owned, Cooperative/Community, Corporate Onsite), 2023-2024P [installed MW; value %; pipeline share]
9.2. By Technology (Offshore Wind, Onshore Wind, Solar PV Rooftop, Solar PV Ground-Mount, Bioenergy, Geothermal), 2023-2024P [value %; MW; yield factors]
9.3. By Offtaker Segment (Utilities/Traders, C&I, Residential Prosumers, Municipal/District Heating, Hydrogen/Electrolyzers), 2023-2024P [volume (TWh); contract tenor mix; balancing obligations]
9.4. By Project Size (Utility-Scale, Large C&I, SME Rooftop, Residential), 2023-2024P [ticket size; capex-/MW; connection type]
9.5. By Asset Stage (Operational, Under Construction, Tendered/Awarded, Permitting, Early Development), 2023-2024P [MW; probability-weighted value]
9.6. By Offtake Model (SDE++/CfD, Corporate PPA, Merchant, Ancillary/Flex), 2023-2024P [revenue mix; risk weighting]
9.7. By Project Configuration (Single-Tech Standardized, Hybrid/Co-Located, Repowering, Agrivoltaic), 2023-2024P [capex premium/discount; yield uplift; grid utilization]
9.8. By Region (North Sea Offshore Zones; North Holland; South Holland; Zeeland; Groningen/Friesland/Drenthe; Flevoland/Overijssel/Gelderland; Utrecht/Brabant/Limburg), 2023-2024P [MW; value %; queue times]
10. Demand-Side Analysis for Netherlands Renewable Energy Market
10.1. Corporate Client Landscape and Cohort Analysis [by sector, electricity intensity, RE100/CSRD status; procurement maturity; credit quality]
10.2. Renewable Procurement Needs and Decision-Making Process [drivers & KPIs; board approval thresholds; risk policy; procurement timelines]
10.3. Program Effectiveness and ROI Analysis [hedge effectiveness vs spot; avoided emissions (tCO₂); payback & IRR; curtailment impact]
10.4. Gap Analysis Framework [capability gaps-origination, balancing, measurement & certification; solutions roadmap]
11. Industry Analysis
11.1. Trends and Developments for Netherlands Renewable Energy Market [subsidy-lite auctions; cable pooling; VPP participation; dynamic grid tariffs; co-location with BESS; repowering surge]
11.2. Growth Drivers for Netherlands Renewable Energy Market [offshore wind roadmap; RES targets; electrification; hydrogen offtake; EV charging]
11.3. SWOT Analysis for Netherlands Renewable Energy Market [resource quality; innovation; regulatory stability; grid congestion]
11.4. Issues and Challenges for Netherlands Renewable Energy Market [permitting timelines; marine spatial constraints; OEM supply-chain; financing costs; community acceptance]
11.5. Government Regulations for Netherlands Renewable Energy Market [SDE++; ACM & grid codes; North Sea Agreement; GoO registry; hydrogen certification]
12. Snapshot on Corporate PPA, C&I Rooftop Solar & Flex/Online Trading Platforms
12.1. Market Size and Future Potential in the Netherlands, 2018-2029 [C&I PV MW &-; CPPAs signed; platform transactions]
12.2. Business Models and Revenue Streams [onsite PPA, lease, capex sale; vPPA; flexibility aggregation]
12.3. Delivery Models and Types of Solutions Offered [rooftop/ground C&I; PV+BESS; 24/7 matching services; certificate management]
12.4. Cross-Comparison of Leading C&I/CPPA Players [company overview; investments/funding; revenues; portfolio (MW/MWh); revenue streams; #sites & average size; pricing basis; digital capabilities]
13. Opportunity Matrix for Netherlands Renewable Energy Market-Radar Chart [axes: resource, grid access, policy stability, revenue stack depth, LCOE advantage, supply-chain readiness, ESG impact, execution risk]
14. PEAK Matrix Analysis for Netherlands Renewable Energy Market [leaders; major contenders; aspirants; assessment on scale, growth, technology depth, go-to-market, balance responsibility]
15. Competitor Analysis for Netherlands Renewable Energy Market
15.1. Market Share of Key Players by Revenues/Installed Base, 2023 [offshore/onshore/solar splits; tender wins]
15.2. Benchmark of Key Competitors [company overview; USP; strategy; business model; #employees & skill mix; asset portfolio (MW/MWh); pricing & PPA basis; technology stack; top clients/offtakers; partnerships; marketing/origination; recent developments]
15.3. Operating Model Analysis Framework [central vs regional ops; O&M model; build-own-operate vs build-sell-operate; trading & balancing setup]
15.4. Gartner-Style Magic Quadrant Mapping [ability to execute vs completeness of vision; quadrant placement rationale]
15.5. Bowman’s Strategic Clock for Competitive Advantage [price/value positioning; differentiation levers; risk-return profiles]
16. Future Market Size for Netherlands Renewable Energy Market Basis
16.1. Revenues, 2025-2030
17. Market Breakdown for Netherlands Renewable Energy Market Basis
17.1. By Market Structure (Utility, IPP, Cooperative/Community, Corporate Onsite), 2025-2030 [value %; MW; pipeline]
17.2. By Technology (Offshore Wind, Onshore Wind, Solar PV Rooftop, Solar PV Ground-Mount, Bioenergy, Geothermal), 2025-2030 [value %; MW; yield]
17.3. By Offtaker Segment (Utilities/Traders, C&I, Residential, Municipal/District Heating, Hydrogen/Electrolyzers), 2025-2030 [TWh; contract tenor]
17.4. By Project Size (Utility-Scale, Large C&I, SME Rooftop, Residential), 2025-2030 [capex ticket; connection type]
17.5. By Asset Stage (Operational, Under Construction, Tendered/Awarded, Permitting, Early Development), 2025-2030 [MW; probability-weighted]
17.6. By Offtake Model (SDE++/CfD, Corporate PPA, Merchant, Ancillary/Flex), 2025-2030 [revenue mix; risk]
17.7. By Project Configuration (Single-Tech, Hybrid/Co-Located, Repowering, Agrivoltaic), 2025-2030 [yield & grid utilization]
17.8. By Region (Offshore Zones; North/South Holland; Zeeland; Groningen/Friesland/Drenthe; Flevoland/Overijssel/Gelderland; Utrecht/Brabant/Limburg), 2025-2030 [MW; value %]
18. Recommendation
19. Opportunity Analysis [white-space by tech/region/offtaker; entry/expansion playbooks; partnership pipeline; risk mitigations]
Discuss a Customized Research Scope
Custom research scope • Tailored insights • Industry expertise
Research Methodology
Step 1: Ecosystem Creation
Map the ecosystem and identify all the demand-side and supply-side entities for the Netherlands Renewable Energy Market. Based on this ecosystem, we will shortlist leading 5-6 market players in the country based on their financial information, market reach, and client/offtaker base. Sourcing is conducted through industry articles, multiple secondary, and proprietary databases to perform desk research around the market to collate industry-level information.
Step 2: Desk Research
Subsequently, we engage in an exhaustive desk research process by referencing diverse secondary and proprietary databases. This approach enables us to conduct a thorough analysis of the market, aggregating industry-level insights. We delve into aspects like generation volumes, installed capacity, project pipeline, grid connection status, pricing structures, demand, and other variables. We supplement this with detailed examinations of company-level data, relying on sources like press releases, annual reports, financial statements, regulatory filings, and similar documents. This process aims to construct a foundational understanding of both the market and the entities operating within it.
Step 3: Primary Research
We initiate a series of in-depth interviews with C-level executives and other stakeholders representing various Netherlands Renewable Energy Market companies and end-users. This interview process serves a multi-faceted purpose: to validate market hypotheses, authenticate statistical data, and extract valuable operational and financial insights from these industry representatives. A bottom-to-top approach is undertaken to evaluate capacity and revenue contributions for each player, thereby aggregating to the overall market. As part of our validation strategy, our team executes disguised interviews wherein we approach each company under the guise of potential clients/offtakers. This approach enables us to validate the operational and financial information shared by company executives, corroborating this data against what is available in secondary databases. These interactions also provide us with a comprehensive understanding of revenue streams, value chains, processes, pricing, balancing responsibilities, and other factors.
Step 4: Sanity Check
A bottom-to-top and top-to-bottom analysis along with market size modeling exercises is undertaken to assess the sanity of the process.
See What's Inside the Report
Get a preview of key findings, methodology and report coverage
Frequently Asked Questions
The Netherlands Renewable Energy Market is poised for substantial expansion, underpinned by multi-gigawatt offshore wind zones, a vast and growing rooftop/C&I solar base, accelerating electrification of heat and mobility, and a mature corporate PPA ecosystem. Standardized 2-GW HVDC offshore grid links, continued SDE++ support, and cluster demand from industrial ports (Rotterdam/Maasvlakte, Eemshaven, IJmuiden, Vlissingen/Borssele) create a durable runway for project conversion from pipeline to operations. Nature-inclusive tender criteria and grid-friendly hybrid designs further enhance bankability and system value, positioning the market for strong, sustained growth.
The Netherlands Renewable Energy Market features several key players, including Vattenfall, Eneco (and JVs such as Ecowende/CrossWind), RWE, and Shell Renewables & Energy Solutions. These companies dominate due to deep development pipelines, port and installation capabilities, balance-responsible trading, and extensive offtaker relationships. Other notable players include Ørsted, TotalEnergies, Northland Power, Statkraft, and Copenhagen Infrastructure Partners (CIP), alongside strong domestic solar owners such as Sunrock, GroenLeven (BayWa r.e.), and Solarfields.
Primary growth drivers include the North Sea offshore wind roadmap with multi-site awards aligned to standardized 2-GW grid connections; rapid diffusion of rooftop and C&I solar supported by established installer networks and revenue mechanisms; and surging demand from electrification of industry, heat, and transport. Additional momentum comes from corporate decarbonization (RE100/CSRD), expansion of flexibility resources (batteries, electrolysers, demand response), and policy stability through instruments like SDE++, Guarantees of Origin, and clear seabed/spatial planning, all of which reduce development risk and enhance financing conditions.
The market faces grid congestion and lengthy connection queues in solar-rich and industrial regions, which can delay energization and increase curtailment risk; spatial and environmental constraints that require nature-inclusive design and careful routing across dense onshore corridors and protected marine areas; and rising operational complexity from frequent negative-price hours and balancing costs, necessitating advanced hedging, storage co-location, and flexible offtake structures. Supply-chain lead times, installation windows, and permitting coordination across multiple authorities further test schedules and capital efficiency.
License Options
PDF + Excel
Complete report package
$4,000
Excel Only
Data and analytics
$2,500