New Zealand Cold Chain Market Outlook to 2029
By Market Structure, By End-Users, By Temperature Type, By Product Category, By Region
Report Overview
Report Code
TDR0187
Coverage
Asia
Published
May 2025
Pages
80
Flexible Purchase Options
Select and purchase only the chapters you need for your strategic decisions
On This Page
Report Overview
The report titled “New Zealand Cold Chain Market Outlook to 2029 – By Market Structure, By End-Users, By Temperature Type, By Product Category, By Region” provides a comprehensive analysis of the cold chain logistics market in New Zealand. The report covers an overview and genesis of the industry, overall market size in terms of revenue, market segmentation, trends and developments, regulatory landscape, customer-level profiling, issues and challenges, and comparative landscape including competition scenario, cross comparison, opportunities and bottlenecks, and company profiling of major players in the cold chain industry.
Report Coverage
Verified Market Sizing
Multi-layer forecasting with historical data and 5–10 year outlook
Deep-Dive Segmentation
Cross-sectional analysis by product type, end user, application and region
Competitive Benchmarking & Positioning
Market share, operating model, pricing and competition matrices
Actionable Insights & Risk Assessment
High-growth white spaces, underserved segments, technology disruptions and demand inflection points
Review Methodology & Data Structure
Preview report structure, data sources and research framework
Executive Summary
The report titled “New Zealand Cold Chain Market Outlook to 2029 – By Market Structure, By End-Users, By Temperature Type, By Product Category, By Region” provides a comprehensive analysis of the cold chain logistics market in New Zealand. The report covers an overview and genesis of the industry, overall market size in terms of revenue, market segmentation, trends and developments, regulatory landscape, customer-level profiling, issues and challenges, and comparative landscape including competition scenario, cross comparison, opportunities and bottlenecks, and company profiling of major players in the cold chain industry. The report concludes with future market projections based on revenue by temperature zone, product type, end-use vertical, and success case studies highlighting the major opportunities and cautions.
New Zealand Cold Chain Market Overview and Size
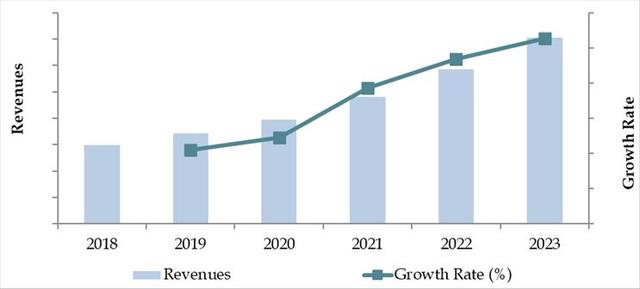
The New Zealand cold chain market was valued at NZD 1.3 Billion in 2023, driven by the rising demand for temperature-controlled logistics across the food, pharmaceutical, and agricultural sectors. The growth is supported by increasing exports of dairy and meat products, rising urbanization, and stringent food safety regulations. Major players in the cold chain market include Halls Group, Big Chill Distribution, Temperature Controlled Storage & Logistics (TCSL), and VersaCold. These companies are recognized for their advanced cold storage facilities, fleet size, and integrated supply chain capabilities.
In 2023, Halls Group expanded its temperature-controlled fleet to meet growing demand from supermarkets and export-oriented producers. Auckland and Canterbury emerged as key regions, given their high concentration of food processing units and export terminals.
Market Size for New Zealand Cold Chain Industry on the Basis of Revenues in USD Million, 2018-2024
What Factors are Leading to the Growth of New Zealand Cold Chain Market:
Export-Driven Agriculture: New Zealand’s economy is heavily reliant on exports of perishable goods such as dairy, meat, and seafood. In 2023, dairy exports alone accounted for over 30% of cold chain volume. This necessitates a robust and reliable cold storage and transportation network to maintain product quality across long international shipping routes.
Stringent Food Safety Regulations: Regulatory mandates under the Food Act 2014 and associated Ministry for Primary Industries (MPI) standards have compelled producers and distributors to adopt advanced cold chain practices. Compliance has increased investments in temperature monitoring, refrigerated logistics, and traceability systems.
Pharmaceutical Supply Chain Expansion: Post-COVID-19, there has been a marked rise in temperature-controlled pharmaceutical logistics, especially for vaccines and biologics. This segment grew by 14% YoY in 2023, contributing significantly to the cold chain infrastructure modernization.
Which Industry Challenges Have Impacted the Growth for New Zealand Cold Chain Market
Infrastructure Gaps in Remote Regions: Despite robust cold chain infrastructure in urban hubs like Auckland and Christchurch, rural and remote regions face significant cold storage and last-mile delivery constraints. A 2023 logistics study indicated that approximately 28% of cold chain losses occur in the final distribution leg, especially in underserved regions. This challenge has limited market penetration in geographically dispersed areas.
High Operational Costs: Energy consumption and fuel costs significantly impact the cost structure of cold chain logistics. On average, 30–35% of total operational expenses are attributed to refrigeration energy use. These costs are exacerbated by New Zealand’s rising electricity tariffs and long-haul distances, leading to pricing pressures, particularly for small- and mid-sized cold storage operators.
Shortage of Skilled Workforce: The industry continues to face a shortage of trained personnel for cold chain monitoring, compliance, and equipment maintenance. In 2023, industry bodies reported that nearly 1 in 4 cold chain companies had difficulty hiring and retaining qualified technical staff, affecting service quality and uptime.
What are the Regulations and Initiatives which have Governed the Market:
MPI Cold Chain Compliance Standards: The Ministry for Primary Industries (MPI) sets stringent guidelines for temperature control, hygiene, and traceability across the cold supply chain. As per the 2022 MPI audit, around 82% of registered cold chain facilities complied fully with prescribed temperature and handling regulations, while others were flagged for issues related to documentation and monitoring systems.
Biosecurity and Export Protocols: Cold chain infrastructure must comply with New Zealand’s strict biosecurity and export certification regulations, especially for meat and dairy exports. These include mandatory temperature logs, tamper-proof seals, and RFID tagging. In 2023, new digital certification systems were implemented to streamline customs compliance, reducing average export clearance time by 18%.
Sustainability and Emissions Controls: New Zealand’s Zero Carbon Act mandates emission reductions across logistics operations. Cold chain firms are now subject to carbon reporting obligations and are incentivized to transition to low-emission refrigeration systems and EV-based distribution fleets. In 2023, 12% of cold chain vehicles adopted electric or hybrid propulsion systems under government-supported fleet modernization programs.
New Zealand Cold Chain Market Segmentation
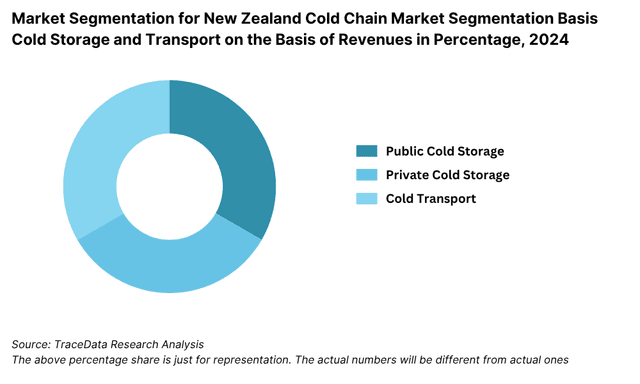
By Market Structure: The organized segment dominates the cold chain market, driven by large players with integrated logistics networks, modern cold storage infrastructure, and compliance with international food safety and pharmaceutical standards. These include specialized logistics providers and 3PL companies offering end-to-end cold chain solutions. The unorganized segment, consisting of smaller regional operators, contributes significantly in rural areas but lacks standardization and digital monitoring systems. However, they remain crucial for last-mile delivery in remote zones.
By Temperature Type: The market is categorized into Chilled (0°C to 4°C) and Frozen (-18°C and below) segments. The frozen segment commands a higher share due to New Zealand's strong meat and seafood export market, which requires ultra-low temperature logistics. Chilled logistics are primarily used for dairy, fresh produce, and pharmaceuticals with shorter shelf lives.
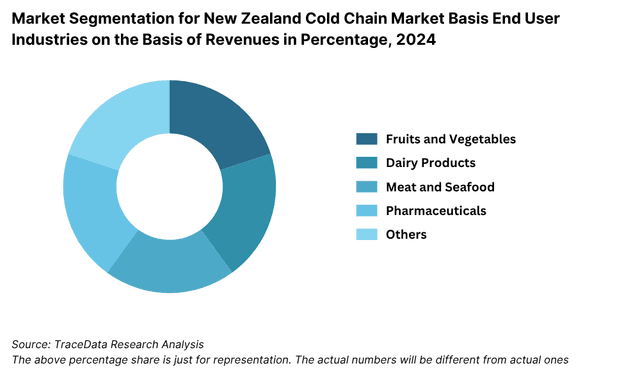
By End-User Industry: The food & beverage sector leads cold chain demand, especially dairy, seafood, meat, and fresh produce. The pharmaceutical industry follows, driven by vaccines, biologicals, and temperature-sensitive medications. The retail and e-commerce segment is rapidly growing, particularly for frozen and chilled food deliveries in urban regions.
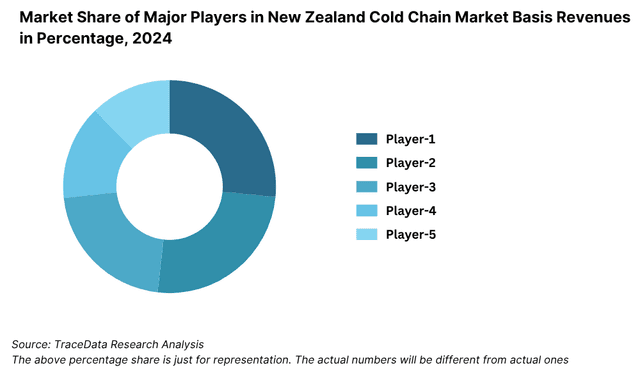
Competitive Landscape in New Zealand Cold Chain Market
The New Zealand cold chain market is moderately consolidated, with a handful of specialized logistics providers and asset-based players controlling a significant portion of the market. However, the market is gradually evolving with the entry of tech-driven logistics platforms and infrastructure investors expanding cold storage and transportation capabilities across the country. Major companies include Halls Group, Big Chill Distribution, VersaCold, TCSL (Temperature Controlled Storage & Logistics), Swire Cold Storage, and NZ Cold Storage Ltd.
| Company Name | Founding Year | Original Headquarters |
| Big Chill Distribution Ltd. | 1996 | Auckland, New Zealand |
| Halls Group Ltd. | 1970s | Auckland, New Zealand |
| Toll Group (Cold Chain NZ Division) | 1888 | Melbourne, Australia |
| Mainfreight Ltd. (Cold Chain Division) | 1978 | Auckland, New Zealand |
| Fonterra Co-operative Group Ltd. (In-house cold chain for dairy) | 2001 | Auckland, New Zealand |
| Peter Baker Transport (PBT Group) | 1972 | Wellington, New Zealand |
| VersaCold Logistics Services (NZ Ops) | 1946 | Vancouver, Canada |
| Emergent Cold (via NZ acquisitions, now Lineage) | 2017 (NZ: ~2018) | Dallas, Texas, USA |
| Lineage Logistics New Zealand | 2008 (NZ: ~2020) | Novi, Michigan, USA |
| Polarcold Stores Ltd. (acquired by Emergent/Lineage) | 1990s | Hawke’s Bay, New Zealand |
| Swire Cold Storage (NZ Operations) | 1955 | Sydney, Australia |
| Coolpak Coolstores Ltd. | 1955 | Christchurch, New Zealand |
| CT Freight (Cold Chain Freight Forwarding) | 1981 | Sydney, Australia |
Some of the recent competitor trends and key information about competitors include:
Halls Group: A legacy player in refrigerated logistics, Halls Group operates one of the largest temperature-controlled transport fleets in the country. In 2023, the company expanded its automated cold storage facility in Auckland, increasing throughput capacity by 15% and reducing energy consumption by 10%.
Big Chill Distribution: Known for its focus on fast-moving chilled goods, Big Chill has established a strong footprint in urban grocery supply chains. The company reported 12% YoY growth in deliveries to national supermarkets, with new investments in multi-temperature vehicles.
VersaCold: Specializing in integrated logistics for frozen meat and dairy exports, VersaCold is a major partner to New Zealand’s agribusiness exporters. In 2023, the company implemented real-time temperature tracking across 100% of its fleet, enhancing traceability and compliance with global food safety protocols.
TCSL: A rapidly growing regional player, TCSL serves niche clients in pharmaceuticals and fresh produce. In 2023, TCSL opened its third cold storage hub in Waikato, focused on high-volume perishable food handling.
NZ Cold Storage Ltd: Focused primarily on South Island logistics, NZ Cold Storage has strengthened its operational presence in Invercargill and Dunedin. The company recently invested in solar-powered refrigeration units, contributing to sustainability goals under New Zealand’s Zero Carbon Act.
Swire Cold Storage: A division of Swire Group, the company provides full-service storage and distribution across New Zealand. It reported 8% market share growth in frozen food logistics in 2023, supported by new distribution contracts with major QSR chains and seafood exporters.
What Lies Ahead for New Zealand Cold Chain Market?
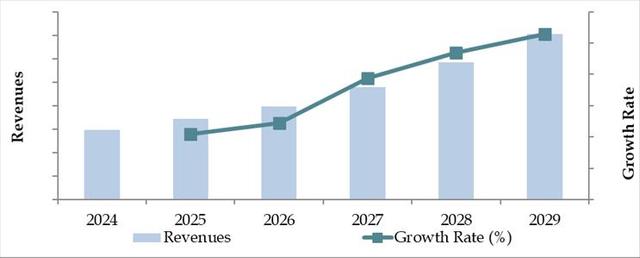
The New Zealand cold chain market is projected to witness sustained growth through 2029, driven by rising food and pharmaceutical exports, increasing urbanization, and advancements in logistics technology. The market is expected to record a respectable CAGR during the forecast period as demand for reliable temperature-controlled solutions continues to expand across industries.
Rising Export Demand for Perishables: With continued global demand for high-quality dairy, meat, and seafood products from New Zealand, the cold chain infrastructure will play a pivotal role in maintaining product integrity across long export routes. Export-oriented investments, especially in automated cold storage near ports like Auckland and Tauranga, will further stimulate market expansion.
Growth of Pharmaceutical Cold Chain: The increasing complexity of pharmaceutical logistics—especially with biologics, vaccines, and temperature-sensitive drugs—is expected to drive a significant surge in demand. The pharma cold chain segment is forecasted to grow at over 10% CAGR, fueled by regulatory compliance and rising healthcare investments.
Technology-Driven Efficiency: The integration of IoT-based temperature monitoring, GPS-enabled fleet tracking, and AI-driven route optimization will transform cold chain operations. These technologies will help reduce spoilage, enhance traceability, and ensure compliance with domestic and export regulations, thereby increasing reliability and efficiency.
Sustainability and Green Logistics Initiatives: With mounting pressure to reduce emissions and meet national climate targets under the Zero Carbon Act, cold chain players are expected to adopt electric vehicles, solar-powered warehouses, and low-GWP refrigerants. Sustainability will be a key differentiator, especially for multinational clients and exporters.
Future Outlook and Projections for New Zealand Cold Chain Market on the Basis of Revenues in USD Million, 2024-2029
New Zealand Cold Chain Market Segmentation
• By Market Structure:
o Organized Sector
o Unorganized Sector
o Third-Party Logistics Providers (3PL)
o Integrated Cold Chain Operators
o Asset-Light Cold Chain Service Providers
o Government/Cooperative Cold Storage
• By Temperature Type:
o Chilled (0°C to 4°C)
o Frozen (-18°C and below)
o Controlled Room Temperature (CRT: 15°C to 25°C)
• By Product Category:
o Dairy Products
o Meat and Seafood
o Fresh Fruits and Vegetables
o Frozen Foods
o Pharmaceuticals and Biologics
o Bakery and Confectionery
• By End-User Industry:
o Food & Beverage
o Pharmaceuticals & Healthcare
o Agriculture & Horticulture
o Foodservice and QSR Chains
o E-Commerce and Retail
• By Region:
o Auckland
o Canterbury
o Wellington
o Waikato
o Otago
o Rest of New Zealand
Players Mentioned in the Report:
- Americold New Zealand
- Hall’s Group (including Icepak)
- Refrigafreighters
- Mainfreight
- Cold Chain Solutions
- Maersk New Zealand
- VersaCold Logistics
- Kerry Logistics (New Zealand)
- Toll New Zealand
- SEKO Logistics New Zealand
Key Target Audience:
• Cold Chain Logistics Companies
• Food & Beverage Exporters
• Pharmaceutical Distributors
• Government and Regulatory Authorities (e.g., Ministry for Primary Industries)
• Retail and E-Commerce Players
• Warehousing and Infrastructure Developers
• Industry Associations and Investors
Time Period:
• Historical Period: 2018–2023
• Base Year: 2024
• Forecast Period: 2024–2029
Explore Flexible Purchase Options or Have Limited Budget?
Pay only for relevant chapters • Customizable report sections
Table of Contents
Choose individual sections to purchase. Mix and match as you like.
6.1. Revenues, 2018-2024P
7.1. By Cold Storage and Cold Transport, 2023-2024P
7.2. By End-User Application (Dairy Products, Meat and Seafood, Pharmaceuticals, Fruits and Vegetables and Others), 2023-2024P
7.3. By Ownership (Owned and 3PL Cold Chain Facilities), 2023-2024P
10.1. New Zealand Cold Storage Market Size
10.1.1. By Revenue, 2018-2024P
10.1.2. By Number of Pallets, 2018-2024P
10.2. New Zealand Cold Storage Market Segmentation
10.2.1. By Temperature Range (Ambient, Chilled and Frozen), 2023-2024P
10.2.2. By End-User Application (Dairy Products, Meat and Seafood, Pharmaceuticals, Fruits and Vegetables and Others), 2023-2024P
10.2.3. By Major Cities, 2023-2024P
10.3. New Zealand Cold Storage Market Future Outlook and Projections, 2025-2029
10.3.1. By Temperature Range (Ambient, Chilled and Frozen), 2025-2029
10.3.2. By Major Cities (Manila, Quezon, Cebu and others), 2025-2029
11.1. New Zealand Cold Transport Market Size (By Revenue and Number of Reefer Trucks), 2018-2024P
11.2. New Zealand Cold Transport Market Segmentation
11.2.1. By Mode of Transportation (Land, Sea and Air), 2023-2024P
11.2.2. By Location (Domestic and International), 2023-2024P
11.3. New Zealand Cold Transport Market Future Outlook and Projections, 2025-2029
11.3.1. By Mode of Transport (Land, Sea and Air), 2025-2029
11.3.2. By Location (Domestic and International), 2025-2029
12.1. Trends and Developments in New Zealand Cold Chain Market
12.2. Issues and Challenges in New Zealand Cold Chain Market
12.3. Decision Making Parameters for End Users in New Zealand Cold Chain Market
12.4. SWOT Analysis of New Zealand Cold Chain Industry
12.5. Government Regulations and Associations in New Zealand Cold Chain Market
12.6. Macroeconomic Factors Impacting New Zealand Cold Chain Market
13.1. Parameters to be covered for Each End Users to Determine Business Potential:
13.1.1. Production Clusters
13.1.2. Market Demand, Major Products Stored, Cold Storage Companies in Guwahati catering to End Users
13.1.3. Location Preference for Each End User and their Production Plants, Preferences for Outsourcing and Captive Facility, Services Required, Facility Preferences, Decision Making Parameters
13.1.4. Cross comparison of leading end users/companies based on Headquarters, Manufacturing Plants, Products Stored, Major Products, Total Production, Cold Chain Partner, Facility Outsourced/Captive, Pallets Owned/Hired, Contact Person, Address and others
16.1. Competitive Landscape in New Zealand Cold Chain Market
16.2. Competition Scenario in New Zealand Cold Chain Market (Competition Stage, Major Players, Competing Parameters)
16.3. Key Metrics (Temperature Range, Pallet Position, Prices Charged, Occupancy Rate, Revenue (2023) and Employee Base) for Major Players in New Zealand Cold Chain Market
16.4. Company Profiles of Major Companies in New Zealand Cold Chain Market (Year of Establishment, Company Overview, Service Offered, USP, Warehousing Facilities, Warehousing Price, Cold Storage by location, Occupancy Rate, Major Clientele, Industries Catered, Employee Base, Temperature Range, Topline OPEX*, Revenue, Recent Developments, Future Strategies)
16.5. Strength and Weakness
16.6. Operating Model Analysis Framework
16.7. Gartner Magic Quadrant
16.8. Bowmans Strategic Clock for Competitive Advantage
17.1. Revenues, 2025-2029
18.1. By Cold Storage and Cold Transport, 2025-2029
18.2. By End-User Application (Dairy Products, Meat and Seafood, Pharmaceuticals, Fruits and Vegetables and Others), 2025-2029
18.3. By Ownership (Owned and 3PL Cold Chain Facilities), 2025-2029
18.4. Recommendation
18.5. Opportunity Analysis
Discuss a Customized Research Scope
Custom research scope • Tailored insights • Industry expertise
Research Methodology
Step 1: Ecosystem Creation
Map the ecosystem and identify all demand-side and supply-side entities for the New Zealand Cold Chain Market. Based on this ecosystem, we shortlist 5–6 key service providers and infrastructure players in the country, evaluating them based on parameters such as fleet size, warehouse capacity, customer base, and financial performance.
Sourcing is conducted through government and industry publications, trade portals, cold chain logistics associations, and proprietary databases to compile an initial framework of the market landscape.
Step 2: Desk Research
We conduct extensive secondary research using publicly available databases and proprietary platforms. This step helps us evaluate trends related to revenue generation, fleet expansion, cold storage capacity, geographic reach, export-linked infrastructure, and sector-wise cold chain penetration.
We further deep-dive into company-level data such as press releases, project announcements, logistics expansion plans, and regulatory compliance updates to map player-specific insights and regional cold chain infrastructure development.
Step 3: Primary Research
In-depth interviews are conducted with C-level executives, warehouse managers, logistics heads, and key decision-makers from cold chain logistics firms, end-use sectors (e.g., food exporters, pharmaceutical companies), and government agencies.
This is aimed at validating desk research insights, quantifying market size, understanding pricing mechanisms, and capturing supply chain bottlenecks.
To enhance data reliability, disguised interviews are also performed under the identity of prospective cold chain service users to assess operational realities, pricing models, and service levels firsthand.
The volume of cold storage capacity, refrigerated vehicle availability, and industry-specific requirements are gathered at a granular level and then aggregated to build a bottom-up market model.
Step 4: Sanity Check
A top-down and bottom-up triangulation approach is employed to validate market sizing and growth forecasts.
All numerical estimates undergo rigorous sensitivity analysis and cross-referencing across multiple sources to ensure accuracy and credibility of the final model.
See What's Inside the Report
Get a preview of key findings, methodology and report coverage
Frequently Asked Questions
The New Zealand cold chain market holds strong growth potential, with a valuation of NZD 1.3 Billion in 2023. This is driven by the country’s heavy reliance on perishable exports such as dairy, meat, seafood, and fresh produce. Growth is further supported by evolving consumer preferences for frozen and chilled food products, rising pharmaceutical demand, and technology-led improvements in logistics infrastructure.
The market is led by key logistics and cold storage players such as Halls Group, Big Chill Distribution, VersaCold, TCSL, Swire Cold Storage, and NZ Cold Storage Ltd. These companies are recognized for their extensive temperature-controlled fleets, strategic regional warehousing, and adherence to both domestic and export cold chain standards.
Primary growth drivers include the expansion of agri-food exports, stringent biosecurity and food safety regulations, digitization of logistics operations, and the growing role of pharmaceuticals and biologics in the healthcare supply chain. Moreover, the increasing popularity of e-grocery and food delivery services is adding to cold chain infrastructure demand, especially in metro regions.
The cold chain industry faces challenges such as high energy and transport costs, infrastructure gaps in remote areas, and a shortage of skilled technical workforce. Compliance with sustainability mandates, particularly under the Zero Carbon Act, is also driving up capital costs for upgrades. These factors can restrict smaller players and hinder scalability without strategic investments.
License Options
PDF + Excel
Complete report package
$4,000
Excel Only
Data and analytics
$2,500
Custom Sections
Starts from $100
$0