New Zealand Logistics and Warehousing Market Outlook to 2029
By Market Structure, By Type of Service (Freight Forwarding, Warehousing, Courier Express & Parcel), By End Users, By Domestic vs. International Movement, and By Region
Report Overview
Report Code
TDR0175
Coverage
Asia
Published
May 2025
Pages
80
Flexible Purchase Options
Select and purchase only the chapters you need for your strategic decisions
On This Page
Report Overview
The report titled “New Zealand Logistics and Warehousing Market Outlook to 2029 – By Market Structure, By Type of Service (Freight Forwarding, Warehousing, Courier Express & Parcel), By End Users, By Domestic vs. International Movement, and By Region” provides a comprehensive analysis of the logistics and warehousing industry in New Zealand. The report includes an overview and genesis of the industry, overall market size in terms of revenue, segmentation by service line and region, trends and developments, regulatory framework, customer behavior insights, challenges faced, and competitive landscape including market share, cross comparison, opportunities and bottlenecks, and company profiles of major...
Report Coverage
Verified Market Sizing
Multi-layer forecasting with historical data and 5–10 year outlook
Deep-Dive Segmentation
Cross-sectional analysis by product type, end user, application and region
Competitive Benchmarking & Positioning
Market share, operating model, pricing and competition matrices
Actionable Insights & Risk Assessment
High-growth white spaces, underserved segments, technology disruptions and demand inflection points
Review Methodology & Data Structure
Preview report structure, data sources and research framework
Executive Summary
The report titled “New Zealand Logistics and Warehousing Market Outlook to 2029 – By Market Structure, By Type of Service (Freight Forwarding, Warehousing, Courier Express & Parcel), By End Users, By Domestic vs. International Movement, and By Region” provides a comprehensive analysis of the logistics and warehousing industry in New Zealand. The report includes an overview and genesis of the industry, overall market size in terms of revenue, segmentation by service line and region, trends and developments, regulatory framework, customer behavior insights, challenges faced, and competitive landscape including market share, cross comparison, opportunities and bottlenecks, and company profiles of major players. The report concludes with future market projections based on revenue, service lines, and end-user industries, along with cause-effect relationships and success case studies highlighting major market trends and caution areas.
New Zealand Logistics and Warehousing Market Overview and Size
The New Zealand logistics and warehousing market was valued at NZD 11.4 Billion in 2023, driven by rapid e-commerce growth, increasing cross-border trade, and infrastructure investments in key transport corridors. The market is dominated by key players such as Mainfreight, Toll Group, Fliway Transport, NZ Post, DHL Express, and Move Logistics. These companies are known for their extensive service portfolios, integrated freight solutions, and robust warehousing capabilities.
In 2023, Mainfreight expanded its Auckland distribution center by over 20,000 sqm, improving last-mile delivery timelines and warehouse storage capabilities. Auckland, Wellington, and Christchurch serve as key logistics hubs owing to their population concentration, port access, and industrial infrastructure.
Market Size for New Zealand Logistics and Warehousing Industry on the Basis of Revenue in USD Billion, 2018-2023

What Factors are Leading to the Growth of New Zealand Logistics and Warehousing Market
Surge in E-commerce and Omnichannel Retail: In 2023, e-commerce accounted for 13.2% of total retail sales in New Zealand, leading to increased demand for third-party logistics (3PL) and warehousing support for faster inventory turnover and last-mile delivery.
Infrastructure Modernization: Significant investment in inland ports, road-rail intermodal hubs, and airport logistics infrastructure, such as the Ruakura Superhub in Hamilton, has boosted interconnectivity and supply chain efficiencies across the country.
Government Incentives and Trade Agreements: Trade agreements like the CPTPP and bilateral pacts with China and Australia have eased cross-border logistics, supporting both import-export and transshipment operations.
Which Industry Challenges Have Impacted the Growth for New Zealand Logistics and Warehousing Market
Workforce Shortages and Labor Constraints: The logistics industry in New Zealand continues to grapple with a shortage of skilled labor, particularly truck drivers and warehouse operators. A 2023 industry survey highlighted that nearly 41% of logistics companies reported difficulty in hiring qualified drivers, especially for long-haul and inter-island routes. This has led to operational delays and increased labor costs, impacting service levels and profitability.
Rising Fuel and Operating Costs: Fluctuating global oil prices and increased domestic transport fuel taxes have added cost pressures to logistics operators. In 2023, fuel costs accounted for nearly 25% of the total freight forwarding expenditure, up from 18% in 2020. These rising costs are often passed on to consumers, reducing the competitiveness of local logistics providers.
Supply Chain Disruptions and Port Congestion: Global supply chain disruptions post-pandemic and local congestion issues at key ports like Auckland and Tauranga have delayed shipments and affected throughput. In 2022–2023, average container dwell time increased to 4.2 days, up from 2.7 days in 2019. This affects inventory management and fulfillment reliability for clients relying on just-in-time logistics.
What are the Regulations and Initiatives Which Have Governed the Market
Heavy Vehicle Regulations and Compliance: The New Zealand Transport Agency (NZTA) mandates strict compliance on load capacity, vehicle safety, driver working hours, and emissions for freight operators. In 2023, over 12,000 compliance audits were conducted across logistics fleets, and 13% were found non-compliant, leading to fines and temporary suspensions.
Emissions Reduction and Sustainability Policies: Under the Zero Carbon Act and New Zealand’s Emissions Reduction Plan, logistics companies are encouraged to decarbonize their operations. This includes adopting electric fleets, optimizing routes, and reducing warehouse emissions. By end-2023, over 1,100 electric delivery vehicles had been registered nationwide under the Clean Car Discount scheme.
Warehouse Fire Safety and Hazardous Goods Licensing: Warehouses storing chemicals, pharmaceuticals, or flammable materials must secure certifications under the Hazardous Substances and New Organisms (HSNO) Act. This adds compliance requirements in terms of layout, ventilation, safety systems, and operational protocols.
New Zealand Logistics and Warehousing Market Segmentation
By Market Structure: The market is dominated by organized players, which include large logistics companies and integrated third-party logistics providers. These firms offer end-to-end services including warehousing, freight forwarding, customs clearance, and distribution. Their structured operations, digital tracking systems, and regulatory compliance make them the preferred choice among large-scale manufacturers, retailers, and e-commerce platforms. The unorganized segment, comprising small-scale freight brokers, independent truckers, and informal storage providers, continues to serve niche and regional clients, particularly in rural and inter-island logistics. However, lack of digital integration and scalability remains a limitation.
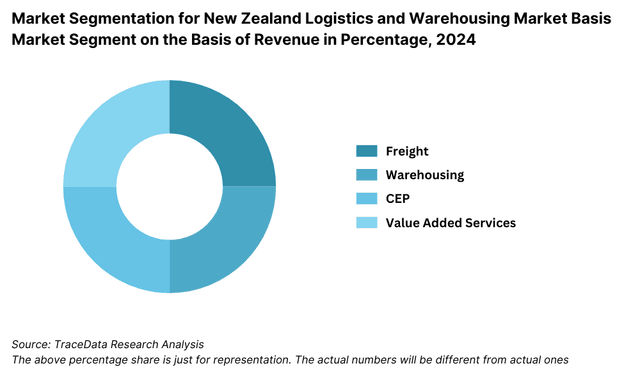
By Type of Service:Freight Forwarding accounts for the largest share due to the high volume of domestic and international cargo handled via road, sea, and air. Major players like Mainfreight and Toll operate integrated multimodal transport solutions. Warehousing Services are the second-largest segment, with growth driven by rising e-commerce inventory needs and demand for temperature-controlled storage, especially for food and pharma. Courier, Express & Parcel (CEP) services are witnessing rapid expansion due to B2C e-commerce penetration, with players like NZ Post and Aramex leading last-mile innovations.
Cold Chain Logistics is emerging as a vital sub-segment, especially for dairy, seafood, and healthcare industries.
By End-User Industry:Retail and E-commerce are major contributors, driven by demand for just-in-time deliveries, returns management, and last-mile fulfillment.
FMCG and Food Processing companies rely heavily on integrated warehousing and cold chain logistics. Healthcare and Pharmaceuticals require temperature-sensitive logistics, real-time tracking, and regulatory compliance. Automotive, Construction, and Agriculture industries also form significant end-user clusters, especially in freight forwarding and parts warehousing.
Competitive Landscape in New Zealand Logistics and Warehousing Market
The New Zealand logistics and warehousing market is moderately concentrated, with a few large players leading the market across freight forwarding, warehousing, and parcel delivery. However, increasing digitization and demand for specialized services have paved the way for newer entrants and tech-driven platforms, especially in last-mile delivery and e-commerce fulfillment. Major companies include Mainfreight, Toll Group, NZ Post, Move Logistics, Fliway Transport, Aramex, DHL Express, and PBT Group.
| Company Name | Founding Year | Original Headquarters |
| Mainfreight Limited | 1978 | Auckland, New Zealand |
| TIL Logistics Group | 2018 | New Plymouth, New Zealand |
| Booth's Logistics | 1990 | Palmerston North, New Zealand |
| GVI Logistics | 1992 | Christchurch, New Zealand |
| Oceanbridge Shipping Ltd | 1981 | Auckland, New Zealand |
| Mondiale Freight Services | 1989 | Auckland, New Zealand |
| Carroll’s | 1970 | Auckland, New Zealand |
| NZ Distribution Group | 2000 | Auckland, New Zealand |
| Contract Warehousing Ltd | 1995 | Auckland, New Zealand |
| Maxwell Logistics | 2005 | Auckland, New Zealand |
Some of the recent competitor trends and key information about competitors include:
Mainfreight: New Zealand’s largest integrated logistics provider, Mainfreight recorded a revenue of over NZD 3.5 billion globally in 2023, with strong growth in domestic warehousing and trans-Tasman freight. The company expanded its Auckland and Christchurch distribution centers and invested heavily in automation and sustainability, including EV fleet rollouts.
Toll Group: A key player in both domestic and international logistics, Toll enhanced its North Island freight capabilities with new intermodal terminals. In 2023, the company prioritized pharma-grade warehousing and implemented AI-based route optimization software to improve delivery accuracy.
NZ Post: As the national postal service provider, NZ Post handled over 100 million parcels in 2023, driven by e-commerce growth. The firm announced NZD 170 million in investments over five years to upgrade its parcel sorting systems and expand regional logistics hubs.
Move Logistics: Formerly known as TIL Logistics, Move is focusing on supply chain integration and end-to-end solutions for manufacturing and construction sectors. In 2023, it opened a new logistics center in Hamilton and launched specialized warehousing for bulk goods and hazardous materials.
Fliway Transport: Fliway specializes in freight forwarding and 3PL services. The company has partnered with global firms for seamless cross-border freight management and expanded its temperature-controlled warehouse footprint in South Auckland in 2023.
Aramex NZ (formerly Fastway): Operating a franchise model, Aramex has rapidly scaled its urban delivery services, recording a 19% YoY increase in B2C parcel volumes in 2023. The company is piloting carbon-neutral delivery zones in parts of Wellington and Christchurch.
DHL Express NZ: Known for its global reach, DHL continues to lead in international courier and express logistics. In 2023, the company launched a green logistics initiative targeting full electrification of its New Zealand last-mile fleet by 2030.
PBT Group: PBT focuses on national freight and courier services. In 2023, the company invested in warehouse management system upgrades and added 10 new regional distribution points to enhance rural reach.
What Lies Ahead for New Zealand Logistics and Warehousing Market?
The New Zealand logistics and warehousing market is projected to grow steadily through 2029, supported by sustained e-commerce expansion, government infrastructure investments, and a national push toward green and digital supply chains. The industry is expected to record a CAGR of around 5.4% during the forecast period, with warehousing, last-mile delivery, and cold chain logistics being the key growth segments.
Expansion of E-commerce and Fulfillment Infrastructure: As online shopping continues to grow, logistics providers will increasingly invest in urban micro-fulfillment centers, smart warehouses, and automation technologies to meet rising delivery expectations. Retailers are also expected to partner with 3PLs to optimize inventory placement and reduce delivery times.
Acceleration of Green Logistics Initiatives: The shift toward low-emission transportation and carbon-neutral warehousing will gain momentum, in line with New Zealand’s net-zero targets. Logistics providers are anticipated to adopt EV fleets, solar-powered warehouses, and carbon tracking tools to align with regulatory and consumer sustainability demands.
Integration of Supply Chain Technology: Logistics firms will increasingly integrate IoT, AI, and blockchain into their operations to enable predictive maintenance, route optimization, and real-time visibility across the supply chain. These technologies will help reduce delivery delays, improve inventory accuracy, and enhance customer satisfaction.
Growth in Cold Chain and Healthcare Logistics: The demand for cold chain logistics is expected to rise, particularly in sectors such as pharmaceuticals, biotechnology, and premium food exports. This will drive investments in temperature-controlled warehousing and real-time monitoring solutions.
Future Outlook and Projections for New Zealand Logistics and Warehousing Market on the Basis of Revenues in USD Billion, 2024-2029

New Zealand Logistics and Warehousing Market Segmentation
By Market Structure:
Organized Sector
Unorganized Sector
Asset-Light Third-Party Logistics (3PL) Providers
In-House Logistics Operators
Freight Brokers
Regional and Local Warehousing Operators
By Type of Service:
Freight Forwarding
Warehousing and Distribution
Courier, Express & Parcel (CEP) Services
Cold Chain Logistics
Inventory Management Services
Reverse Logistics
Value-Added Logistics Services (kitting, labeling, assembly)
By End-User Industry:
E-commerce & Retail
FMCG & Food Processing
Automotive & Industrial
Pharmaceuticals & Healthcare
Agriculture & Dairy
Electronics & Consumer Durables
Construction & Mining
By Domestic vs. International Movement:
Domestic Logistics
International Freight & Transshipment
Cross-Border Supply Chain Services
By Region:
Auckland
Wellington
Canterbury (Christchurch)
Waikato (Hamilton)
Bay of Plenty (Tauranga)
Otago (Dunedin)
Other Regional Zones (Manawatu, Taranaki, Southland)
Players Mentioned in the Report:
Freight Forwarding Companies
- Rocket Freight
- Champion Freight
- Gateway Cargo
- Burnard International
- Sneddens
- Navigate Freight
- Matchbox Freight Services
- Freightstar
- Davies International
- Orbit International
Warehousing Companies
- NZ Distribution Group
- Flow Logistics
- Contract Warehousing
- Booth's Logistics
- Maxwell Logistics
- Rhenus Logistics NZ
- Challenge Logistics
- Sorted Logistics
- Mackleys
- Hobbs Global
E-Commerce Logistics Companies
- Parcelport
- StarShipIt
- Shippit
- eRetail Distribution
- New Zealand Couriers
- Rhenus Logistics NZ
- HGL
- ShipTop
- Ontempo
- GoTrack
Express Logistics Companies
- PBT Express
- Team Global Express
- Express Cargo
- Express Freight
- Crescent Express Logistics
- Shuttle Express
- Freightways Global
- New Zealand Couriers
- Aramex New Zealand
- DHL Express New Zealand
Key Target Audience:
Logistics and Freight Forwarding Companies
E-commerce and Retail Fulfillment Companies
Cold Chain Operators
Warehousing Infrastructure Developers
Government and Regulatory Authorities (e.g., NZTA, MPI)
Technology Solution Providers (WMS, TMS vendors)
Industry Associations (e.g., National Road Carriers, Logistics NZ)
Investment and Infrastructure Funds
Time Period:
Historical Period: 2018–2023
Base Year: 2024
Forecast Period: 2024–2029
Explore Flexible Purchase Options or Have Limited Budget?
Pay only for relevant chapters • Customizable report sections
Table of Contents
Choose individual sections to purchase. Mix and match as you like.
4.1 Macroeconomic Framework for New Zealand Including GDP (Historical Trend), GDP Growth (Historical Trend), GDP Contribution by Sector
4.2 Logistics Sector Contribution to GDP and How the Contribution Has Been Changing in the Historical Assessment
4.3 Ease of Doing Business in New Zealand
4.4 LPI Index of New Zealand and Improvements in the Last Decade
4.5 Customs Procedures and Border Charges in New Zealand Logistics Market
5.1 Landscape of Logistics Parks, Industrial Precincts and Free Trade / Special Economic Zones in New Zealand
5.2 Current Scenario for Logistics Infrastructure in New Zealand
5.3 Road Infrastructure in New Zealand Including Road Network, Road User Charges and Toll Network, Major Goods Traded Through Road, Major Flow Corridors for Road (Inbound and Outbound)
5.4 Air Infrastructure in New Zealand Including Total Volume Handled, Freight Tonne Kilometres for Air Freight, Major Inbound and Outbound Flow Corridors, Major Goods Traded Through Air, Number of Commercial and Freight Airports, Air Freight Volume by Airports and Other Parameters
5.5 Sea Infrastructure in New Zealand Including Total Volume Handled, Freight Tonne Kilometres for Sea Freight, Major Inbound and Outbound Flow Corridors, Major Goods Traded Through Sea, Number of Ports for Coastal and Ocean Freight, Number of Vessels, Sea Freight Volume by Ports and Other Parameters
5.6 Rail Infrastructure in New Zealand Including Total Volume Handled, Freight Tonne Kilometres for Rail Freight, Major Inbound and Outbound Flow Corridors, Major Goods Traded Through Rail and Other Parameters
6.1 Basis Revenues, Historical Period
7.1 By Segment (Freight Forwarding, Warehousing, CEP and Value-Added Services), Historical Period
7.2 By End-User Industries, Historical Period
8.1 Market Overview and Genesis
8.2 New Zealand Freight Forwarding Market Size by Revenues, Historical Period
8.3 New Zealand 3PL Freight Forwarding Market Segmentation, Historical Period
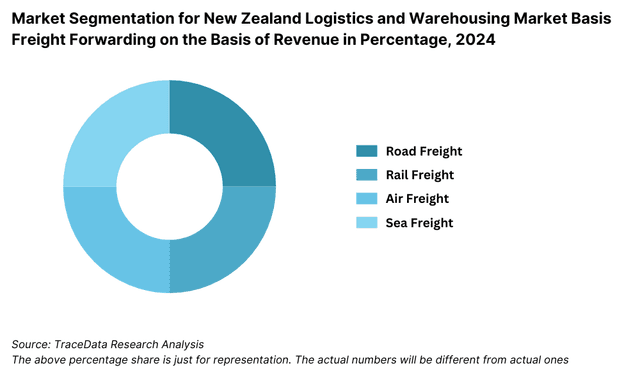
8.3.1 By Mode of Freight Transport (Road, Sea, Air and Rail), Historical Period
8.3.1.1 Price per Freight Tonne Kilometre for Road, Air, Sea and Rail in New Zealand
8.3.1.2 Road Freight (Domestic and International Volume, FTK and Revenue; Number of Registered Commercial Vehicles)
8.3.1.3 Road Freight Domestic Corridors
8.3.1.4 Sea Freight (Domestic Coastal and International Volume, FTK and Revenue; Volume by Commodity; Seaports Key Statistics)
8.3.1.5 Air Freight (Domestic and International Volume, FTK and Revenue)
8.3.1.6 Rail Freight (Domestic Volume, FTK and Revenue; Volume by Commodity and Region)
8.3.1.7 Export-Import Scenario (Value by Mode of Transport, Commodity and Partner Region; Volume by Principal Commodities)
8.3.2 By Intercity Road Freight Corridors, Historical Period
8.3.3 By International Trade Corridors (Australia, East Asia, North America, Europe and Others), Historical Period
8.3.4 By End User (Industrial, FMCG, F&B, Retail, Agrifood, Forestry and Others), Historical Period
8.4 Snapshot of Freight Truck Aggregators and Digital Freight Platforms in New Zealand
8.5 Competitive Landscape in New Zealand Freight Forwarding Market
8.5.1 Positioning Map of Major Players in New Zealand Freight Forwarding on the Basis of Service Offering and Network Coverage
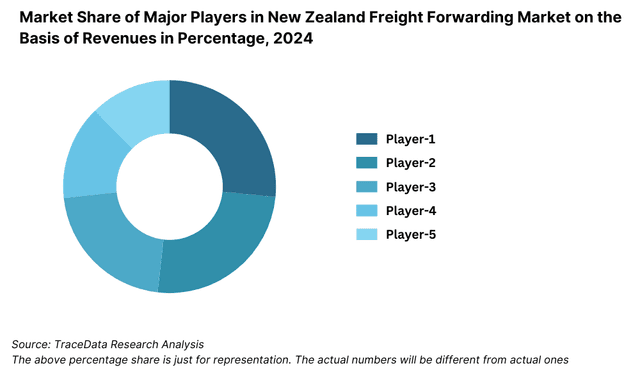
8.5.2 Market Share of Major Players in New Zealand Freight Forwarding Market, Latest Assessment Year
8.5.3 Cross Comparison of Major Players in Freight Forwarding Companies on the Basis of Parameters (Domestic road freight volume handled, international sea freight TEUs, international air freight tonnes, number of owned and subcontracted fleets, number of depots and branches, warehousing space under management, technology and visibility capabilities, sector specialisation and key accounts)
8.6 New Zealand Freight Forwarding Future Market Size by Revenues, Forecast Period
8.7 New Zealand Freight Forwarding Market Future Segmentation, Forecast Period
8.7.1 Future Market Segmentation by Mode of Freight Transport (Road, Sea, Air and Rail), Forecast Period
8.7.2 Future Market Segmentation by Trade Corridors (Australia, East Asia, North America, Europe and Others), Forecast Period
8.7.3 Future Market Segmentation by End User (Industrial, FMCG, F&B, Retail, Agrifood, Forestry and Others), Forecast Period
9.1 Market Overview and Genesis
9.2 Value Chain Analysis in New Zealand Warehousing Market Including Entities, Margins, Role of Each Entity, Process Flow, Challenges and Other Aspects
9.3 New Zealand Warehousing Market Size on the Basis of Revenues and Warehousing Space, Historical Period
9.4 New Zealand Warehousing Market Segmentation
9.4.1 New Zealand Warehousing Revenue by Business Model (Industrial/Retail Contract Logistics, ICD/CFS and Cold Storage), Historical Period
9.4.2 New Zealand Warehousing by Type of Warehouse (General, Open Yard, Freezer/Chiller, Ambient and Bonded Warehouses), Historical Period
9.4.3 New Zealand Warehousing Revenue by End User (Industrial & Construction, FMCG, Retail, Food & Beverage, Agrifood Exports and Others), Historical Period
9.5 Competitive Landscape in New Zealand Warehousing Market
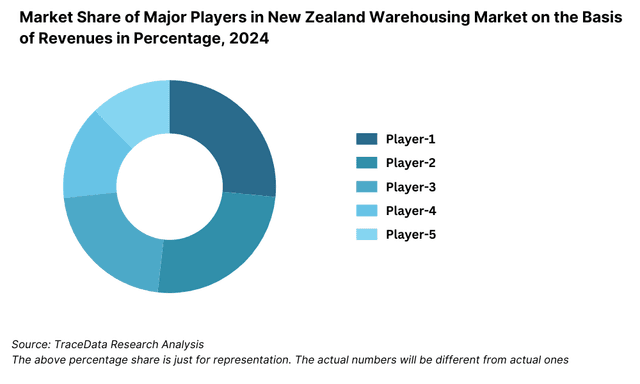
9.5.1 Market Share of Top 15 Companies in New Zealand Warehousing Market, Latest Assessment Year
9.5.2 Cross Comparison of Top 15 Warehousing and Contract Logistics Companies on the Basis of Parameters (Company overview, USP, business strategy, future plans, technology adoption, revenues from warehousing, number of warehouses, total warehousing space, location of warehouses, type of warehouses, occupancy rate, rental rates, anchor clients and sector focus)
9.6 New Zealand Warehousing Future Market Size on the Basis of Revenues, Forecast Period
9.7 New Zealand Warehousing Market Future Segmentation
9.7.1 New Zealand Warehousing Revenue by Business Model (Industrial/Retail Contract Logistics, ICD/CFS and Cold Storage), Forecast Period
9.7.2 New Zealand Warehousing Revenue by Type of Warehouse (General, Open Yard, Freezer/Chiller, Ambient and Bonded Warehouses), Forecast Period
9.7.3 New Zealand Warehousing Revenue by End User (Industrial & Construction, FMCG, Retail, Food & Beverage, Agrifood Exports and Others), Forecast Period
10.1. Market Overview and Genesis
10.2. Value Chain Analysis in New Zealand CEP Market including entities, margins, role of each entity, process flow, challenges and other aspects
10.3. Revenue Composition and Contribution Between First Mile/Mid Mile and Last Mile Delivery-Analysis for Domestic and International Shipments
10.4. New Zealand CEP Market Size on the Basis of Revenues and Shipments, 2018-2024P
10.5. New Zealand CEP Market Segmentation, 2021
10.5.1. Segmentation by Mails and Documents, E-Commerce Shipments and Express Cargo, 2023-2024P
10.5.2. Segmentation by International and Domestic Express, 2023-2024P
10.5.3. Segmentation by B2B, B2C and C2C, 2023-2024P
10.5.4. Segmentation by Period of Delivery, 2023-2024P
10.6. Competitive Landscape in 3PL Market, 2021
10.6.1. Overview and Genesis, Market Nature, Market Stage and Major Competing Parameters
10.6.2. Market Share of Companies in New Zealand CEP Market on the Basis of Revenues/Number of Shipments, 2023
10.6.3. Market Share of Top 5 Companies in New Zealand E-Commerce Shipment Market on the Basis of Revenues/Number of Shipments, 2023
10.6.4. Cross Comparison of Top 10 New Zealand CEP Companies on the Basis of Parameters including Company Overview, USP, Business Strategy, Future Plans, Technology, Number of last Mile Delivery Shipments, Revenues, Major Clients, Number of Fleets, Number of Employees, Number of Riders, Number of Pin Code Served, Major Service Offering and others
10.7. New Zealand CEP Market Size on the Basis of Revenues and Shipments, 2025-2029
10.8. New Zealand CEP Market Segmentation
10.8.1. Segmentation by Mails and Documents, E-Commerce Shipments and Express Cargo, 2025-2029
10.8.2. Segmentation by International and Domestic Express, 2025-2029
10.8.3. Segmentation by B2B, B2C and C2C, 2025-2029
10.8.4. Segmentation by Period of Delivery, 2025-2029
11.1 Customer Cohort Analysis and End User Paradigm for Different Industry Verticals Under Logistics Sector
11.2 Understanding Logistics Spend by End User, Latest Assessment Years
11.3 End User Preferences in Terms of In-House or Outsourcing Logistics Services and Reason for Selection; Segregated by Size of Company on the Basis of Revenues
11.4 Major Logistics Companies Specialised in Serving Each Type of End User
11.5 Detailed Landscape of Each End User Across Parameters Including Major Products Manufactured and Traded, Emerging Products, Type of Services Required, Type of Services Outsourced, Major Companies, Contract Duration, Likelihood to Recommend, Market Orientation, Major Clusters, Type of Sourcing Preference, Pain Points, Facilities/Services Required, Future Outlook; Market Size for Each End User Industry Vertical with Growth Rate, Historical Period
12.1 Basis Revenues, Forecast Period
13.1 By Segment (Freight Forwarding, Warehousing, CEP and Value-Added Services), Forecast Period
13.2 By End User Industries, Forecast Period
13.3 Recommendation
13.4 Opportunity Analysis
10.1 Market Overview and Genesis
10.2 Value Chain Analysis in New Zealand CEP Market Including Entities, Margins, Role of Each Entity, Process Flow, Challenges and Other Aspects
10.3 Revenue Composition and Contribution Between First Mile/Mid Mile and Last Mile Delivery-Analysis for Domestic and International Shipments
10.4 New Zealand CEP Market Size on the Basis of Revenues and Shipments, Historical Period
10.5 New Zealand CEP Market Segmentation, Latest Assessment Year
10.5.1 Segmentation by Mails and Documents, E-Commerce Shipments and Express Cargo, Latest Assessment Year
10.5.2 Segmentation by International and Domestic Express, Latest Assessment Year
10.5.3 Segmentation by B2B, B2C and C2C, Latest Assessment Year
10.5.4 Segmentation by Period of Delivery
10.6 Competitive Landscape in New Zealand CEP Market
10.6.1 Overview and Genesis, Market Nature, Market Stage and Major Competing Parameters
10.6.2 Market Share of Companies in New Zealand CEP Market on the Basis of Revenues/Number of Shipments, Latest Assessment Year
10.6.3 Market Share of Top E-Commerce Shipment Players on the Basis of Revenues/Number of Shipments, Latest Assessment Year
10.6.4 Cross Comparison of Leading CEP Companies on the Basis of Parameters (Company overview, USP, business strategy, future plans, technology, number of last-mile delivery shipments, revenues, major clients, number of fleets and riders, number of depots, number of delivery zones/postcodes served, major service offerings and value-added solutions), Latest Assessment Year
10.7 New Zealand CEP Market Size on the Basis of Revenues and Shipments, Forecast Period
10.8 New Zealand CEP Market Future Segmentation
10.8.1 Segmentation by Mails and Documents, E-Commerce Shipments and Express Cargo, Forecast Period
10.8.2 Segmentation by International and Domestic Express, Forecast Period
10.8.3 Segmentation by B2B, B2C and C2C, Forecast Period
10.8.4 Segmentation by Period of Delivery, Forecast Period
Discuss a Customized Research Scope
Custom research scope • Tailored insights • Industry expertise
Research Methodology
Step 1: Ecosystem Creation
Map the ecosystem and identify all the demand side and supply side entities for the New Zealand Logistics and Warehousing Market. This includes freight forwarding companies, warehouse operators, CEP players, cold chain specialists, e-commerce platforms, industrial clients, and regulatory stakeholders.
Basis this ecosystem, we shortlist leading 5–6 logistics and warehousing companies in the country based on their revenue contribution, fleet size, warehouse capacity, and geographic reach.
Sourcing is made through industry articles, logistics trade journals, proprietary market databases, and official websites to initiate desk research and gather baseline data on the sector.
Step 2: Desk Research
Engage in a thorough desk research process referencing multiple secondary and proprietary databases, including company filings, press releases, transport sector outlooks, infrastructure investment reports, and association papers.
Analyze key variables such as market size (by revenue), number of active logistics players, service line contribution, utilization rates, pricing trends, and regional distribution dynamics.
Supplement this with a detailed company-level review, assessing organizational structures, financials, strategic partnerships, expansion history, and technology adoption to form an initial hypothesis of market direction.
Step 3: Primary Research
Conduct in-depth interviews with C-level executives, operations heads, and procurement managers across logistics companies, warehouse operators, major e-commerce platforms, and industry associations in New Zealand.
The interviews aim to validate market hypotheses, assess industry challenges, and extract strategic insights such as service pricing, operating models, client acquisition strategies, technology usage, and regulatory compliance costs.
Adopt a bottom-to-top approach to estimate service-specific revenue contributions by aggregating data from individual players to compute the overall market size.
Execute disguised interviews where team members engage companies under the identity of potential clients or logistics users. This helps validate service pricing, delivery SLAs, storage costs, operational timelines, and compare with reported data from secondary sources.
Step 4: Sanity Check
Undertake a top-down and bottom-up triangulation of market size estimates and growth rates using financial modeling tools.
Conduct sanity checks on data from primary and secondary sources to validate overall revenue forecasts, service line contributions, and regional segmentation.
- Ensure consistency and logical alignment between macro-level market indicators (e.g., freight volume, e-commerce parcel volumes, warehouse space) and micro-level company performance metrics.
See What's Inside the Report
Get a preview of key findings, methodology and report coverage
Frequently Asked Questions
The New Zealand logistics and warehousing market is set for steady growth, reaching a projected valuation of over NZD 14.8 Billion by 2029. This expansion is driven by increased demand from the e-commerce, FMCG, and healthcare sectors, as well as major infrastructure investments and the push towards digital and green logistics. The country’s strategic geographic positioning and robust trade partnerships further enhance the market’s long-term growth potential.
Major players include Mainfreight, Toll Group, NZ Post, Move Logistics, Fliway Transport, Aramex NZ, DHL Express NZ, and PBT Group. These companies are recognized for their national reach, technology adoption, warehousing capabilities, and diverse service offerings across freight, parcel, and supply chain solutions.
Key growth drivers include the rise of e-commerce and omnichannel retail, investments in transport infrastructure, growing demand for cold chain and temperature-controlled logistics, and the increasing use of automation and digital tools. Government sustainability mandates and carbon-neutral transport goals are also encouraging fleet electrification and green warehousing practices.
The sector faces multiple challenges, including labor shortages, rising fuel and operational costs, supply chain disruptions at ports, and infrastructure bottlenecks in regional areas. Additionally, maintaining compliance with increasingly stringent biosecurity, emissions, and hazardous goods regulations adds operational complexity and cost for logistics providers.
License Options
PDF + Excel
Complete report package
$4,000
Excel Only
Data and analytics
$2,500
Custom Sections
Starts from $100
$0