Nigeria Autonomous Vehicles (AV) Market Outlook to 2030
By Market Structure, By Operational Design Domain (ODD), By Autonomy/Operations Mode, By Vehicle Platform, By End-User Verticals, and By Region
Report Overview
Report Code
TDR0351
Coverage
Africa
Published
October 2025
Pages
80
On This Page
Report Overview
The report titled “Nigeria Autonomous Vehicles (AV) Market Outlook to 2030 - By Market Structure, By Operational Design Domain (ODD), By Autonomy/Operations Mode, By Vehicle Platform, By End-User Verticals, and By Region” provides a comprehensive analysis of the autonomous vehicles market in Nigeria. The report covers an overview and genesis of the industry, overall market size in terms of revenue, market segmentation; trends and developments, regulatory landscape, customer level profiling, issues and challenges, and competitive landscape including competition scenario, cross-comparison, opportunities and bottlenecks, and company profiling of major players in the autonomous vehicles market.
Report Coverage
Verified Market Sizing
Multi-layer forecasting with historical data and 5–10 year outlook
Deep-Dive Segmentation
Cross-sectional analysis by product type, end user, application and region
Competitive Benchmarking & Positioning
Market share, operating model, pricing and competition matrices
Actionable Insights & Risk Assessment
High-growth white spaces, underserved segments, technology disruptions and demand inflection points
Review Methodology & Data Structure
Preview report structure, data sources and research framework
Executive Summary
The report titled “Nigeria Autonomous Vehicles (AV) Market Outlook to 2030 - By Market Structure, By Operational Design Domain (ODD), By Autonomy/Operations Mode, By Vehicle Platform, By End-User Verticals, and By Region” provides a comprehensive analysis of the autonomous vehicles market in Nigeria. The report covers an overview and genesis of the industry, overall market size in terms of revenue, market segmentation; trends and developments, regulatory landscape, customer level profiling, issues and challenges, and competitive landscape including competition scenario, cross-comparison, opportunities and bottlenecks, and company profiling of major players in the autonomous vehicles market. The report concludes with future market projections based on vehicle deployments, commercial contracts, regions, cause-and-effect relationships, and success case studies highlighting the major opportunities and cautions.
Nigeria Autonomous Vehicles Market Overview and Size
The Nigeria autonomous vehicles market is transitioning from pilot readiness to early commercialization, led by geofenced use-cases in ports, depots, campuses, estates, and industrial parks. Nigeria’s addressable base—232,679,478 people—pairs with strong digital rails of 219,304,281 active mobile voice users and 164,368,292 internet subscriptions. Lagos alone hosts 18,841,943 internet lines and the country handled 1,566,109 TEUs of containers, concentrating yard-automation opportunities around Apapa/Tin-Can and allied logistics hubs. Ecosystem anchors include Innoson Vehicle Manufacturing, Nord Automobiles, JET Motor Company, Stallion Group, MAX, Moove, Kobo360, GIG Logistics, MTN Nigeria, Airtel Nigeria, HERE, TomTom, NVIDIA, Mobileye, and Tier-1s such as Bosch/Valeo.
In 2024, network readiness accelerated as MTN Nigeria surpassed 2,100 5G sites with roughly 4,000,000 5G connections, while Airtel advanced 5G across major cities—foundational for tele-operation and V2X. Safety imperatives stayed acute, with 2,662 reported crashes in Q1 (involving 3,952 vehicles and 1,471 deaths) and 2,404 crashes in Q2 (involving 3,612 vehicles), reinforcing the case for AVs in controlled domains. Key hubs—Lagos (ports, BRT depots, estates) and Port Harcourt (oil-and-gas terminals)—are expected to lead early deployments, with Abuja supporting campus and federal-estate pilots that favor supervised autonomy and tele-ops.
What Factors are Leading to the Growth of the Nigeria Autonomous Vehicles Market:
Dense urban demand + digital readiness enable early AV use-cases: Nigeria’s population stands at 232,679,478, giving AV operators one of Africa’s largest addressable rider and freight pools. Urban internet access is the backbone for tele-operations, high-definition map refresh and over-the-air updates: the latest official release counted 219,304,281 active mobile voice users and 164,368,292 active internet subscriptions. Lagos alone accounted for 18,841,943 active internet lines, concentrating corporate buyers and riders on a single coastal megacity corridor ideal for geofenced robotaxi pilots, autonomous shuttles on campus/estate roads, and yard-automation at ports and logistics parks. Port-proximate districts also intersect with industrial estates and free zones—prime anchors for AV-enabled first/last-mile freight orchestration.
Trade through coastal gateways drives yard automation and autonomous logistics: Container movements quantify the automation opportunity in terminals, ICDs and port-adjacent yards where low-speed AVs thrive. The latest figure shows Nigeria handled 1,566,109 TEUs of container traffic, with flows concentrated around Lagos harbours that funnel import cargo to inland logistics hubs. Autonomous yard tractors, robo-stackers and tele-operated reach-stackers can compress cycle times where congestion is chronic and labour availability varies across shifts. With a national population base of 232,679,478 and a heavy coastal import reliance, terminal operators, freight forwarders and 3PLs have a clear case for pilot deployments on private land, where safety-case development and phased scaling are operationally manageable.
Safety imperative: high crash volumes justify AV pilots in controlled domains: Road-traffic injuries remain a major operational risk for fleets and employers. Official statistics recorded 2,662 reported crashes in Q1 involving 3,952 vehicles and 1,471 deaths. In the following quarter, counts showed 2,404 crashes and 3,612 vehicles involved. For enterprise buyers, AVs in structured settings—industrial parks, mines, campuses, ports and BRT depots—directly target high-frequency collision scenarios (lane-keeping, following distance, stop-and-go) with perception stacks and V2X decision support. These volumes give corporate HSE teams and insurers hard baselines to evaluate AV safety cases and to prioritize routes and yards where automation can remove human exposure at the most hazardous nodes.
Which Industry Challenges Have Impacted the Growth of the Nigeria Autonomous Vehicles Market:
Power-system constraints complicate depot charging and AV infrastructure uptime: Grid reliability and metering coverage shape any plan for AV depots, edge data-centres and smart intersections. Total registered customers reached 12,333,999, yet fully metered customers were 5,907,644, indicating widespread estimated billing and planning uncertainty at sites. System energy supplied in the period measured 5,769.52 GWh, against rising urban demand, forcing private chargers and on-site generation for mission-critical AV fleets. Operators must dimension battery buffers, hybrid gensets and solar-plus-storage to maintain SLAs for autonomous yard tractors, shuttles and street-sweeping bots during feeder outages and low-voltage events.
Connectivity concentration produces operational “cold spots” for AV tele-ops: Low-latency links are essential for remote assistance, map uploads and fleet monitoring. Nationally there are 219,304,281 active voice users and 164,368,292 active internet subscriptions, but coverage and load are uneven. Lagos alone holds 18,841,943 internet lines, while several northern and riverine states host far smaller bases, creating sparse corridors with bandwidth contention for tele-ops and V2X. Route planning for long-haul autonomous platooning and intercity shuttle pilots must therefore stage connectivity audits, SIM diversity and roadside Wi-Fi offload at depots to avoid telemetry gaps that can trigger conservative fallback behaviours and productivity losses.
High crash exposure and complex traffic mix raise validation burdens: Validation miles must reflect real-world hazard density. Q1 counts show 2,662 crashes and 8,659 injuries, followed by 2,404 crashes in Q2 with 3,612 vehicles involved. These volumes include buses, minibuses and heavy trucks, plus informal modes that complicate scene prediction (okadas, keke). AV developers face longer test cycles to achieve statistical confidence for behaviours like merging into ad-hoc queues near ports and navigating unmarked or partially marked lanes. Enterprise pilots must therefore start in controlled estates and terminals, then progressively expand to ring roads and logistics corridors as datasets accumulate and safety cases meet regulator and insurer thresholds.
What are the Regulations and Initiatives which have Governed the Market:
5G spectrum framework underpins V2X and tele-operations: The communications regulator has formalized 3.5 GHz licensing for IMT/5G, publishing an information memorandum that offers two lots of 100 MHz TDD spectrum in the 3.5–3.6 GHz and 3.7–3.8 GHz ranges. For AV operators, this clarifies the technical baseline for network slicing, MEC siting and SLAs on latency for remote assist. Clear lot sizes and band plans let MNOs publish deterministic QoS targets along port corridors and estates—core sites for AV pilots—while also guiding private-LTE/5G plans for large campuses that prefer local core and on-prem URLLC edges.
Automotive industrial policy anchors homologation and testing assets: Implementation materials for the national automotive plan describe three government-backed Automotive Industrial Parks and three Automotive Testing Centres spread across Lagos, Enugu and Zaria. For AV players, proximity to test tracks and labs is critical for conformity of production, EMC testing, braking/steering validation and sensor-rig calibration. As OEMs and Tier-1s localize assembly for fleet clients—buses, vans and industrial machines—these sites reduce lead-time for component certification and provide curated industrial zones where geofenced AV pilots can be permitted under estate rules while federal standards evolve.
Data-protection regime sets operational obligations for AV data flows: Nigeria’s Data Protection Act created the national data authority to regulate processing of personal data captured by perception stacks, in-cabin systems and fleet telematics. Guidance maintains mandatory Compliance Audit Returns and tightens licensing for Data Protection Compliance Organisations, with the licence fee publicly stated at ₦2,000,000. For AV operators, this translates to defined audit cycles, DPO appointment and controller/processor registrations when ingesting street-level imagery and biometrics (e.g., driver monitoring) during trials and commercial ops. Fleet buyers must embed these controls to avoid enforcement risks during scale-up.
Nigeria Autonomous Vehicles Market Segmentation
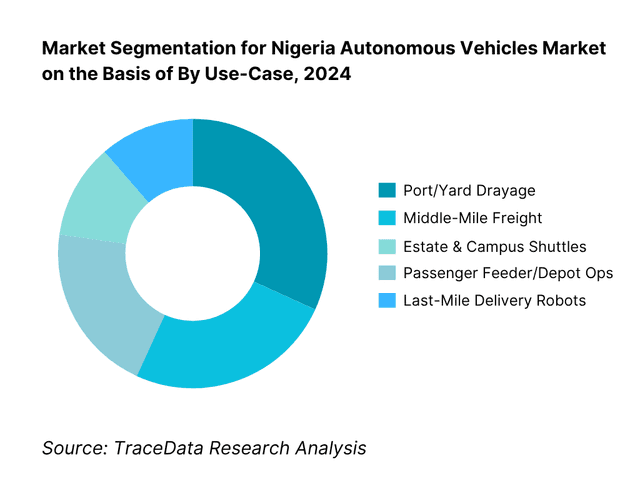
By Use-Case: Nigeria Autonomous Vehicles market is segmented by use-case into port/yard drayage, middle-mile freight, estate & campus shuttles, passenger feeder/depot operations and last-mile delivery robots. Recently, port/yard drayage would be the natural early front-runner in Nigeria under the use-case segmentation, owing to fenced operational domains, repetitive routes, and acute productivity headroom at Lagos ports. Official reports record significant vessel turnaround and cargo dwell-time challenges, while state ITS upgrades are underway—factors that align with autonomous yard tractors and terminal movers as a first beachhead once permits exist.
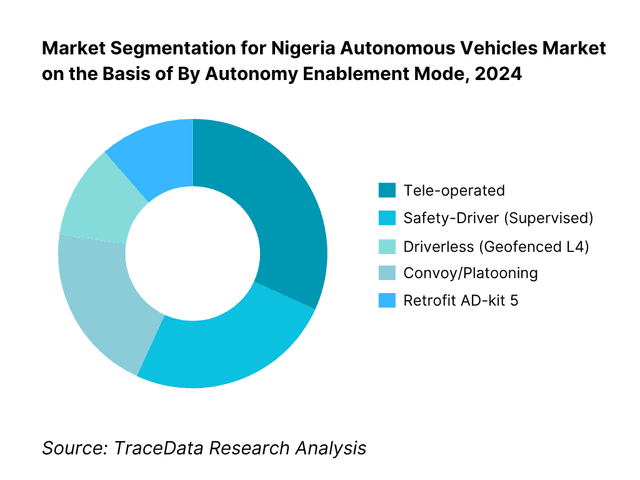
By Autonomy Enablement Mode: Nigeria Autonomous Vehicles market is segmented by autonomy mode into tele-operated, safety-driver (supervised), driverless (geofenced L4), convoy/platooning and retrofit AD-kit on existing fleets. Recently, tele-operation is the most realistic initial pathway in Nigeria under this segmentation since it leverages growing 5G footprints and control-room staffing to handle edge cases in complex traffic. Academic and industry work underscores 5G’s role in AV tele-op and Nigeria’s networks are expanding across major cities, positioning tele-op as the lowest-risk step toward scaled autonomy once licensing exists.
Competitive Landscape in Nigeria Autonomous Vehicles Market
The Nigeria Autonomous Vehicles market is not yet commercialized, but an ecosystem of adjacent players is forming: local assemblers (Innoson, Nord, Stallion/Nissan) that could host sensor/compute integration; e-mobility startups (JET, MAX) relevant for electrified platforms; and telcos (MTN, Airtel) expanding 5G coverage critical for V2X/tele-operation. As regulation solidifies, global autonomy stack providers and mapping companies are positioned to partner with these local anchors.
Name | Founding Year | Original Headquarters |
Innoson Vehicle Manufacturing (IVM) | 2007 | Nnewi, Nigeria |
Nord Automobiles | 2016 | Lagos, Nigeria |
JET Motor Company | 2018 | Lagos, Nigeria |
Stallion Group | 1969 | Dubai, United Arab Emirates |
MAX (Metro Africa Xpress) | 2015 | Lagos, Nigeria |
Moove Africa | 2020 | Lagos, Nigeria |
Kobo360 | 2018 | Lagos, Nigeria |
GIG Logistics (GIGL) | 2012 | Lagos, Nigeria |
MTN Nigeria | 2001 | Lagos, Nigeria |
Airtel Nigeria | 2001 | Lagos, Nigeria |
Some of the Recent Competitor Trends and Key Information About Competitors Include:
Innoson Vehicle Manufacturing (IVM): As the leading local automotive OEM, Innoson has expanded its assembly and upfit programs, focusing on AV-ready buses and utility vehicles for estates, campuses, and depot operations, enabling faster integration of perception sensors and compute for fenced-ODD pilots.
Nord Automobiles: Known for its strong presence in corporate and government fleets, Nord has broadened fleet-upfit services to include sensor mounting, telematics, and safety systems, addressing the growing demand for standardized vehicle platforms for geofenced autonomous shuttle deployments.
JET Motor Company: Specializing in electric buses and vans, JET Motor has launched EV platforms and diagnostics packages suited to depot charging and high-uptime duty cycles, catering to operators seeking electrified, autonomy-ready vehicles for hub-to-hub and last-mile operations.
MTN Nigeria: A major connectivity provider, MTN has advanced 5G and edge-compute offerings for enterprise transport, reflecting rising demand for low-latency links that support tele-operation, remote assistance, and V2X services across controlled AV corridors in major cities.
Kobo360: Focused on logistics and middle-mile orchestration, Kobo360 has expanded shipper integrations and real-time visibility tools, enabling data-backed lane selection for convoy/platooning trials and laying groundwork for autonomous hub-to-hub services within managed freight networks.
What Lies Ahead for Nigeria Autonomous Vehicles Market?
The Nigeria autonomous vehicles market is poised to shift from pre-revenue pilots to early commercialization, anchored by geofenced use-cases in ports, depots, industrial parks, estates, and campuses. Momentum will come from intelligent transport upgrades, growing 5G and edge-compute footprints, local assembly/integration capacity, and clearer permitting and safety-case pathways. Early contracts will emphasize operational SLAs—uptime, incident reduction, and cost per kilometer within fenced ODDs—before selective expansion to public corridors. Partnerships among local OEMs, global autonomy stacks, telcos, and terminal operators will define the first scalable playbooks.
Rise of Hybrid Operations Models: The near term favors supervised autonomy combining on-board automation with tele-operation. Control rooms will provide remote assistance for edge cases, while safety drivers taper to remote supervisors as datasets grow. This approach accelerates deployment in predictable environments—yard drayage, depot shuttles, campus circulators—where low speeds, repetitive routes, and private right-of-way reduce risk. Hybrid operations also simplify insurance binding and regulatory comfort, creating a pragmatic on-ramp to higher autonomy without waiting for full public-road readiness.
Focus on Outcome-Based SLAs and Safety Cases: Buyers will demand outcome-linked contracts—incidents per million kilometers, turnaround-time reduction in yards, schedule adherence for depot feeders, and verified latency thresholds for remote assistance. Operators will institutionalize formal safety cases aligned to international functional safety and cybersecurity norms, with black-box telemetry, audit trails, and incident reconstruction tooling. This data-first posture will ease approvals, unlock insurer participation, and create reference corridors where performance is continuously proven and priced into multi-year agreements.
Expansion of Sector-Specific Programs: Early scaling will be use-case led. Ports and terminals will pilot autonomous yard tractors and gate flows; oil-and-gas hubs will trial industrial haulage within secured facilities; estates, universities, and industrial parks will adopt circulator shuttles; middle-mile networks will test hub-to-hub convoys on selected freight corridors. Each domain offers contained complexity, clear KPIs, and motivated sponsors—from terminal operators mitigating congestion to landlords boosting mobility services—forming a mosaic of dependable ODDs that cumulatively build national AV capability.
Leveraging AI, Edge, and V2X: Perception stacks tuned for tropical glare and heavy rain, multi-sensor fusion, and predictive maintenance will be paired with edge compute at depots and terminals for low-latency inference and tele-op failovers. Continuous HD-map refresh pipelines and lightweight roadside units will support lane-level localization and prioritized signaling. Over-the-air compliance logging, security-hardened update workflows, and data-governed analytics will translate operational telemetry into measurable reliability gains, shortening validation cycles and enabling progressive route and feature unlocks.
Nigeria Autonomous Vehicles Market Segmentation
By Use-Case
Port & Terminal Yard Drayage
Middle-Mile Freight (hub-to-hub, cross-dock)
Estate & Campus Circulators (residential, university, business park)
Public Transport Feeders (BRT depot shuttles)
Last-Mile Logistics (service robots/droids)
Industrial/Mining Intra-site Haulage
Airside & Airport Operations
By Vehicle Platform
Passenger Shuttles/Minibuses (10–25 seats)
Light Commercial Vans & Pickups
Heavy & Medium Trucks
Yard/Terminal Tractors
Specialty Equipment (reach stackers, tow tugs, sweepers, patrol bots)
By Autonomy / Operations Mode
Tele-Operated
Safety-Driver Supervised
Driverless Geofenced (L4, fenced ODDs)
Convoy/Platooning
ADAS-Enhanced Fleets (L2+/L3)
By Ownership & Commercial Model
AV-as-a-Service (per-km/per-hour SLAs)
OEM-Embedded Autonomy
Retrofit Integrators (aftermarket kits)
Enterprise Self-Owned Fleets
Joint Ventures/Concessions (ports, BRT depots)
By Region / Corridor Readiness
South West (Lagos & Lekki–Epe corridor)
South South (Port Harcourt/Onne)
South East (Anambra/Enugu clusters)
North Central (Abuja FCT)
North West (Kano–Kaduna spine)
North East (selected industrial/campus pilots)
Players Mentioned in the Report:
Innoson Vehicle Manufacturing (IVM)
JET Motor Company
Stallion Group (Nissan Assemblies)
Nord Automobiles
MAX (Metro Africa Xpress)
Moove Africa
Kobo360
GIG Logistics
MTN Nigeria
Airtel Nigeria
HERE Technologies
TomTom
NVIDIA
Mobileye
Bosch/Valeo.
Key Target Audience
Ports & Terminal Operators (e.g., [Nigerian Ports Authority])
State Transport Agencies ([LAMATA] for Lagos, relevant state BRT/Mass Transit authorities)
Large 3PLs and E-commerce Platforms
Industrial Parks/Estate Operators & Campuses
Oil & Gas Midstream/Downstream Logistics
Investments and Venture Capitalist Firms
Government and Regulatory Bodies
Telecommunications & Edge-Cloud Providers
Time Period:
Historical Period: 2019-2024
Base Year: 2025
Forecast Period: 2025-2030
See What's Inside the Report
Get a preview of key findings, methodology and report coverage
Table of Contents
1. Executive Summary [addressable AV segments (port drayage, middle-mile, estate/campus shuttles, last-mile droids, BRT depot ops), ODD corridors (Lagos-Lekki/Epe, Apapa/Tin-Can, Abuja CBD/Airport, Port Harcourt Oil & Gas), 5G/edge latency benchmarks (ms), installed base & pilot pipeline (units), capex/opex unit economics (USD/km; USD/vehicle), regulatory readiness index (FRSC/NADDC/NCC), HD-map lane-km availability, investor sentiment & funding funnel]
2. Research Methodology [top-down/bottom-up triangulation, fleet operator interviews (logistics, estates, ports), regulator consultations (FRSC, NADDC, LASG), telco/edge assessments (MTN, Airtel), secondary sources (ITS standards, UNECE R155/R156), data imputation for informal sector, sensitivity tests (diesel vs BEV prices), scenario design (driverless vs tele-op mix)]
3. Ecosystem of Key Stakeholders in Nigeria AV Market [policy bodies (NADDC, FRSC, NCC, FMPWH, Lagos ITS), state/municipal agencies (LASTMA, LaMA), ports (NPA, terminal operators), OEMs/assemblers (IVM, Stallion, Nord, JET), Tier-1s/sensor vendors, mapping providers, telcos/edge DCs, universities/R&D, fleet operators (3PLs, e-commerce, estates/campuses), insurers & reinsurers, financiers/PE/DFIs]
4. Value Chain Analysis [silicon & sensors → autonomy stack & simulation → HD mapping & data ops → vehicle assembly & retrofit → connectivity/V2X/edge → depot & charging/power → operations center (tele-op, safety) → maintenance & OTA → insurer/claims → customer contracting]
4.1. Deployment/Delivery Model Analysis-Driverless, Safety-Driver, Tele-Operated, Retrofit vs OEM-Embedded [margin profiles by model, buyer preference by corridor, strength/weakness in tropical rain/glare, staffing intensity (remote supervisor ratio), compliance burden, scalability in fenced ODDs, capex per vehicle, uptime & SLA risks]
4.2. Revenue Streams for Nigeria AV Market [per-km fee, per-hour yard service, SaaS/stack licensing, data services (HD-map refresh), maintenance contracts, availability guarantees/SLAs, hardware mark-up, energy pass-through & carbon credits]
4.3. Business Model Canvas for Nigeria AV Market [customer segments (ports, 3PL, estates, public transport), value propositions (safety, cost/stop-km, predictability), channels (direct/JV/telco), customer relationships (SLA, control room integration), key resources (maps, permits, depots, edge sites), key activities (ops, OTA, compliance), key partners (OEM/T1/telco), cost structure (sensors, staff, power), revenue streams]
5. Market Structure [OEM-embedded autonomy vs retrofit integrators, in-house AV ops vs outsourced AV-as-a-Service, passenger vs freight, fenced ODD vs public road pilots, BEV vs ICE retrofit mix]
5.1. Independent Integrators vs In-House AV Operators [build-buy-partner logic, control of safety case, speed to pilot, lifecycle cost]
5.2. Investment Models in Nigeria AV Market [JV/consortium at ports, concession/PPP for BRT depots, fleet lease with per-km minimums, vendor-financed kits, tele-op control center capex]
5.3. Comparative Analysis of Pilot/Procurement Funnel-Private Estates vs Government Agencies [lead gen → site survey → ODD definition → PoC → safety case → scaling; approval layers, cycle times, KPIs, procurement rigidity, data residency rules]
5.4. Autonomy Budget Allocation by Fleet Size (Current Period) [large fleet, mid-size, SMEs; capex vs opex split, training/compliance share, mapping refresh budget, connectivity costs]
6. Market Attractiveness for Nigeria AV Market [sectoral TAM/SAM/SOM by use-case, policy support score, infrastructure readiness (lane markings/RSU density/depot power), competitive intensity, profitability curves, ease-of-doing-business by state]
7. Supply-Demand Gap Analysis [kit availability vs demand, safety drivers vs remote supervisors, HD-map coverage vs required lane-km, depot power vs charging needs, insurer capacity for AV risk, local maintenance skills]
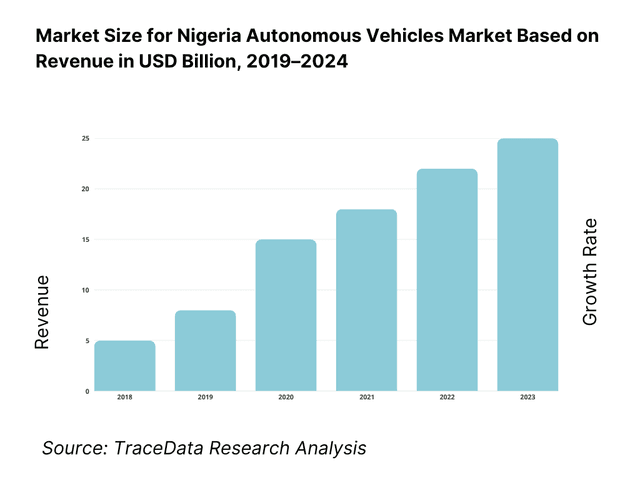
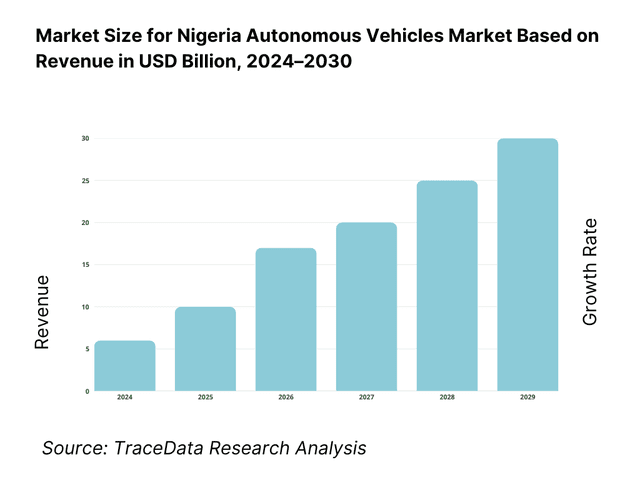
8. Market Size for Nigeria AV Market Basis
8.1. Revenues, 2019-2024
9. Market Breakdown for Nigeria AV Market Basis
9.1. By Market Structure (In-House Operations and Outsourced AV-as-a-Service), 2023-2024P [contract tenor, SLA types, pricing basis]
9.2. By Use-Case Type (Port/Yard Drayage, Middle-Mile Freight, Estate/Campus Shuttles, Passenger Robo-Transit Feeder, Last-Mile Delivery Droids), 2023-2024P [ODD complexity, speed bands, payload]
9.3. By End-User Verticals (Ports & Terminals, E-commerce/3PL, Oil & Gas, Real Estate/Industrial Parks, Public Transport Agencies), 2023-2024P [decision makers, safety KPIs, uptime needs]
9.3.1. By Type of Port/Terminal Operations, 2023-2024P [yard tractors, container movers, apron/tow tugs, gate automation]
9.4. By Fleet Size (Large, Medium, Small Fleets), 2023-2024P [vehicles/ODD, control room size]
9.5. By Operational Role Mix, 2023-2024P [safety drivers, remote supervisors, field techs, operations engineers]
9.6. By Autonomy Enablement Mode, 2023-2024P [driverless, safety-driver, tele-operation, convoy/platooning]
9.7. By Integration Type (Standardized AV Package vs Customized Integration), 2023-2024P [time-to-deploy, interoperability]
9.8. By Region (South West, South South, South East, North Central, North West, North East), 2023-2024P [corridor readiness, telco coverage, depot power]
10. Demand-Side Analysis for Nigeria AV Market
10.1. Corporate Client Landscape & Cohort Analysis [ports, estates, 3PL tiers, O&G majors, PTAs; procurement maturity]
10.2. AV Needs & Decision-Making Process [safety case, TCO, site trials, stakeholder approvals, insurance binders]
10.3. Program Effectiveness & ROI Analysis [cost/stop-km, incidents/MM km, uptime %, labor reallocation, energy cost delta]
10.4. Gap Analysis Framework [people, process, technology, policy gaps by segment]
11. Industry Analysis
11.1. Trends & Developments for Nigeria AV Market [tele-op rise, sensor fusion for tropical rain/glare, depot-centric charging, RSU-lite V2X]
11.2. Growth Drivers for Nigeria AV Market [logistics formalization, port congestion relief, safety targets, telco 5G]
11.3. SWOT Analysis for Nigeria AV Market [local assembly leverage, policy volatility, talent pipeline, insurer appetite]
11.4. Issues & Challenges for Nigeria AV Market [road markings, power reliability, capex, cyber compliance]
11.5. Government Regulations for Nigeria AV Market [NAIDDC/FRSC/NCC guidance, homologation, data residency, UNECE cyber/OTA alignment]
12. Snapshot on AV Tele-Operation & Digital Operations in Nigeria
12.1. Market Size & Future Potential for Tele-Op/Remote Driving, 2018-2029 [corridor latency/success rate, supervisor:vehicle ratio]
12.2. Business Model & Revenue Streams [per-hour supervision, SLA-based pricing, integration fees]
12.3. Delivery Models & Service Types [centralized vs distributed control rooms, hybrid on-prem/edge, managed services]
12.4. Cross-Comparison of Leading Tele-Op/AV Software Firms [company overview, funding, revenues, supervised vehicles, SLA latency (ms), disconnection handling, corridor coverage, security/compliance posture]
13. Opportunity Matrix for Nigeria AV Market-Radar Chart [relative attractiveness by use-case: yard, middle-mile, estate shuttle, last-mile, BRT depot]
14. PEAK Matrix Analysis for Nigeria AV Market [leaders, major contenders, aspirants-based on capability & market impact scores]
15. Competitor Analysis for Nigeria AV Market
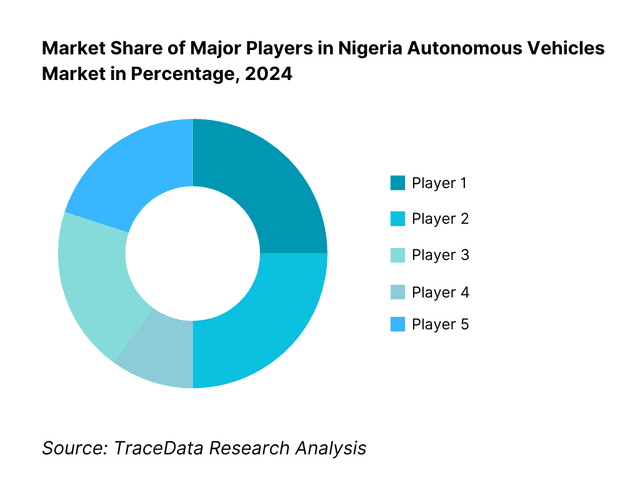
15.1. Market Share of Key Players by Revenues/Installed Base (Current Period) [ports vs freight vs passenger split]
15.2. Benchmark of Key Competitors [company overview, USP, go-to-market, model (OEM-embedded/retrofit/AVaaS), #AVs/pilots, pricing (per-km/per-hour), tech stack (sensors/compute), best-selling solutions, anchor clients, strategic tie-ups, marketing motion, recent developments]
15.3. Operating Model Analysis Framework [control room architecture, ops staffing, maintenance cadence, safety case governance]
15.4. Gartner-Style Quadrant (Indicative) [ability to execute vs completeness of vision for Nigeria]
15.5. Bowman’s Strategic Clock for Competitive Advantage [price/value positioning across segments]
16. Future Market Size for Nigeria AV Market Basis
16.1. Revenues, 2025-2030
17. Market Breakdown for Nigeria AV Market Basis
17.1. By Market Structure (In-House and Outsourced AV-as-a-Service), 2025-2030 [scaling constraints, pricing evolution]
17.2. By Use-Case Type (Port/Yard, Middle-Mile, Estate/Campus, Passenger Feeder, Last-Mile Droids), 2025-2030 [penetration curves, unit additions]
17.3. By End-User Verticals (Ports & Terminals, E-commerce/3PL, Oil & Gas, Real Estate/Industrial Parks, Public Transport Agencies), 2025-2030 [contracting velocity, ROI profile]
17.4. By Fleet Size (Large, Medium, SMEs), 2025-2030 [vehicle count bands, control room scale]
17.5. By Operational Role Mix, 2025-2030 [remote supervisor ratio, tech staffing]
17.6. By Autonomy Enablement Mode, 2025-2030 [driverless vs safety-driver vs tele-op]
17.7. By Integration Type (Standardized vs Customized), 2025-2030 [time-to-value]
17.8. By Region (South West, South South, South East, North Central, North West, North East), 2025-2029 [corridor expansions, RSU density]
18. Recommendation
19. Opportunity Analysis [white-space map by corridor, partnership playbooks, risk mitigations, financing levers]
Discuss a Customized Research Scope
Custom research scope • Tailored insights • Industry expertise
Research Methodology
Step 1: Ecosystem Creation
Map the ecosystem and identify all the demand-side and supply-side entities for the Nigeria Autonomous Vehicles Market. Based on this ecosystem, we will shortlist leading 5–6 AV operators/integrators and enablers in the country based on their technical readiness, market reach, corridor and depot access, and client base. Sourcing is conducted through industry articles, multiple secondary, and proprietary databases to perform desk research around the market to collate industry-level information.
Step 2: Desk Research
Subsequently, we engage in an exhaustive desk research process by referencing diverse secondary and proprietary databases. This approach enables us to conduct a thorough analysis of the market, aggregating industry-level insights. We delve into aspects like operational domains (ports, depots, campuses), number of potential AV deployers and partners, deployment models, demand pockets, and other variables. We supplement this with detailed examinations of company-level data, relying on sources like press releases, annual reports, financial statements, regulatory filings, and similar documents. This process aims to construct a foundational understanding of both the market and the entities operating within it.
Step 3: Primary Research
We initiate a series of in-depth interviews with C-level executives and other stakeholders representing various Nigeria Autonomous Vehicles Market companies and end-users. This interview process serves a multi-faceted purpose: to validate market hypotheses, authenticate operational statistics, and extract valuable technical, operational and financial insights from these industry representatives. A bottom-to-top approach is undertaken to evaluate program and route contributions for each player, thereby aggregating to the overall market readiness. As part of our validation strategy, our team executes disguised interviews wherein we approach each company under the guise of potential clients. This approach enables us to validate the operational and financial information shared by company executives, corroborating this data against what is available in secondary databases. These interactions also provide us with a comprehensive understanding of revenue streams, value chains, processes, pricing constructs, and other factors.
Step 4: Sanity Check
A bottom-to-top and top-to-bottom analysis along with market modeling exercises is undertaken to assess the sanity of the process, reconciling corridor-level feasibility with entity-level capabilities and evidence gathered across sources.
See What's Inside the Report
Get a preview of key findings, methodology and report coverage
Frequently Asked Questions
The Nigeria Autonomous Vehicles Market is poised to evolve from pilot-stage deployments to early commercialization, anchored by geofenced use-cases across ports and terminals, BRT depots, industrial parks, estates, campuses, and controlled airport or mining operations. Strong demand for safer, more predictable logistics and people movement, expanding 5G/edge footprints, and local assembly/integration capability create clear pathways for supervised autonomy and tele-operation first, followed by selective driverless operations in fenced ODDs. Partnerships among local OEMs, global autonomy stacks, telcos, terminal operators, and insurers will shape the initial scalable plays.
The Nigeria Autonomous Vehicles Market features several key ecosystem actors, including local vehicle makers and assemblers such as Innoson Vehicle Manufacturing, Nord Automobiles, JET Motor Company, and Stallion Group (Nissan Assemblies). Logistics and fleet-ops platforms like MAX, Moove, Kobo360, and GIG Logistics provide operational rails, while MTN and Airtel underpin connectivity for tele-operation and V2X. Global technology enablers—HERE and TomTom (maps), NVIDIA and Mobileye (autonomy compute/ADAS), and Tier-1s such as Bosch and Valeo—bring stack components and integration blueprints suited to Nigeria’s fenced-ODD pilots.
Key growth drivers include the need to decongest and digitize port and yard operations, improve safety outcomes in high-exposure driving environments, and lift asset productivity in depot and campus settings. Expanding 5G and edge-compute infrastructure supports tele-operation and remote assistance, while intelligent transport initiatives and test-center assets improve regulatory comfort. Local OEM/assembler capacity, rising interest from industrial parks and estates, and enterprise demand for outcome-based SLAs (uptime, incident reduction, turnaround-time improvements) collectively create strong pull for near-term supervised autonomy.
Principal challenges include a still-forming regulatory and licensing framework for AV testing and commercial operations, uneven road markings and power reliability that complicate sensor performance and depot uptime, and limited HD-mapping coverage on dynamic urban corridors. Insurance, liability allocation, and data-protection compliance add operational complexity, while mixed traffic with informal modes raises validation burdens. These constraints make phased rollouts—beginning with supervised autonomy and tele-operation in fenced domains—essential while safety cases, infrastructure readiness, and stakeholder capabilities mature.
License Options
PDF + Excel
Complete report package
$4,000
Excel Only
Data and analytics
$2,500