Nigeria Drip Irrigation Market Outlook to 2030
By Market Structure, By Water Source, By Technology, `By Crop, By End-User, and By Region
Report Overview
Report Code
TDR0392
Coverage
Africa
Published
November 2025
Pages
80
Flexible Purchase Options
Select and purchase only the chapters you need for your strategic decisions
On This Page
Report Overview
The report titled “Nigeria Drip Irrigation Market Outlook to 2030 - By Market Structure, By Water Source, By Technology, `By Crop, By End-User, and By Region” provides a comprehensive analysis of the drip irrigation market in Nigeria. The report covers an overview and genesis of the industry, overall market size in terms of revenue, market segmentation; trends and developments, regulatory landscape, customer level profiling, issues and challenges, and competitive landscape including competition scenario, cross-comparison, opportunities and bottlenecks, and company profiling of major players in the drip irrigation market.
Report Coverage
Verified Market Sizing
Multi-layer forecasting with historical data and 5–10 year outlook
Deep-Dive Segmentation
Cross-sectional analysis by product type, end user, application and region
Competitive Benchmarking & Positioning
Market share, operating model, pricing and competition matrices
Actionable Insights & Risk Assessment
High-growth white spaces, underserved segments, technology disruptions and demand inflection points
Review Methodology & Data Structure
Preview report structure, data sources and research framework
Executive Summary
The report titled “Nigeria Drip Irrigation Market Outlook to 2030 - By Market Structure, By Water Source, By Technology, `By Crop, By End-User, and By Region” provides a comprehensive analysis of the drip irrigation market in Nigeria. The report covers an overview and genesis of the industry, overall market size in terms of revenue, market segmentation; trends and developments, regulatory landscape, customer level profiling, issues and challenges, and competitive landscape including competition scenario, cross-comparison, opportunities and bottlenecks, and company profiling of major players in the drip irrigation market. The report concludes with future market projections based on installed hectares, technology mix, crop applications, regions, cause-and-effect relationships, and success case studies highlighting the major opportunities and cautions.
Nigeria Drip Irrigation Market Overview and Size
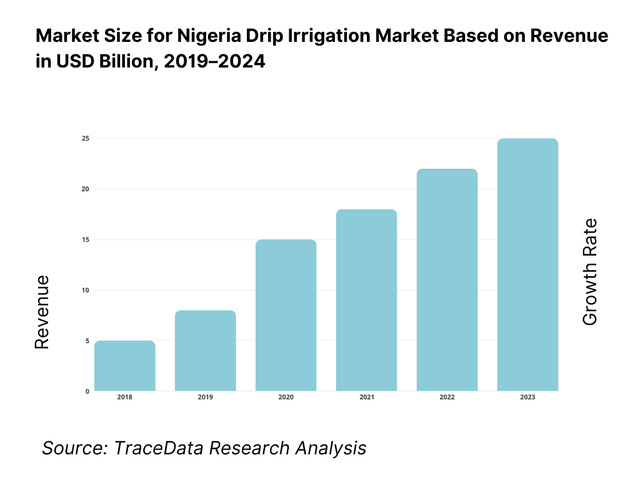
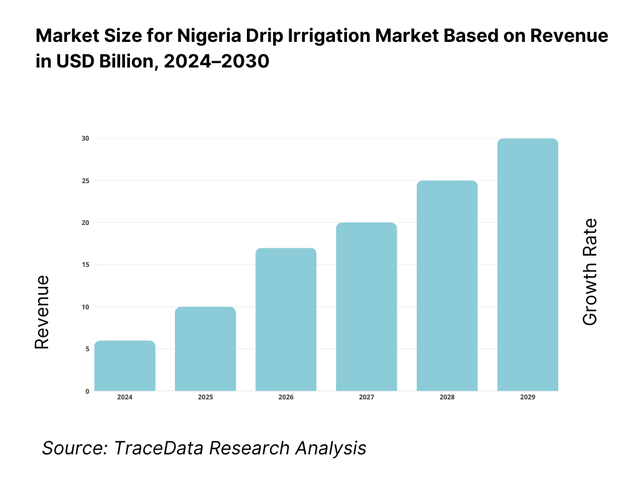
The Nigeria drip irrigation market is valued at USD 154.34 million, based on a five-year historical analysis of irrigation equipment sales and growth, with an 11.4 CAGR over the period. Momentum into USD 252.29 million reflects sustained input demand, dealer build-outs and public-scheme rehabilitation, while Africa-wide equipment revenues crossed USD 538.44 million, reinforcing regional supply depth. Drivers include TRIMING-linked scheme upgrades, smallholder pivot to high-value vegetables, and OEM–dealer financing that lowers upfront costs for fertigation-ready kits.
Northern corridors around Kano, Jigawa, Sokoto and Zamfara dominate because they host rehabilitated command areas under KRIS and HVIS and affiliated schemes reaching 130,000 farmers, ensuring steady intake for drip and filtration components; these hubs also concentrate processing clusters for tomatoes, peppers and onions that reward precise irrigation. Proximity to RBDA depots and integrator bases shortens service lead times, while ongoing TRIMING investments highlighted in 2024 World Bank communications keep O&M cycles active and demand recurring.
What Factors are Leading to the Growth of the Nigeria Drip Irrigation Market:
Public irrigation programs expanding command areas and farmer reach: Nigeria’s large-scale irrigation modernization programs are a major catalyst for drip irrigation adoption. The TRIMING project, which supports irrigation infrastructure rehabilitation, currently benefits over 903,530 farmers across multiple command areas. In parallel, a rural infrastructure push through a US$500 million investment in RAAMP aims to enhance road connectivity, reducing delivery and servicing delays for irrigation components. The country’s GDP, estimated at about US$187.76 billion, provides a strong macroeconomic foundation for capital goods like irrigation systems. Active management by River Basin Development Authorities ensures continuous operation, maintenance, and farmer-level adoption of efficient drip systems.
Large agricultural land base and crop intensity suited to drip: Nigeria’s extensive 700,000+ sq. km of agricultural land creates substantial opportunities for micro-irrigation technologies, especially in water-scarce northern regions. With a population exceeding 233 million people and strong rural participation, demand for water-efficient irrigation is intensifying. Major horticultural belts focusing on tomato, pepper, onion, and citrus are driving adoption as farmers pursue yield stability and year-round cultivation. The country’s logistics and port capacity, supported by more than 1.56 million TEUs of container traffic, ensures steady import flow of emitters, filters, and valves—components critical to scaling drip systems for both commercial and smallholder farms.
Policy and institutional backbone for irrigation scaling: Nigeria’s irrigation governance framework provides a strong policy base for market growth. The Federal Ministry of Water Resources oversees 12 River Basin Development Authorities that coordinate command areas and farmer associations. National programs targeting 500,000 hectares of irrigated land under the National Irrigation and Drainage Policy serve as anchor projects for drip adoption. A transparent foreign exchange reporting system supports better import planning and cost estimation for OEMs and local dealers, even amid currency volatility. The combination of institutional stability, national water management goals, and structured project implementation offers clear pathways for scaling drip systems nationwide.
Which Industry Challenges Have Impacted the Growth of the Nigeria Drip Irrigation Market:
FX volatility elevates imported component exposure: Nigeria’s drip irrigation industry depends heavily on imported components such as emitters, filters, and valves. Exchange rate fluctuations—from ₦645.2 per US$ to ₦1,479.0 per US$ within a year—have sharply increased landed costs for suppliers. Rising inflation levels, recorded at 33.2 for headline CPI, are tightening liquidity across the value chain and impacting farmers’ affordability for new installations. The resulting margin pressure is pushing distributors to favor low-cost, thin-wall tapes over premium PC laterals, limiting long-term system durability and efficiency across irrigation projects.
Power and logistics frictions constrain uptime and serviceability: Although port activity remains robust at over 1.56 million TEUs in container throughput, poor inland road networks and unreliable energy access constrain efficient irrigation operations. Many off-grid farms operate on variable solar and diesel energy profiles, causing inconsistent water pressure and suboptimal system performance. With GDP around US$187.76 billion, infrastructure gaps remain a critical bottleneck to full-scale efficiency. These issues drive higher operational costs through frequent maintenance, emitter replacements, and increased flushing requirements, particularly in northern tomato and pepper cultivation zones where off-grid irrigation dominates.
Water-use governance and O&M cost recovery remain uneven: Despite achieving wide reach under TRIMING, water user associations still face operational funding challenges. Fee recovery rates of around 35% fall below sustainability thresholds, limiting the ability to finance ongoing maintenance and component replacement. With 12 River Basin Development Authorities managing extensive command areas, service delivery often varies regionally, leading to inconsistent performance and delayed repairs. This uneven cost recovery framework constrains long-term system reliability and slows the transition from flood to drip irrigation, particularly in publicly managed agricultural schemes.
What are the Regulations and Initiatives which have Governed the Market:
Water abstraction and use licensing under federal mandate: The Federal Ministry of Water Resources and Sanitation remains the primary authority responsible for licensing, monitoring, and regulating water usage across Nigeria. The 12 River Basin Development Authorities operate under its supervision, managing river-basin assets, allocation rights, and irrigation permits. These authorities ensure compliance with national standards governing borehole drilling, canal distribution, and dam releases. Licensing clarity is essential for drip irrigation projects, especially those sourcing water from regulated reservoirs and irrigation canals that require consistent flow authorization for operation.
Scheme rehabilitation directives and beneficiary management: The TRIMING project framework establishes how rehabilitated hectares are transitioned to water user associations for operation and maintenance. Over 900,000 participating farmers now fall under governance models defining water fee structures, irrigation scheduling, and asset ownership responsibilities. Ongoing program extensions ensure that public procurement and training frameworks remain active, allowing seamless integration of drip systems into existing irrigation blocks. These mechanisms strengthen the regulatory structure for transparent O&M operations and enforceable water-use compliance across large and small irrigation schemes.
Procurement, import, and FX reporting for irrigation equipment: Irrigation components—including emitters, laterals, valves, and filtration units—are largely imported and governed by customs and foreign exchange reporting regulations. Port throughput exceeding 1.56 million TEUs ensures sufficient import capacity, but currency volatility complicates budgeting for suppliers and EPC contractors. Official FX benchmarks are used for customs valuation and procurement planning, aligning with public tender norms under RBDAs. Together with donor-funded procurement frameworks, these controls ensure product eligibility, pricing transparency, and the traceability of imported irrigation components from suppliers to final project sites.
Nigeria Drip Irrigation Market Segmentation
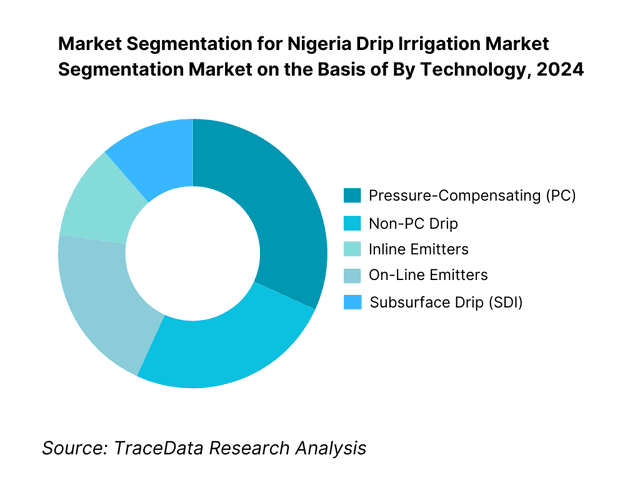
By Technology: Nigeria Drip Irrigation market is segmented by technology into pressure-compensating drip, non-PC drip, inline emitters, on-line emitters and subsurface drip irrigation. Recently, pressure-compensating drip holds a dominant share owing to its uniform discharge over long laterals and undulating topography typical of northern open-fields. This stability protects yield in tomatoes, peppers and onions, where flow deviations quickly hit marketable grades. PC laterals also cope better with solar-pump pressure fluctuations and marginal pressure regulation in off-grid blocks, lowering rework, filter-flush frequency and crop stress—outcomes growers and integrators prioritize when ROI windows are tight.
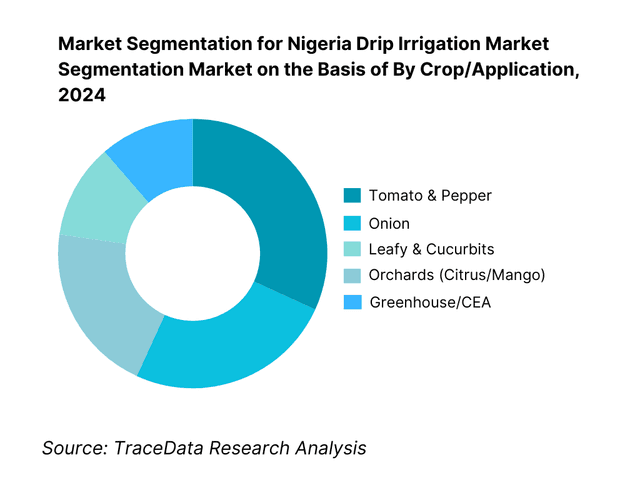
By Crop/Application: Nigeria Drip Irrigation market is segmented by crop/application into tomato & pepper, onion, leafy & cucurbits, orchards and greenhouse/CEA. Recently, tomato & pepper leads due to high acreage in northern belts and strong buyer pull from processors and wholesale markets. These crops respond visibly to water-use efficiency and fertigation (Brix, firmness, fruit uniformity), allowing faster payback on kits even at import-weighted prices. Season extension via drip mitigates rainfall volatility, while short crop cycles suit smallholder cash-flow. Integrators therefore standardize BOMs—thin-wall tapes, PC laterals and venturi fertigation—around solanaceous templates that technicians service at scale.
Competitive Landscape in Nigeria Drip Irrigation Market
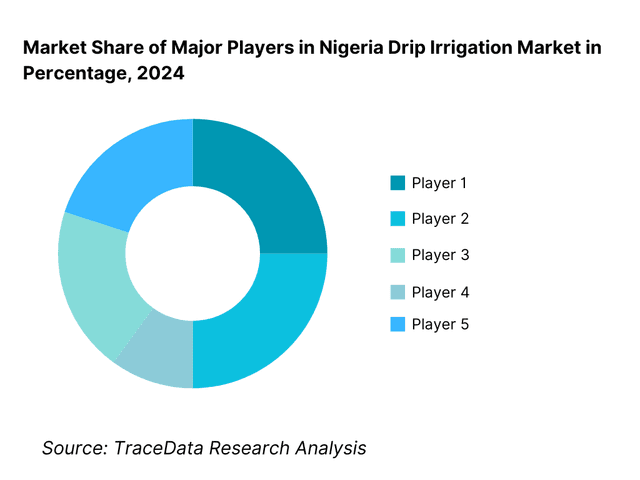
The Nigeria drip irrigation market features global OEMs paired with local integrators and dealer networks. A handful of international brands—Netafim, Jain (incl. NaanDanJain), Rivulis/Eurodrip, Toro, and Irritec—anchor technology supply, while regional assemblers and EPCs configure packages for RBDA blocks and commercial farms. This concentration shapes standards for pressure ratings, emitter anti-clogging designs, and spares interoperability, and influences landed costs amid FX swings. Government- and DFI-backed scheme activity intensifies competition for turnkey lots and after-sales coverage.
Name | Founding Year | Original Headquarters |
Netafim | 1965 | Tel Aviv, Israel |
Jain Irrigation Systems | 1963 | Jalgaon, India |
Rivulis (incl. Eurodrip) | 2014 | Kibbutz Gvat, Israel |
The Toro Company (Aqua-Traxx) | 1914 | Minnesota, USA |
Irritec S.p.A. | 1974 | Capo d’Orlando, Italy |
AZUD | 1989 | Murcia, Spain |
Metzer (Metzerplas) | 1970 | Kibbutz Metzer, Israel |
Rain Bird Corporation | 1933 | Azusa, California, USA |
Hunter Industries | 1981 | San Marcos, California, USA |
Plastic-Puglia | 1967 | Bari, Italy |
Palaplast | 1980 | Larissa, Greece |
Elysee (Elysee Irrigation / Pipe Systems) | 1969 | Nicosia, Cyprus |
Automat Industries | 1985 | New Delhi, India |
Antelco | 1985 | Adelaide, Australia |
Kothari Agritech | 1994 | Pune, India |
Some of the Recent Competitor Trends and Key Information About Competitors Include:
Netafim: As one of the most established drip irrigation providers in Nigeria, Netafim has expanded its network of local integrators to serve TRIMING-backed irrigation schemes. In 2023, the company introduced low-pressure, pressure-compensating (PC) drip systems optimized for solar pumping, supporting water-efficient cultivation across northern horticulture belts. Its focus on agronomic training and turnkey delivery has reinforced its dominance among RBDA-linked farmers.
Jain Irrigation Systems (NaanDanJain): Jain Irrigation has strengthened its footprint in Nigeria through hybrid dealership models and agronomy-led outreach programs. During 2024, the firm rolled out new fertigation controllers and inline emitter designs suitable for variable borehole water quality. It also partnered with local distributors in Kano and Kaduna to support greenhouse farmers and smallholders seeking low-cost, modular drip systems.
Rivulis (Eurodrip): Rivulis has been actively targeting public and private irrigation projects in Nigeria, focusing on affordable tape systems for smallholder vegetable production. In 2024, the company expanded its EPC collaborations, providing filtration solutions tailored for sediment-heavy surface water common in the Sokoto–Zamfara corridor. Its lightweight laterals and easy-maintenance emitters have gained traction in community-managed schemes.
The Toro Company (Aqua-Traxx): Toro has witnessed increased adoption of its Aqua-Traxx thin-wall drip lines in Nigeria’s peri-urban vegetable farms. The brand introduced reinforced emitters to handle fluctuating pressure conditions under diesel and solar-pump setups. In 2024, Toro also collaborated with local agritech firms to pilot smart irrigation timing devices that optimize water distribution and crop yield.
Irritec S.p.A.: Irritec has expanded its product line in Nigeria by promoting on-line drippers, filters, and fertigation units adapted for mixed orchard and vegetable applications. In 2024, it launched a campaign focusing on maintenance training and system longevity for large commercial farms. Its reliability in large estates and fruit orchards has positioned it as a key technology supplier in southern regions.
What Lies Ahead for Nigeria Drip Irrigation Market?
The Nigeria drip irrigation market is poised for steady expansion through 2030, supported by policy-driven irrigation rehabilitation, solar-powered pumping integration, and the rapid commercialization of horticulture belts across the northern corridor. Growth momentum is expected to sustain as public-sector investments under programs like the World Bank–backed Transforming Irrigation Management in Nigeria (TRIMING) project continue, coupled with private integrators expanding dealer-financed smallholder kits. The market’s next phase will emphasize water-use efficiency, technology adaptation to local hydraulic conditions, and alignment with national food security priorities.
Rise of Solar-Drip Integration Models: The future of Nigeria’s irrigation ecosystem will be defined by solar-pump integration with pressure-compensating drip systems. Increasing diesel costs and erratic grid supply are pushing both commercial farms and WUAs to adopt low-pressure, solar-compatible laterals. Solar photovoltaic capacity in Nigeria reached 6,500 MW installed potential (Energy Commission of Nigeria data), with the World Bank’s Nigeria Electrification Project further enhancing rural off-grid viability. This solar infrastructure provides a cost-effective backbone for distributed irrigation, allowing drip systems to maintain steady pressure curves, extend daily pumping hours, and increase command-area coverage per pump set.
Focus on Water Productivity and Controlled Fertigation: With Nigeria’s annual renewable water resources estimated at 286 billion cubic meters (FAO AQUASTAT), efficient allocation through drip technology has become a strategic priority under the National Irrigation and Drainage Policy. Drip systems reduce per-hectare water use and enable targeted fertigation—critical as fertilizer imports exceed US$1.09 billion. OEMs and EPCs are thus pivoting towards nutrient delivery optimization via venturi and dosing pumps. These practices improve fertilizer uptake efficiency, conserve water resources, and directly align with national goals to raise yields in tomato, onion, and pepper value chains without expanding water withdrawals.
Expansion of Horticulture and Greenhouse Cultivation: Nigeria’s horticultural output is rapidly expanding under both donor and private programs. The Ministry of Agriculture reported 3.9 million hectares under vegetable cultivation, forming a natural demand base for micro-irrigation. Greenhouse farming has particularly grown near Lagos, Ogun, Abuja, and Kaduna, where protected cultivation units increased by over 1,200 installations. These setups rely almost exclusively on drip irrigation due to precise moisture control and fertigation requirements. With logistics networks improving via the US$500 million RAAMP program, urban proximity and perishables’ market linkages will further accelerate drip system deployment across greenhouse and peri-urban farms.
Leveraging Digitalization and Sensor-Based Monitoring: As Nigeria’s mobile subscriptions reached 220 million, digital irrigation management platforms are gaining traction. Integrators are increasingly embedding GSM-enabled moisture sensors, flow meters, and pressure monitors into drip installations to optimize irrigation scheduling. These innovations enable remote control and data-driven decision-making for both commercial estates and RBDA-managed fields. The fusion of mobile connectivity and IoT analytics will allow farmers to reduce water waste, detect clogging or leaks faster, and enhance operational efficiency. Over time, digital advisory integration is expected to transform drip irrigation from a static infrastructure investment into a continuous precision-agriculture service model.
Nigeria Drip Irrigation Market Segmentation
By Component
Drip Laterals / Tapes
Emitters (Pressure-Compensating and Non-PC)
Filters (Screen, Disc, Media)
Valves & Fittings
Fertigation Units (Venturi Injectors, Dosing Pumps)
Controllers & Sensors
By Technology
Pressure-Compensating (PC) Drip Systems
Non-Pressure-Compensating (Non-PC) Drip Systems
Inline Emitters
On-Line Emitters
Subsurface Drip Irrigation (SDI)
By Crop Type
Vegetables (Tomato, Pepper, Onion)
Leafy & Cucurbits (Spinach, Melon, Cucumber)
Orchards (Citrus, Mango, Pawpaw)
Plantation Crops (Sugarcane, Oil Palm)
Greenhouse / Controlled Environment Agriculture
By Water Source
Borehole / Solar-Pump Systems
Canal / RBDA Scheme Water
River or Stream Intake
Dam / Reservoir Supply
Rainwater Harvesting & Storage Systems
By End User
Smallholder Farmers
Medium-Sized Commercial Farms
Large Agricultural Estates
Greenhouse Operators
River Basin Development Authority (RBDA) Schemes
Players Mentioned in the Report:
Netafim
Jain Irrigation Systems Ltd. (incl. NaanDanJain)
Rivulis Irrigation (incl. Eurodrip)
The Toro Company (Aqua-Traxx)
Irritec S.p.A.
AZUD
Metzer (Metzerplas)
Rain Bird Corporation
Hunter Industries
Plastic-Puglia
Palaplast
Elysee Irrigation
Automat Industries
Antelco
Kothari Agritech Pvt. Ltd.
Key Target Audience
Irrigation OEMs & Component Manufacturers (drip laterals, emitters, filters, valves)
EPC/System Integrators and National Dealer Networks
Commercial Farms & Agri-Estates (horticulture/orchards)
Water Users Associations (WUAs) & Cooperatives in RBDA command areas
Investments and Venture Capitalist Firms (ag-inputs, embedded finance)
Government & Regulatory Bodies
Development Finance Institutions & Donor Programs
Produce Buyers/Processors
Time Period:
Historical Period: 2019-2024
Base Year: 2025
Forecast Period: 2025-2030
Explore Flexible Purchase Options or Have Limited Budget?
Pay only for relevant chapters • Customizable report sections
Table of Contents
Choose individual sections to purchase. Mix and match as you like.
4.1. Delivery Model Analysis for Drip Irrigation Systems in Nigeria
4.2. Revenue Streams for Nigeria Drip Irrigation Market
4.3. Business Model Canvas for Nigeria Drip Irrigation Market
5.1. Dealer-Driven vs. EPC-Integrated Model
5.2. Investment Model in Nigeria Drip Irrigation Market
5.3. Comparative Analysis of Irrigation Project Funnelling by Public and Private Institutions
5.4. Drip Irrigation Cost Allocation by Farm Size
8.1. Revenues (Historical Installed Base and Annual Sales Value)
8.2. Installed Area in Hectares (Cumulative and Incremental)
8.3. Value per Hectare Benchmark (System Type and Pressure Class)
9.1. By Market Structure (Government Projects / Private Installations)
9.2. By Technology Type (Pressure-Compensating, Non-PC, Inline, On-Line, Sub-Surface, Surface)
9.3. By Crop Application (Tomato & Pepper, Onion, Leafy Vegetables, Citrus & Mango Orchards, Greenhouse Crops)
9.4. By Water Source (Borehole/Solar Pump, Canal/Scheme Water, River Intake, Rainwater Storage)
9.5. By End-User Profile (Smallholders, Medium Commercial Farms, Large Estates, Greenhouse Operators, Schemes/WUAs)
9.6. By Component (Laterals, Emitters, Filters, Valves & Fittings, Fertigation Units, Controllers & Sensors)
9.7. By Sales Channel (Dealers/Retail, EPC Turnkey Projects, NGO/DFI Programs, Digital Marketplaces)
9.8. By Region (North-West, North-Central, North-East, South-West, South-South, South-East)
10.1. Farmer Cohort and Adoption Segmentation (Commercial, Cooperative, Scheme-Linked, Outgrower)
10.2. Drip Irrigation Decision-Making Process (Cost-Benefit Assessment, Extension Influence, Input Dealer Role)
10.3. Productivity and ROI Analysis (Yield Gains, Water Savings, Payback Period)
10.4. Adoption Gap Analysis Framework (Potential vs. Installed Base; Barriers: FX Cost, Technical Know-How, Finance Access)
11.1. Trends and Developments (Solar-Drip Integration, Smart Controllers, Precision Fertigation, Service Contracts)
11.2. Growth Drivers (Government Rehabilitation, Greenhouse Growth, Donor Funding, Climate Adaptation)
11.3. SWOT Analysis for Nigeria Drip Irrigation Market
11.4. Issues and Challenges (Clogging, Maintenance, Distribution Fragmentation, Currency Volatility)
11.5. Government Regulations (Water-Use Licensing, Import Duty Framework, SON Standards, Scheme Guidelines)
12.1. Market Size and Future Potential for Digital & IoT-Based Irrigation Platforms in Nigeria
12.2. Business Model and Revenue Streams (Hardware-Plus-Software, Subscription Models, Data Analytics)
12.3. Delivery Models and Services Offered (Mobile-Linked Controllers, Moisture Sensors, Advisory Dashboards)
15.1. Market Share of Key Players in Nigeria Drip Irrigation Market (Basis Revenues and Installed Area)
15.2. Benchmark of Key Competitors Including: Company Overview, USP, Business Strategy, Business Model, Local Assembly, Revenue Estimates, Installed Hectares, Pricing by System Type, Service Network, Key Clients (Schemes/Estates), Partnerships, Product Portfolio, Technology Level, and Recent Developments.
15.3. Operating Model Analysis Framework (OEM-Dealer-Farmer Interfaces, After-Sales Logistics, Spare-Part Supply)
15.4. Gartner Magic Quadrant for Drip Irrigation Providers in Nigeria (Leaders, Challengers, Visionaries, Niche Players)
15.5. Bowman’s Strategic Clock (Price-Value Positioning and Competitive Advantage Matrix)
16.1. Revenues (Forecast Installed Hectares and Market Value)
16.2. Value-Chain Expansion and Financing Projections
17.1. By Market Structure (Government Projects / Private Installations)
17.2. By Technology Type (Pressure-Compensating, Non-PC, Inline, On-Line, Sub-Surface, Surface)
17.3. By Crop Application (Tomato & Pepper, Onion, Leafy Vegetables, Citrus & Mango Orchards, Greenhouse Crops)
17.4. By Water Source (Borehole/Solar Pump, Canal/Scheme Water, River Intake, Rainwater Storage)
17.5. By End-User Profile (Smallholders, Medium Farms, Large Estates, Greenhouse Operators, Schemes/WUAs)
17.6. By Component (Laterals, Emitters, Filters, Valves & Fittings, Fertigation Units, Controllers & Sensors)
17.7. By Sales Channel (Dealers/Retail, EPC Turnkey Projects, NGO/DFI Programs, Digital Marketplaces)
17.8. By Region (North-West, North-Central, North-East, South-West, South-South, South-East)
Discuss a Customized Research Scope
Custom research scope • Tailored insights • Industry expertise
Research Methodology
Step 1: Ecosystem Creation
Map the ecosystem and identify all the demand-side and supply-side entities for the Nigeria Drip Irrigation Market. On the demand side, stakeholders include smallholder farmers, commercial farms, water user associations (WUAs), greenhouse operators, and River Basin Development Authorities (RBDAs) managing public irrigation schemes under the Federal Ministry of Water Resources. On the supply side, entities consist of global OEMs such as Netafim, Jain Irrigation, Rivulis, Toro, and Irritec, alongside EPC contractors, local distributors, importers, and financial institutions such as IFAD, AfDB, BOA, and NIRSAL that facilitate credit, grants, and donor-backed installations. Based on this mapped ecosystem, the top 5–6 suppliers are shortlisted using key parameters including financial turnover, installed hectares, import volumes, and project participation in TRIMING and RBDA contracts. Sourcing is conducted through government publications, trade filings, and proprietary irrigation databases to compile comprehensive industry-level information, identify technology adoption flow, map regional service density, and assess distribution network strengths across Nigeria’s agricultural zones.
Step 2: Desk Research
An exhaustive desk research phase is conducted to gather comprehensive secondary data on Nigeria’s irrigation landscape. This includes analysis of sector revenues, installed drip systems, dealership distribution, and import throughput trends. Market structure evaluation is undertaken by segmenting the industry based on technology (pressure-compensating vs. non-pressure-compensating systems), end-use (smallholder vs. commercial farms), and water source (surface vs. borehole). Company-level data is compiled through trade filings, EPC tender documents, press releases, and OEM disclosures to assess product diversity, regional coverage, and operational scale. This phase develops a strong foundational understanding of irrigation infrastructure, pricing logic per hectare, dealer credit mechanisms, and the competitive positioning of each active supplier, helping frame the revenue architecture of Nigeria’s evolving drip irrigation ecosystem.
Step 3: Primary Research
This phase involves in-depth primary interviews with C-level executives, EPC contractors, RBDA engineers, donor program heads, and commercial farm operators across key regions. The purpose is to validate hypotheses from desk research and authenticate information regarding system pricing, installed base, performance reliability, and localized adaptations for Nigeria’s hydraulic and soil conditions. A bottom-up approach is used to quantify revenue contributions from individual participants, which is then aggregated to estimate national market value. Simultaneously, top-down validation is achieved through triangulation with import data, donor program investments, and public procurement records under TRIMING. Disguised interviews are also carried out with integrators and distributors to verify pricing, credit policies, and service commitments. These engagements provide granular insights into value-chain dynamics, filtration challenges, lead times for spares, maintenance practices, and operational efficiencies of solar-drip systems deployed in northern corridors.
Step 4: Sanity Check
A final sanity-check exercise integrates both top-down and bottom-up analytical approaches to ensure data reliability and logical consistency. Market sizing is modeled using triangulated data derived from import volumes, EPC installations under donor-funded programs, and reported dealer sales from major OEMs. Cross-verification is conducted using macroeconomic benchmarks such as Nigeria’s total agricultural land area, irrigated command areas under public schemes, and import values for fertilizers and irrigation components. These benchmarks help confirm the proportional relationship between input availability, cultivated land coverage, and the rate of micro-irrigation adoption. The outcome delivers a balanced estimation framework that reflects both the structural challenges and scalable opportunities of Nigeria’s drip irrigation market, ensuring accuracy, consistency, and validity in the final market model.
See What's Inside the Report
Get a preview of key findings, methodology and report coverage
Frequently Asked Questions
The Nigeria Drip Irrigation Market presents strong potential, driven by ongoing irrigation modernization programs and the rapid growth of horticulture production. The market was valued at USD 154.34 million in 2023, reflecting increasing adoption of water-efficient systems under schemes such as TRIMING, which has reached 903,530 farmer beneficiaries across northern command areas. The country’s vast 700,000 sq. km of agricultural land, coupled with government-backed irrigation targets under the National Irrigation and Drainage Policy, positions Nigeria to become West Africa’s leading adopter of precision irrigation. Expanding solar-powered and greenhouse farming further reinforces its scalability and investment attractiveness.
The Nigeria Drip Irrigation Market features both global OEMs and regional integrators working across public schemes and private horticultural clusters. Key players include Netafim, Jain Irrigation (NaanDanJain), Rivulis (Eurodrip), The Toro Company (Aqua-Traxx), and Irritec S.p.A., each offering complete system packages with localized dealer networks. Supporting manufacturers such as AZUD, Metzer, Rain Bird, and Plastic-Puglia supply filtration and component solutions for diverse water conditions. These players dominate due to their technical expertise, reliable supply of pressure-compensating emitters, and integration into World Bank and RBDA-linked projects, particularly in the Kano, Kaduna, and Sokoto irrigation corridors.
Nigeria’s irrigation growth is propelled by three key drivers. First, large-scale public investments like the World Bank–funded TRIMING Project, with an allocation exceeding US$495 million, continue to rehabilitate and expand irrigated areas, creating infrastructure ready for micro-irrigation. Second, expanding vegetable cultivation—covering 3.9 million hectares—and the rise of greenhouse clusters near Lagos and Abuja sustain high-value crop demand that requires precise drip systems. Third, rising diesel costs and increasing solar adoption—supported by 6,500 MW installed solar potential—are encouraging transitions to low-pressure, energy-efficient drip irrigation kits. These combined macro and operational factors ensure continuous long-term market expansion.
Despite its promising growth, the Nigeria Drip Irrigation Market faces persistent structural and operational challenges. First, foreign exchange volatility—where the naira shifted from ₦645.2 per US$ in 2023 to ₦1,479.0 per US$ in 2024—inflates import costs for key components like emitters, filters, and valves. Second, water governance and maintenance constraints limit efficiency, as only 35% of O&M cost recovery was achieved under the TRIMING performance review. Third, rural logistics gaps persist, with the RAAMP program investing US$500 million to restore rural road connectivity critical for irrigation maintenance and input supply. Collectively, these issues highlight infrastructure fragility, policy fragmentation, and cost recovery as the core hurdles to market scalability.
License Options
PDF + Excel
Complete report package
$4,000
Excel Only
Data and analytics
$2,500
Custom Sections
Starts from $100
$0