Peru Gold Mining Market Outlook to 2030
By Market Structure, By Mining Method, By Ore/Deposit Type, By Processing Route, By End-Use/Sales Channel, and By Region
Report Overview
Report Code
TDR0343
Coverage
Central and South America
Published
October 2025
Pages
80
On This Page
Report Overview
The report titled “Peru Gold Mining Market Outlook to 2030 – By Market Structure, By Mining Method, By Ore/Deposit Type, By Processing Route, By End-Use/Sales Channel, and By Region” provides a comprehensive analysis of the gold mining industry in Peru. The report covers an overview and genesis of the industry, overall market size in terms of production and exports, market segmentation; trends and developments, regulatory landscape, stakeholder profiling, issues and challenges, and competitive landscape including competition scenario, cross-comparison, opportunities and bottlenecks, and company profiling of major players in the gold mining market.
Report Coverage
Verified Market Sizing
Multi-layer forecasting with historical data and 5–10 year outlook
Deep-Dive Segmentation
Cross-sectional analysis by product type, end user, application and region
Competitive Benchmarking & Positioning
Market share, operating model, pricing and competition matrices
Actionable Insights & Risk Assessment
High-growth white spaces, underserved segments, technology disruptions and demand inflection points
Review Methodology & Data Structure
Preview report structure, data sources and research framework
Executive Summary
The report titled “Peru Gold Mining Market Outlook to 2030 – By Market Structure, By Mining Method, By Ore/Deposit Type, By Processing Route, By End-Use/Sales Channel, and By Region” provides a comprehensive analysis of the gold mining industry in Peru. The report covers an overview and genesis of the industry, overall market size in terms of production and exports, market segmentation; trends and developments, regulatory landscape, stakeholder profiling, issues and challenges, and competitive landscape including competition scenario, cross-comparison, opportunities and bottlenecks, and company profiling of major players in the gold mining market. The report concludes with future market projections based on production volumes, processing technologies, regions, cause-and-effect relationships, and success case studies highlighting the major opportunities and cautions.
Peru Gold Mining Market Overview and Size
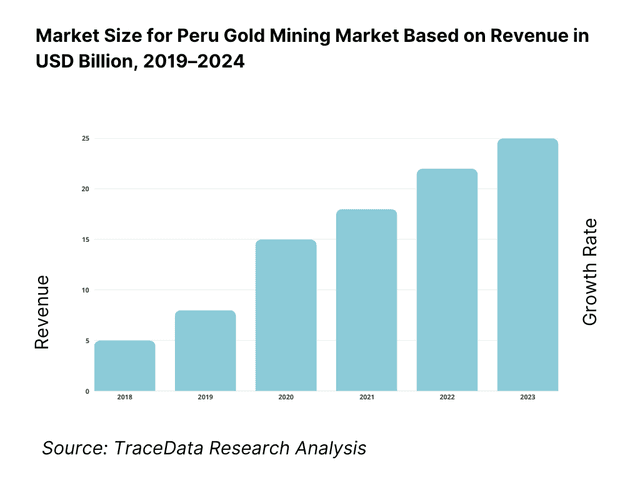
The Peru Gold Mining market is valued at USD 8.92 billion, based on a five-year historical analysis of customs-reported exports. The latest full-year observable period shows gold exports of USD 13.58 billion, reflecting price strength and robust external demand from bullion hubs. These figures are drawn from official trade statistics consolidated by OEC for the former and from wire-reported government tallies for the latter, underscoring gold’s safe-haven appeal and the strong pull from refiners in North America, Europe and Asia.
Production and export flows are anchored in La Libertad, Cajamarca and Arequipa, where high-grade vein systems, established underground operations, and mature processing plants concentrate output; official bulletins consistently identify these regions as the leading origin hubs. On the demand side, Canada, India and Switzerland dominate as destinations owing to refinery capacity, bullion banking infrastructure and deep wholesale markets. The combination of geological endowment at source and world-class refining/off-take ecosystems at destination explains the trade gravity.
What Factors are Leading to the Growth of the Peru Gold Mining Market:
Large, proven gold-production base anchored by high-grade underground belts: Peru’s gold mine output has remained consistently substantial, with official references recording production of 100 metric tons in the most recent cycles. Northern underground districts such as La Libertad and Cajamarca, supported by established processing circuits including CIL and heap-leach plants, are the backbone of this supply. This strong production platform ensures reliable shipments to international bullion hubs, while also enabling mine plans with long-term horizons. The durability of this output base supports hedging policies, contractual stability, and throughput growth at ore-buying plants that formalize artisanal material, aligning investment with stable tonnage rather than fluctuating prices.
Active state-tracked investment pipeline across exploration and construction: The mining authority in Peru maintains a transparent pipeline of exploration projects with a value of US$ 644 million, of which US$ 191 million is dedicated to 12 gold-focused projects. Alongside this, the development portfolio highlights multi-billion-dollar shovel-ready and optimization projects, such as the Integración Coroccohuayco expansion valued at US$ 1,500 million. These state-tracked investments span the full lifecycle of the sector, from exploration to mine construction, underpinning long-term supply security. The depth of this portfolio boosts demand for contractors, drilling, EPCM firms, and processing technology suppliers across Peru’s gold operations.
Trade and macro capacity that supports outbound flows and mining logistics: Peru’s external sector provides a solid framework for moving doré and concentrates. The country’s exports of goods and services are valued at US$ 71.13 billion, reflecting the strength of its tradable sectors where mining is central. At the same time, national GDP stands at US$ 303.29 billion, highlighting the scale of the economy to sustain major mining investments and balance-of-payments inflows. Together, these macro indicators provide the financial and institutional capacity to fund mine infrastructure, sustain corridor logistics, and ensure efficient customs and central-bank settlements for consistent gold exports.
Which Industry Challenges Have Impacted the Growth of the Peru Gold Mining Market:
Persistent informality and slow conversion within the formalization registry (REINFO): Despite regulatory programs, full compliance among artisanal and small-scale miners remains limited. Around 85,000 miners are registered in the REINFO system, yet the total workforce connected to small-scale mining is estimated at nearly 500,000 people. The significant gap between those registered and those fully formalized complicates traceability and creates risks for processors and exporters. This gap raises compliance costs, adds ESG burdens, and forces refiners and buyers to impose stricter documentation standards to guarantee the legitimacy of shipments entering international bullion markets.
Environmental pressure points in Amazonian gold districts documented by state data platforms: Gold mining continues to exert heavy environmental pressure in Peru’s Amazon regions. Government forest-monitoring systems have documented tens of thousands of hectares of cumulative forest loss, with departmental breakdowns showing Madre de Dios and Pasco as hotspots. Technical reports confirm deforestation alerts across late-year quarters, detailing the expansion of mining-linked clearings. These hectare-scale impacts translate directly into operating constraints, stricter enforcement, remediation obligations, and reputational risks for both large-scale and artisanal operators that rely on Amazon corridors for production.
Social-conflict exposure along mining corridors that disrupt mineral haulage: Transport corridors serving mining operations face recurring disruptions due to local conflicts and community negotiations. One major case highlighted community demands of 2,000,000 soles annually in benefits against a company offer of 1,150,000 soles, with the corridor already experiencing around 600 days of stoppages since operations began. While originating in copper projects, the same routes are critical for moving gold plant inputs and outputs. These blockades create measurable day-count losses, increase working capital requirements, and generate schedule risks for gold operators reliant on shared logistics infrastructure.
What are the Regulations and Initiatives which have Governed the Market:
Legal definitions for small-scale and artisanal mining set explicit tonnage and area limits: Peruvian mining law specifies clear numeric thresholds that shape licensing routes. Small-scale mining operations are capped at 350 tons per day in installed processing capacity and up to 2,000 hectares in concessions. Artisanal operations are limited to 25 tons per day and 1,000 hectares. These definitions directly influence whether operators qualify as artisanal or small-scale miners, determining the environmental instruments, supervision bodies, and licensing complexity they must follow for vein, placer, or porphyry-style gold deposits.
Environmental licensing: IGAFOM structure and documented compliance pathway for REINFO miners: Artisanal and small-scale miners seeking formalization must comply with the IGAFOM framework, which is divided into corrective and preventive components. Formal documents and regional portals outline the formats and numeric case files required, including docket-level submissions. These requirements establish a transparent compliance roadmap for processors sourcing ASM ore, ensuring that registered miners transition toward environmental standards in line with national regulations. This structured framework is crucial for integrating ASM supply into formalized, traceable channels that meet international ESG expectations.
EIA process timing: administrative completeness check with specified working-day limit: Peru’s national SEIA regulations mandate that the environmental authority perform an administrative completeness check within five working days of receiving an Environmental Impact Assessment request. Although this stage does not review the technical content, it is critical in determining the timeline for subsequent evaluations and public participation. For gold mining projects, this numeric window provides predictability for permit managers, aligning project schedules with contractor mobilization and community consultations. This helps reduce delays in critical-path mine development projects dependent on timely EIA approvals.
Peru Gold Mining Market Segmentation
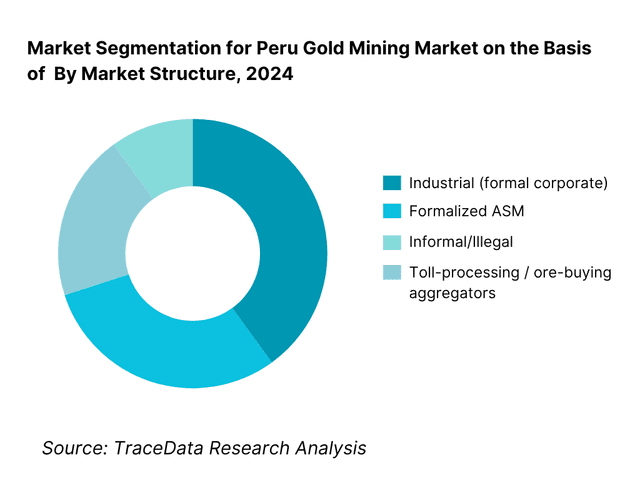
By Market Structure: Peru Gold Mining market is segmented by market structure into industrial (formal corporate), formalized artisanal/small-scale mining (ASM), informal/illegal operations, and toll-processing/ore-buying aggregators that channel ASM ore to compliant plants. Recently, industrial (formal corporate) has a dominant market share under this segmentation, due to scale advantages (higher plant throughput, consistent head grades, better metallurgical recoveries), access to lower-cost capital and long-term offtake/refining contracts. Formal operations also maintain ESG and HSE systems that reduce stoppages and secure social license compared to informal supply.
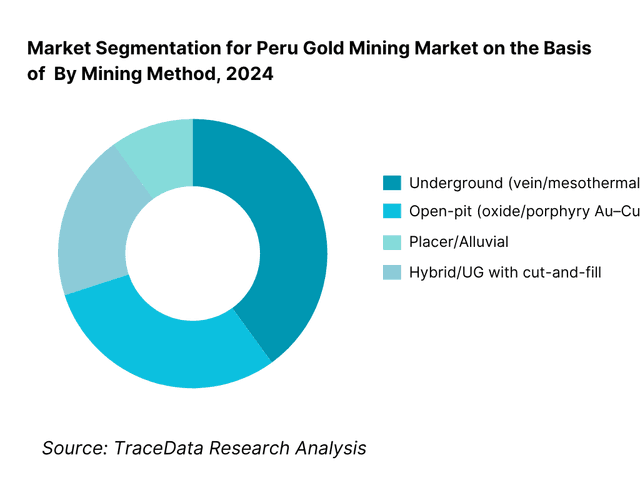
By Mining Method: Peru Gold Mining market is segmented by mining method into underground, open-pit, placer/alluvial and hybrid. Recently, underground has a dominant market share in this segmentation, driven by the prevalence of high-grade epithermal/mesothermal veins in the northern belt (e.g., Pataz and other La Libertad districts) and Cajamarca’s legacy lodes that favor mechanized underground stoping with gravity/CIL. Underground circuits in these districts deliver higher recovered ounces per tonne versus lower-grade open-pit oxides, which, while important, face cost and community constraints at altitude and water-use trade-offs.
Competitive Landscape in Peru Gold Mining Market
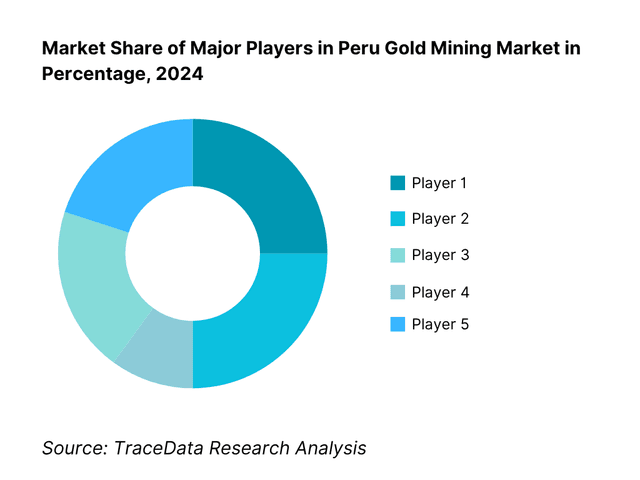
The Peru Gold Mining market exhibits a bar-bell structure: a handful of large, integrated formal operators with stable offtake and financing, and a long tail of mid-tier/junior miners and ASM-linked ore-buying processors. Consolidation around northern underground districts has raised operational resilience among leaders, while high prices have attracted more ASM feed to compliant plants. International buyers in Canada, India and Switzerland remain pivotal, reinforcing pricing power at destination hubs.
Name | Founding Year | Original Headquarters |
Minera Yanacocha (Newmont) | 1992 | Lima, Peru |
Minera Boroo Misquichilca (Lagunas Norte) | 2005 | La Libertad, Peru |
Compañía de Minas Buenaventura | 1953 | Lima, Peru |
Hochschild Mining (Minera Ares) | 2000 | Lima, Peru |
Gold Fields La Cima (Cerro Corona) | 1996 | Lima, Peru |
Pan American Silver – Shahuindo | 1994 | Lima, Peru |
Pan American Silver – La Arena | 1998 | Lima, Peru |
Minera Poderosa | 1997 | Arequipa, Peru |
Minera Aurífera Retamas (MARSA) | 2002 | Cajamarca, Peru |
Consorcio Minero Horizonte (CMH) | 2003 | Cajamarca, Peru |
Dynacor Group – Veta Dorada | 1984 | Montreal, Canada |
Inca One Gold (Chala One / Kori One) | 2010 | Toronto, Canada |
PPX Mining (Igor) | 2006 | Lima, Peru |
Aruntani | 2009 | Lima, Peru |
Minera Bateas (Fortuna Silver) | 1983 | Lima, Peru |
Some of the Recent Competitor Trends and Key Information About Competitors Include:
Minera Yanacocha (Newmont): As Peru’s largest gold producer, Yanacocha has advanced its transition strategy by ramping up underground development to extend mine life while reducing reliance on declining open-pit reserves. The operator has invested in new tailings management systems and community benefit programs, reinforcing its ESG commitments to maintain social license in Cajamarca.
Compañía de Minas Buenaventura: Buenaventura has undertaken a modernization of processing circuits across its multi-mine portfolio, enhancing recovery rates at Orcopampa and Uchucchacua. The company is also strengthening its copper-gold pipeline, diversifying revenue streams while maintaining a solid position in high-grade underground gold veins.
Hochschild Mining (Minera Ares): Hochschild has shifted operational focus towards higher-margin underground mines, particularly Inmaculada, where efficiency programs and digital mining solutions are being deployed. The firm continues to emphasize sustainable practices, with strong community engagement and biodiversity initiatives in southern Peru.
Minera Boroo Misquichilca (Lagunas Norte): Following its acquisition of Lagunas Norte, Boroo has launched a phased development plan targeting refractory ore zones. Investments are being channeled into processing upgrades, including CIL and bio-oxidation technology, aimed at unlocking previously untapped reserves.
Pan American Silver (Shahuindo and La Arena): Pan American has optimized production in its La Libertad portfolio, increasing throughput at Shahuindo and advancing life-of-mine extension studies at La Arena. These assets are benefiting from operational synergies and scale efficiencies, positioning the company as a key mid-tier producer in Peru’s northern belt.
What Lies Ahead for Peru Gold Mining Market?
The Peru gold mining market is anticipated to maintain steady expansion through the end of the decade, underpinned by a combination of robust international demand for bullion, ongoing formalization of artisanal operations, and Peru’s geological endowment of high-grade underground deposits. Growth momentum will also be shaped by regulatory reforms encouraging traceability and ESG compliance, alongside sustained infrastructure investments that improve logistics for gold-producing regions.
Transition Toward Underground Expansions: Future production is expected to rely increasingly on underground developments in northern regions such as La Libertad and Cajamarca, as open-pit oxide reserves mature. Companies are investing in advanced underground mining techniques to extend mine life and improve ore recovery rates.
Formalization and Integration of ASM Supply: The government’s continued push to formalize artisanal and small-scale miners (ASM) will reshape supply dynamics. By channeling ASM ore into compliant processing plants, the sector will expand traceable output while reducing risks tied to illegal mining and environmental degradation.
ESG and Community-Centric Growth: Operators will intensify commitments to environmental, social, and governance (ESG) practices. With social conflicts often disrupting operations, companies will increasingly align projects with community benefit-sharing frameworks, biodiversity protection, and stricter water and tailings management standards.
Technology Adoption in Processing and Security: The sector will see broader application of digital tools, AI-enabled monitoring, and automation across both mine sites and processing plants. This will enhance productivity, optimize ore blending, improve gold recovery rates, and strengthen security protocols in regions affected by illegal mining.
Global Market Integration and Refinery Linkages: Peruvian gold exports will continue to flow strongly to major buyers such as Switzerland, India, and Canada, but the future will involve deeper integration with global refiners demanding certified supply. This shift will incentivize companies and processors to adopt international due diligence standards and sustainability certifications.
Peru Gold Mining Market Segmentation
By Market Structure (In Value %)
Industrial (Formal Corporate Mines)
Formalized Artisanal and Small-Scale Mining (ASM)
Informal / Illegal Mining
Ore-buying / Toll-processing Aggregators
By Mining Method (In Volume %)
Underground Mining
Open-Pit Mining
Placer / Alluvial Mining
Hybrid / Cut-and-Fill or Combined Methods
By Ore / Deposit Type (In Value %)
Epithermal High-Sulfidation Systems
Mesothermal / Vein-hosted Deposits
Porphyry Au–Cu Systems
Placer Deposits
By End-Use / Sales Channel (In Value %)
Doré Exports to International Refineries
Domestic Refining / Processing Plants
Jewelry Manufacturing
Investment Bullion and Industrial Uses
By Region (In Value %)
Northern Peru
Southern Andes
Central Andes
Amazonian Corridor
Players Mentioned in the Report:
Minera Yanacocha (Newmont)
Minera Boroo Misquichilca (Lagunas Norte)
Compañía de Minas Buenaventura
Hochschild Mining (Minera Ares)
Gold Fields La Cima (Cerro Corona)
Pan American Silver – Shahuindo
Pan American Silver – La Arena
Minera Poderosa
Minera Aurífera Retamas (MARSA)
Consorcio Minero Horizonte (CMH)
Dynacor Group – Veta Dorada (ore-buying/processing)
Inca One Gold (Chala One/Kori One; ore-buying/processing)
PPX Mining (Igor)
Aruntani
Minera Bateas (Fortuna)
Key Target Audience
International bullion banks and trading houses (e.g., destination hubs in Canada/Switzerland/India)
Refineries and smelters (global LBMA-linked operators)
Mining majors and mid-tiers (operators evaluating JV/acquisitions in Peru)
Ore-buying/processing plants (toll-millers) targeting formal ASM feed
Equipment OEMs and mining contractors (UG fleet, processing circuits)
Government and regulatory bodies (MINEM, OEFA, ANA, SUNAT, and regional governments)
Investments and venture capitalist firms (resource funds, streaming/royalty financiers)
Community development & infrastructure funds
Time Period:
Historical Period: 2019-2024
Base Year: 2025
Forecast Period: 2025-2030
See What's Inside the Report
Get a preview of key findings, methodology and report coverage
Table of Contents
1. Executive Summary
2. Research Methodology
3. Ecosystem of Key Stakeholders in Peru Gold Mining Market [stakeholder map: MINEM, OEFA, ANA, SUNAT, regional govts, SNMPE, communities, indigenous orgs, ASM associations, EPCMs, OEMs, drillers, explosives, logistics, labs, refiners, off-takers, lenders/DFIs]
4. Value Chain Analysis [exploration → permitting → development → extraction (open-pit/UG/placer) → processing (CIL/CIP/heap leach) → refining/export → end-use]
4.1. Mining & Processing Route Analysis-Open-Pit, Underground, Placer, Heap-Leach, CIL/CIP [margins by route (AISC/oz), operator preference by deposit type, strengths/weaknesses, recovery %, dilution risk, capex intensity]
4.2. Revenue Streams for Peru Gold Mining Market [doré vs concentrate sales, by-products (Ag, Cu), toll-milling/ore buying, hedging/streaming/royalties, carbon credits/ESG premiums]
4.3. Business Model Canvas for Peru Gold Mining Market [customer segments (refiners/traders), value propositions (low AISC/high ESG), key partners (contractors/communities), key activities, resources (licenses/reserves), channels (export routes), cost structure, revenue structure]
5. Market Structure
5.1. ASM/Informal vs Industrial Workforce Models [share of output, productivity (oz/FTE), skill depth, training pipelines]
5.2. Investment Models in Peru Gold Mining Market [owner-operated, JV, royalties/streams, PSA-style for ASM hubs, project finance vs equity, vendor finance]
5.3. Comparative Analysis of the Permitting/Concession Funnel-Private vs Government Interfaces [titles, EIAs, community consultation/benefit agreements, enforcement cadence]
5.4. Capex & Opex Budget Allocation by Company Size, 2024 [LCEs vs mid-tier vs juniors: sustaining vs growth capex, drilling, community/ESG, HSE, security]
6. Market Attractiveness for Peru Gold Mining Market [resource endowment, grade distribution (g/t), cost curve position vs peers, stability of fiscal regime, logistics, power, water access, community risk, FX]
7. Supply-Demand Gap Analysis [mine plan vs export realizations, refinery capacity vs doré output, ASM ore supply to plants, seasonal disruptions, security shutdowns]
8. Market Size for Peru Gold Mining Market Basis
8.1. Revenues, 2019-2024
9. Market Breakdown for Peru Gold Mining Market Basis
9.1. By Market Structure, 2023-2024P [industrial formal, formalized ASM, informal/illegal]
9.2. By Mining Method, 2023-2024P [open-pit, underground, placer/alluvial, hybrid operations]
9.3. By Geological/Deposit Type, 2023-2024P [epithermal high-sulfidation, mesothermal veins, porphyry Au-Cu, placer]
9.4. By Company Size, 2023-2024P [large producers, mid-tiers, juniors, formal ASM hubs]
9.5. By Workforce Category, 2023-2024P [direct employees, contractors, ASM miners, processing-plant workers]
9.6. By Logistics Mode, 2023-2024P [road corridor, airlift (high-altitude), riverine (Amazonia)]
9.7. By Contracting Model, 2023-2024P [owner mining, contract mining, toll-milling]
9.8. By Region, 2023-2024P [Northern (La Libertad/Cajamarca), Southern (Puno/Cusco), Central Andes (Junín/Pasco/Lima), Amazonian (Madre de Dios/Pataz)]
10. Demand-Side Analysis for Peru Gold Mining Market
10.1. Buyer/Off-taker Landscape & Cohort Analysis [refiners, traders, bullion banks; contract tenors, discount structures]
10.2. Mine-Plan to Sales Decision Process [hedging, price realization, shipment scheduling, quality penalties, ESG clauses]
10.3. Program Effectiveness & ROI Analysis [capex IRR, cash cost vs AISC deltas, debottlenecking ROI, formalization ROI for ASM]
10.4. Gap Analysis Framework [resource vs reserve conversion, mill utilization vs nameplate, EIA approvals vs backlog]
11. Industry Analysis
11.1. Trends & Developments for Peru Gold Mining Market [digital mines, security hardening, community benefit-sharing, low-grade bulk mining, consolidation]
11.2. Growth Drivers for Peru Gold Mining Market [global gold price, FDI inflows, exploration meters drilled, formalization momentum, technology adoption]
11.3. SWOT Analysis for Peru Gold Mining Market [high-grade veins; regulatory volatility; formalization; illegal mining/security]
11.4. Issues & Challenges for Peru Gold Mining Market [permitting timelines, social conflict, mercury/deforestation, ore grade decline, tailings standards]
11.5. Government Regulations for Peru Gold Mining Market [royalty/tax regime, REINFO/ASM rules, EIA/hydrology, security measures, OECD due diligence]
12. Snapshot on Informal & ASM Gold Mining in Peru
12.1. Market Size & Future Potential for ASM/Informal Segment, 2018-2029
12.2. Business Models & Revenue Streams [ore-buying, toll-milling, aggregators, refiners]
12.3. Operating Setups & Typical Practices [manual vs mechanized, mercury-free tech adoption, environmental controls]
13. Opportunity Matrix for Peru Gold Mining Market-Radar Chart [heap-leach debottlenecking, refractory processing, ore-buying hubs, security tech, community JV models, digital maintenance, downstream refining]
14. PEAK Matrix Analysis for Peru Gold Mining Market [operator capability vs market impact across producers, processors, and service providers]
15. Competitor Analysis for Peru Gold Mining Market
15.1. Market Share of Key Players by Revenues/Output, 2023
15.2. Benchmark of Key Competitors [company overview, USP, strategy, business model, #employees/#contractors, revenues, AISC & pricing, processing technology, flagship assets, major offtakers, strategic tie-ups, marketing/investor strategy, recent developments]
15.3. Operating Model Analysis Framework [owner-operate vs contract, centralized vs site-based processing, community engagement model]
15.4. Gartner-Style Quadrant (Adapted) for Peru Producers/Processors [leaders/challengers/niche/visionaries]
15.5. Bowman’s Strategic Clock for Competitive Advantage [low cost vs differentiated ESG vs focused ore-buying]
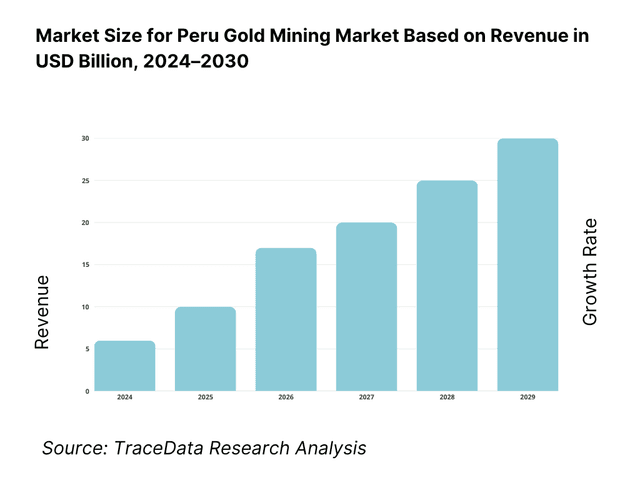
16. Future Market Size for Peru Gold Mining Market Basis
16.1. Revenues, 2025-2030
17. Market Breakdown for Peru Gold Mining Market Basis
17.1. By Market Structure, 2025-2030 [industrial formal, formal ASM, informal/illegal]
17.2. By Mining Method, 2025-2029 [open-pit, underground, placer, hybrid]
17.3. By Geological/Deposit Type, 2025-2030 [epithermal, mesothermal veins, porphyry Au-Cu, placer]
17.4. By Company Size, 2025-2030 [large, mid-tier, junior, formal ASM hubs]
17.5. By Workforce Category, 2025-2030 [employees, contractors, ASM miners, plant workers]
17.6. By Logistics Mode, 2025-2030 [road, air, riverine]
17.7. By Contracting Model, 2025-2030 [owner mining, contract mining, toll-milling]
17.8. By Region, 2025-2030 [Northern, Southern, Central Andes, Amazonian]
18. Recommendation
19. Opportunity Analysis
Discuss a Customized Research Scope
Custom research scope • Tailored insights • Industry expertise
Research Methodology
Step 1: Ecosystem Creation
We begin by mapping the complete ecosystem of the Peru Gold Mining Market, identifying both demand-side and supply-side entities. On the demand side, this includes international bullion banks, refineries in Switzerland, India, and Canada, as well as domestic ore-buying plants and aggregators that process artisanal ore. On the supply side, the map encompasses industrial operators (e.g., Newmont Yanacocha, Buenaventura, Hochschild), artisanal and small-scale miners (ASM), contractors, equipment OEMs, EPCMs, and community cooperatives. Based on this ecosystem, we shortlist 5–6 leading mining operators and processors using financial disclosures, export data, and tonnage outputs. Sourcing is conducted through MINEM bulletins, SUNAT customs data, official geological service reports, secondary industry articles, and proprietary mining databases to collate reliable sector-level information.
Step 2: Desk Research
An exhaustive desk research process is then undertaken by referencing government databases, UN COMTRADE/WITS trade data, USGS mineral summaries, and proprietary mining information portals. This allows us to assess production volumes in metric tons, export flows, regulatory filings, and compliance indicators. Company-level insights are built from annual reports, sustainability disclosures, investor presentations, and financial statements, with special focus on tonnage output, AISC metrics, workforce figures, and ESG frameworks. Through this structured approach, we establish a robust understanding of Peru’s mining landscape, the financial profiles of key competitors, and the integration of ASM feed into formal processing channels.
Step 3: Primary Research
We complement secondary findings with primary interviews involving C-level executives, mine managers, regulatory officials (MINEM, OEFA), and refining/off-take partners. These interviews validate market hypotheses, confirm production and processing statistics, and extract operational insights on ore grades, processing routes, and community relations. As part of our validation approach, we also conduct disguised interviews with ore-buying plants and mid-tier operators, posing as potential stakeholders. This enables us to cross-check tonnage intake figures, ASM supplier numbers, and compliance practices, comparing them against secondary disclosures. These interactions enrich our view of revenue streams, value-chain steps, ore purchasing mechanisms, and traceability systems.
Step 4: Sanity Check
Finally, a dual top-down and bottom-up market sizing model is applied to reconcile production and export values. From the top-down, we anchor on official export tallies in USD and metric tons. From the bottom-up, we aggregate mine-level outputs, processor intakes, and regional contributions. Discrepancies are reconciled through sensitivity tests, scenario modeling, and triangulation across multiple data sources. This ensures consistency, accuracy, and a validated foundation for insights into the Peru Gold Mining Market.
See What's Inside the Report
Get a preview of key findings, methodology and report coverage
Frequently Asked Questions
The Peru Gold Mining Market holds strong potential, anchored by an official output of 100 metric tons of gold in 2023 according to the USGS. This production level places Peru among the top global gold producers, supported by vast high-grade reserves in Cajamarca, La Libertad, and Arequipa. The market’s potential is further strengthened by its robust export profile, with shipments valued at USD 8.92 billion in the same year, making gold one of Peru’s top three export commodities and a key driver of foreign exchange inflows.
The Peru Gold Mining Market features several key players, including Minera Yanacocha, Compañía de Minas Buenaventura, Hochschild Mining, Gold Fields La Cima, and Minera Boroo Misquichilca. These companies dominate due to their large-scale operations, robust underground and open-pit assets, and integration into global refining hubs. Other notable contributors include Minera Poderosa, MARSA, Consorcio Minero Horizonte, and ore-processing firms such as Dynacor and Inca One Gold, which strengthen formalized artisanal supply channels.
Key growth drivers include Peru’s 100 metric ton annual production base, providing a stable platform for exports, and an active investment portfolio of US$ 644 million in exploration projects, of which US$ 191 million targets gold. International trade also supports growth, with total exports of goods and services valued at US$ 71.1 billion in 2024, of which gold is a leading contributor. Together, geological endowment, pipeline investments, and global demand for bullion make the sector resilient and attractive for further expansion.
Challenges include persistent informality, with 85,000 artisanal miners registered in the REINFO system and around 500,000 people working in small-scale mining, many still outside full compliances. Environmental pressures are acute, with the Geobosques platform tracking tens of thousands of hectares of forest loss linked to mining zones. Social conflict also disrupts operations; for example, mining corridors have faced stoppages totaling over 600 days since inception, with local communities demanding up to 2,000,000 soles annually in benefits. These structural issues add operational and reputational risks for the sector.
License Options
PDF + Excel
Complete report package
$4,000
Excel Only
Data and analytics
$2,500