Philippines Biofertilizers Market Outlook to 2030
By Microbial Type, By Formulation, By Application Method, By Crop/End Use, and By Region
Report Overview
Report Code
TDR0396
Coverage
Asia
Published
December 2025
Pages
80
Flexible Purchase Options
Select and purchase only the chapters you need for your strategic decisions
On This Page
Report Overview
The report titled “Philippines Biofertilizers Market Outlook to 2030 – By Microbial Type, By Formulation, By Application Method, By Crop/End Use, and By Region” provides a comprehensive analysis of the biofertilizers industry in the Philippines. The report covers an overview and genesis of the industry, overall market size in terms of revenue and treated hectares, market segmentation; trends and developments, regulatory landscape, customer-level profiling, issues and challenges, and competitive landscape including competition scenario, cross-comparison, opportunities and bottlenecks, and company profiling of major players in the biofertilizers market.
Report Coverage
Verified Market Sizing
Multi-layer forecasting with historical data and 5–10 year outlook
Deep-Dive Segmentation
Cross-sectional analysis by product type, end user, application and region
Competitive Benchmarking & Positioning
Market share, operating model, pricing and competition matrices
Actionable Insights & Risk Assessment
High-growth white spaces, underserved segments, technology disruptions and demand inflection points
Review Methodology & Data Structure
Preview report structure, data sources and research framework
Executive Summary
The report titled “Philippines Biofertilizers Market Outlook to 2030 – By Microbial Type, By Formulation, By Application Method, By Crop/End Use, and By Region” provides a comprehensive analysis of the biofertilizers industry in the Philippines. The report covers an overview and genesis of the industry, overall market size in terms of revenue and treated hectares, market segmentation; trends and developments, regulatory landscape, customer-level profiling, issues and challenges, and competitive landscape including competition scenario, cross-comparison, opportunities and bottlenecks, and company profiling of major players in the biofertilizers market. The report concludes with future market projections based on treated-hectare volumes, microbial product demand, crop categories, and regions, along with cause-and-effect relationships and success case studies highlighting the major opportunities and cautions.
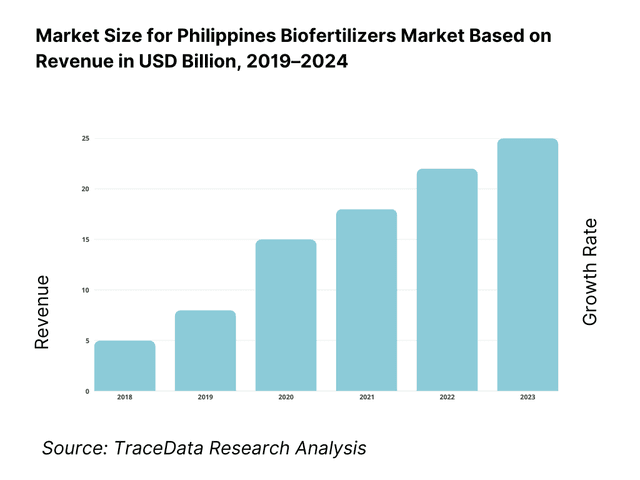
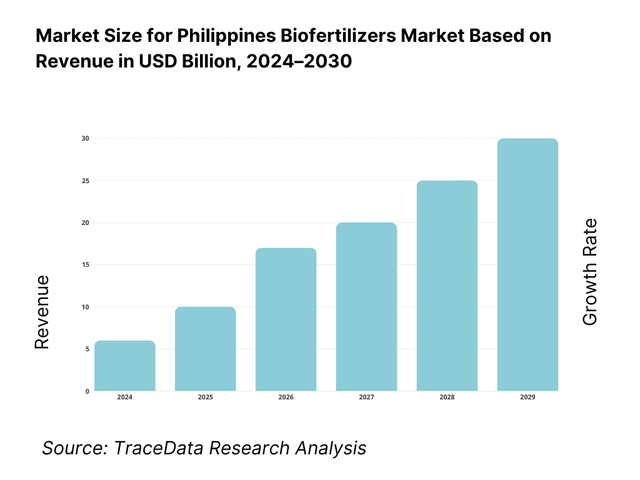
Philippines Biofertilizers Market Overview and Size
The Philippines’ biological input adoption is anchored by an agricultural microbials market valued at USD 120 million, with biofertilizers a policy-backed subset. Regionally, demand is reinforced by an Asia–Pacific biofertilizers market at roughly USD 0.76–0.87 billion and globally by USD 2.31 billion in biofertilizers sales, reflecting broad momentum toward microbial nutrition. Local purchase decisions are shaped by program deployments, dealership networks, and price levels of mineral fertilizers that microbial products can partially offset.
Adoption clusters around Central Luzon, Cagayan Valley, and major Mindanao belts where rice, corn and sugarcane hectares concentrate and inputs move through active dealer hubs. The Bio-N program’s commercialization and licensing activity, alongside Fertilizer and Pesticide Authority (FPA) oversight and periodic Department of Agriculture procurement episodes, sustains visibility and stocking in these corridors. At the same time, media-covered Bio-N supply constraints highlight where demand tends to outstrip capacity, reinforcing dominance of provinces with stronger logistics.
What Factors are Leading to the Growth of the Philippines Biofertilizers Market:
Broad farm base and arable footprint supporting microbial adoption: The Philippines maintains a large agricultural footprint of 127,226 sq. km of farmland requiring recurring nutrient inputs and soil restoration. With 7.41 million agricultural operators across rice, corn, sugarcane, coconut, banana, and vegetable farms, the potential base for microbial inoculant use is extensive. The economy, valued at USD 497.5 billion, sustains dealer networks, extension programs, and private-sector input distribution across regions. This wide agricultural and economic base establishes a stable and diversified landscape for biofertilizer penetration, demo plots, and cooperative-led adoption models, reducing per-hectare risk through multi-crop and multi-regional exposure.
High nutrient intensity and crop output necessitating efficiency gains: Crop systems in the Philippines exhibit high nutrient intensity, with fertilizer application averaging 285 kg per hectare of arable land. This heavy mineral dependence creates the need for complementary biological inputs like nitrogen-fixing bacteria, PSB, and AMF. Total crop production exceeds 24.94 million metric tons in a single quarter, reflecting the scale of nutrient demand across staple and cash crops. In rice alone, 19.09 million metric tons of unmilled palay were recorded for the year, underlining the importance of nitrogen management. Biofertilizers contribute to reducing synthetic fertilizer reliance while enhancing soil structure, nutrient uptake, and yield consistency under variable weather conditions.
Trade-enabled input access and distribution corridors: The Philippines maintains strong trade infrastructure supporting agricultural inputs, with imports valued at USD 4.34 billion in one quarter and total agricultural trade reaching USD 27.22 billion for the year. These flows provide reliable inventory for distributors, improve cold-chain handling for microbial products, and ensure replenishment to rice and corn production hubs. The overall macroeconomic environment—anchored by a GDP of USD 497.5 billion—facilitates logistics and financing for both domestic and international suppliers. Biofertilizer companies benefit from these established import corridors and port systems, allowing for efficient scaling, rural penetration, and stable supply availability throughout the archipelago.
Which Industry Challenges Have Impacted the Growth of the Philippines Biofertilizers Market:
Fragmented farm structure increases last-mile and adoption frictions: The agricultural sector’s 7.41 million operators manage small farms averaging only 0.83 hectare each, posing challenges for product education and distribution efficiency. This fragmentation raises per-farmer training costs, complicates compliance for microbial application protocols, and slows down proof-of-concept demonstrations necessary for adoption. The spatial dispersion across 127,226 sq. km of farmland further complicates logistics, particularly for temperature-sensitive liquid inoculants. To overcome this, suppliers must design smaller packaging units, cluster-based education models, and cooperative purchasing systems that lower distribution costs and ensure proper product handling at the grassroots level.
Entrenched mineral input habits and variable harvest conditions: An average fertilizer use intensity of 285 kg per hectare highlights farmers’ deep-rooted reliance on synthetic fertilizers. Shifting behavior toward bio-based inputs remains gradual due to performance skepticism and yield risk perceptions. Palay production of 19.09 million metric tons underscores the sector’s size but also its vulnerability to seasonal and climatic variability, which influences nutrient management decisions. Quarterly crop outputs averaging 24.94 million metric tons emphasize the dynamic input requirements that fluctuate with weather and soil conditions. Building farmer confidence in microbial solutions will require demonstration farms, compatibility validation, and government-backed integration under balanced fertilization programs.
Quality assurance throughput constrained by accredited testing capacity: Biofertilizer quality control in the Philippines is regulated through only seven accredited laboratories under the Fertilizer and Pesticide Authority, limiting throughput for simultaneous product verification and certification. With millions of smallholders and overlapping crop calendars, delays in laboratory testing during peak seasons can restrict market entry and supply continuity. Suppliers must manage batch scheduling and diversify partnerships with certified testing facilities to maintain compliance. Strong documentation practices and inventory coordination are essential to prevent shipment delays and ensure that microbial viability standards are met across the national distribution network.
What are the Regulations and Initiatives which have Governed the Market:
Mandatory handler licensing for fertilizer businesses with public registry access: All entities involved in importing, manufacturing, distributing, transporting, or selling fertilizers must hold valid handler licenses issued by the Fertilizer and Pesticide Authority. The licensing system ensures traceability and accountability across a vast network of distributors serving over seven million farmers. This regulatory mechanism helps monitor compliance, prevent counterfeit products, and ensure proper stewardship of biofertilizers during peak agricultural cycles, strengthening the integrity of the supply chain nationwide.
Product registration with dossier, labeling, and lab validation requirements: Every fertilizer product, whether locally produced or imported, must undergo product registration with complete technical dossiers, approved labeling, and laboratory validation before commercial sale. Seven officially recognized laboratories handle testing for nutrient content, contaminants, and microbial viability. This system enhances product reliability and prevents entry of substandard or counterfeit goods. Covering an agricultural land area of 127,226 sq. km, the regulatory framework promotes uniform quality and supports sustained farmer trust in biological inputs.
Compliance monitoring via advisories, registered-product lists, and import summaries: The Fertilizer and Pesticide Authority maintains a national database of registered fertilizer products and routinely issues advisories on safety, labeling, and product stewardship. Agricultural trade data—showing total trade of USD 27.22 billion and quarterly imports of USD 4.34 billion—helps regulators align inspection schedules and sampling intensity with shipment volumes. This synchronized compliance monitoring system improves oversight during high-import periods, curbs the risk of unregistered inputs entering the market, and enhances transparency in the country’s growing biofertilizer ecosystem.
Philippines Biofertilizers Market Segmentation
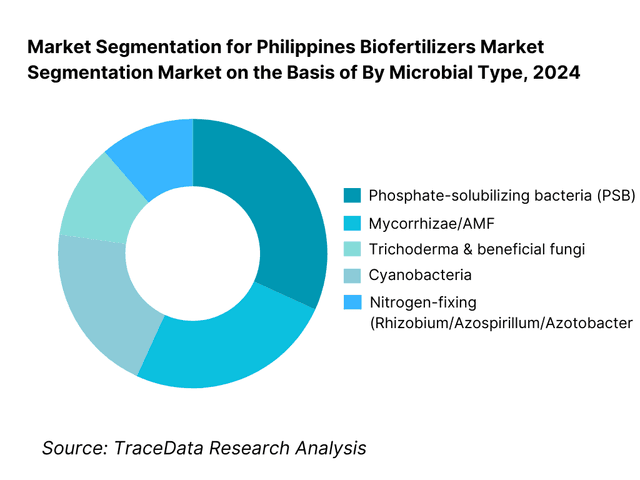
By Microbial Type: Philippines biofertilizers adoption is led by nitrogen-fixing inoculants, driven by the long-running Bio-N footprint for rice and corn and dealer familiarity with dose, handling, and crop response. PSB follows where phosphorus use efficiency and acidic soils make solubilization pay back quickly in paddy and upland plots. Mycorrhizae gains traction in sugarcane, banana, coconut and vegetables, where root volume and stress tolerance materially influence yield and quality. Trichoderma and other beneficial fungi are common in vegetable clusters seeking vigor and root disease suppression, while cyanobacteria sees niche use in paddy systems. Nitrogen-fixers dominate because of institutional trials, established SOPs, and consistent per-hectare economics that can replace part of urea bags while improving stand vigor—benefits that are readily demonstrated on demo plots and communicated by extension partners and dealer agronomists.
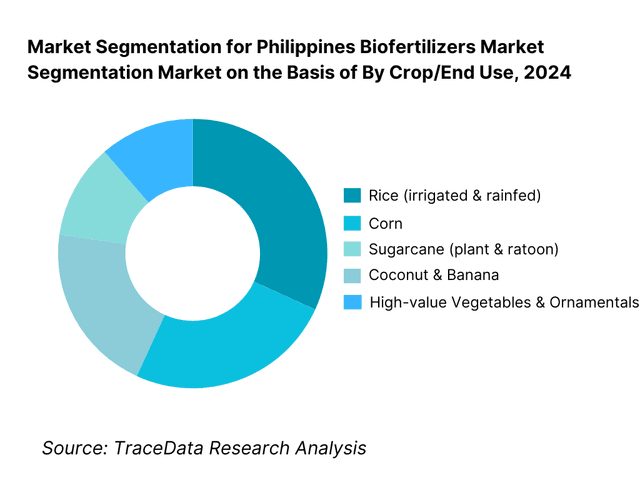
By Crop/End Use: Rice dominates biofertilizer demand owing to the country’s extensive paddy area, the historic Bio-N fit for seed/seedling treatment, and recurring public focus on rice productivity. Corn is next due to strong hybrid usage and clear nitrogen economics. Sugarcane estates and outgrower zones adopt microbial consortia and mycorrhizae to support ratoon vigor and nutrient efficiency, while coconut and banana leverage microbial root symbiosis in intercropping systems for nutrient capture and stress tolerance. Vegetables (tomato, brassicas, solanaceous crops) skew toward higher-value formulations (including Trichoderma and AMF) to secure quality and reduce chemical load near harvest. Rice’s leadership stems from programmatic trials, widespread extension knowledge, and reliable logistics into irrigated belts—making microbial dosing simpler to standardize and monitor versus more fragmented horticulture supply chains.
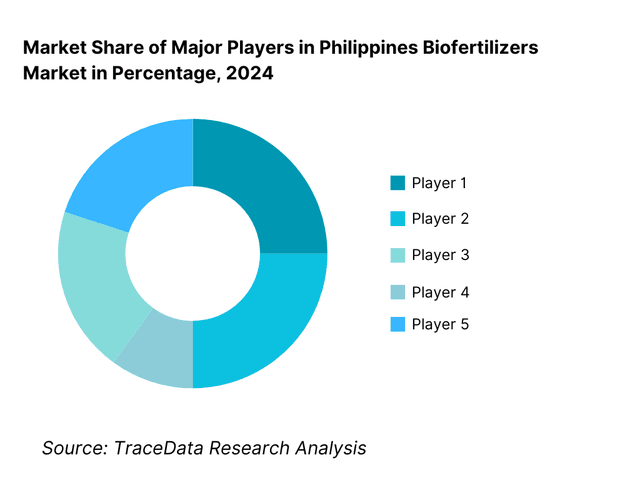
Competitive Landscape in Philippines Biofertilizers Market
The Philippines biofertilizers landscape is characterized by a mix of domestic R&D-anchored brands and global biologicals routed through local distributors. The long-running Bio-N line from UPLB-BIOTECH underpins national awareness, while licensing and exclusive production agreements shape availability. Global players with microbial portfolios—via AMF, PSB, and nitrogen-fixers—operate through local channel partners alongside major fertilizer distributors. Periodic government procurement cycles and program signals influence stocking and pricing. This configuration concentrates influence among a handful of technology originators and their licensed producers/distributors, with dealer networks determining local share.
Name | Founding Year | Original Headquarters |
UPLB-BIOTECH (Bio-N Program) | 1979 | Los Baños, Philippines |
PCAARRD-Affiliated Nutrio® Consortium | 1972 | Los Baños, Philippines |
Novonesis (formerly Novozymes) | 1925 | Bagsværd, Denmark |
Rizobacter / Bioceres Group | 1977 | Pergamino, Argentina |
Koppert Biological Systems Philippines | 1967 | Berkel en Rodenrijs, Netherlands |
Lallemand Plant Care | 1915 | Montreal, Canada |
Corteva Agriscience | 2019 | Indianapolis, USA |
BASF Agricultural Solutions Philippines | 1865 | Ludwigshafen, Germany |
Bayer Crop Science Philippines | 1863 | Leverkusen, Germany |
UPL Philippines | 1969 | Mumbai, India |
Atlas Fertilizer Corporation | 1957 | Cebu, Philippines |
Planters Products Inc. | 1960 | Makati, Philippines |
East-West Seed Agri Inputs Division | 1982 | Nonthaburi, Thailand |
Harbest Agribusiness Corporation | 1997 | Quezon City, Philippines |
Yara Philippines Inc. | 1905 | Oslo, Norway |
Some of the Recent Competitor Trends and Key Information About Competitors Include:
UPLB-BIOTECH (Bio-N): As the pioneer and government-recognized producer of microbial inoculants in the Philippines, UPLB-BIOTECH expanded its Bio-N production capacity through new licensing agreements with regional partners in 2024. The center strengthened quality assurance protocols for nitrogen-fixing strains such as Azospirillum brasilense and Azotobacter, aligning with the Fertilizer and Pesticide Authority’s (FPA) renewed guidelines for microbial viability and shelf-life verification. The move ensures higher distribution efficiency across Central Luzon and Mindanao rice belts.
PCAARRD Nutrio® Consortium: Under the Department of Science and Technology (DOST), PCAARRD continued to support Nutrio® biofertilizer commercialization programs targeted at sugarcane, corn, and vegetable farmers. In 2024, the consortium introduced upgraded formulations combining Phosphate-Solubilizing Bacteria (PSB) and Mycorrhizal fungi, improving nutrient uptake and soil resilience. Its public–private tie-ups have resulted in wider pilot trials in Negros and Bukidnon plantation corridors.
Novonesis (formerly Novozymes): Global biosolutions leader Novonesis reinforced its presence in the Philippines through new distributor partnerships aimed at integrating microbial blends for corn and banana farms. In 2024, it introduced enhanced carrier technologies designed for tropical storage stability and high CFU consistency. The company’s biofertilizer lines now feature dual-strain inoculants targeting nitrogen fixation and phosphorus solubilization for high-value horticulture export clusters.
Rizobacter / Bioceres: Argentine agribiotech major Rizobacter, part of the Bioceres Group, deepened its engagement with local distributors by launching field trials on legume and corn inoculants in Davao and Cagayan Valley. The company has also begun co-developing locally adapted Rhizobium and Azospirillum consortia under tropical soil conditions. The firm’s push into biofertilizers aligns with its global strategy of integrating seed-applied biologicals into regenerative farming programs.
Koppert Biological Systems Philippines: Koppert strengthened its position in the Philippines by expanding its mycorrhizal and microbial consortia offerings for sugarcane and banana plantations. In 2024, the company established new demonstration plots in Bukidnon and Davao del Norte to showcase combined benefits of microbial inoculants and bio-control solutions. The firm’s focus on long-term soil health and reduced chemical dependency has resonated with estate growers and high-value crop exporters.
What Lies Ahead for Philippines Biofertilizers Market?
The Philippines biofertilizers market is expected to strengthen steadily through the remainder of the decade, supported by a combination of agronomic necessity, environmental policy, and institutional investment in soil restoration. The country’s agriculture remains a 9.4% contributor to GDP, and with 7.41 million farm operators, the base for microbial adoption is expanding rapidly. Growth will be further reinforced by higher fertilizer import costs and the government’s push for local production under the Fertilizer and Pesticide Authority (FPA) framework, making microbial inputs a viable efficiency tool within nutrient management programs.
Rise of Integrated and Hybrid Application Models: The future of biofertilizer use in the Philippines will be marked by hybrid nutrient management programs that combine microbial inoculants with mineral fertilizers to optimize nutrient-use efficiency. With an average fertilizer consumption of 285 kilograms per hectare of arable land, biologicals will serve as both cost and sustainability levers. Local manufacturing expansions at UPLB-BIOTECH and private blending units in Central Luzon are improving availability. Hybrid use models—seed inoculation plus soil drench or PSB plus urea combinations—are gaining favor due to their tangible yield and soil health outcomes, particularly in intensive rice and corn zones.
Focus on Soil Regeneration and Sustainable Productivity: Soil nutrient depletion remains a key challenge, with 127,226 square kilometers of agricultural land under repeated cropping cycles. The Philippine Department of Agriculture’s nationwide Balanced Fertilization Strategy emphasizes reduced dependency on chemical fertilizers and integration of biological soil amendments. This aligns with the country’s 2.2 million hectares of rice area that demand sustained fertility restoration. Biofertilizers such as Rhizobium, PSB, and AMF are set to be central to these programs, as their consistent use enhances soil organic carbon and nutrient cycling, improving resilience against yield volatility in major food crops.
Expansion of Crop-Specific and Region-Specific Programs: Future adoption will be concentrated in targeted crop and regional programs. In Mindanao alone, 5.3 million hectares of farmland present a scalable base for biofertilizers in sugarcane, banana, and coconut production. Luzon’s irrigated rice belts and Visayas’ sugar estates are also being integrated into government-led microbial inoculant distribution under FPA monitoring. The expected expansion of sector-specific formulations—PSB for sugarcane, AMF for banana, and nitrogen-fixers for rice—will deepen localization of biofertilizer products, creating specialized supply chains and field-service networks aligned with regional soil and climate conditions.
Leveraging Research, AI, and Data Analytics for Product Efficacy: Digital agriculture adoption is reshaping biofertilizer deployment. The Philippines recorded 164 million mobile broadband subscriptions, enabling the use of precision-farming apps and AI-based soil mapping tools that can optimize microbial dosing. The Department of Science and Technology (DOST) and PCAARRD are developing platforms linking soil microbiome analytics with agronomic recommendations. This digital backbone will help verify field efficacy, standardize microbial dosage, and forecast CFU decay in storage, leading to smarter distribution and traceable outcomes. As digital literacy and connectivity expand, AI-based monitoring of inoculant performance will become a cornerstone of sustainable crop productivity management.
Philippines Biofertilizers Market Segmentation
By Microbial Type
Nitrogen-Fixing Bacteria (Rhizobium, Azospirillum, Azotobacter)
Phosphate-Solubilizing Bacteria (PSB)
Mycorrhizal Fungi (AMF)
Trichoderma & Beneficial Fungi
Cyanobacteria
By Crop / End Use
Rice (Irrigated & Rainfed)
Corn
Sugarcane (Plant & Ratoon)
Coconut & Banana (Intercrop Systems)
High-Value Vegetables & Ornamentals
By Formulation
Carrier-Based Powder
Liquid Inoculant
Encapsulated Granules
Consortium / Multi-Strain Blends
Bio-Stimulant Integrated Formulations
By Application Method
Seed Treatment
Soil Drench
Root Dip
In-Furrow Application
Foliar Bio-Nutrient Spray
By Region
Luzon
Visayas
Mindanao
BARMM (Bangsamoro Autonomous Region in Muslim Mindanao)
Nationwide Institutional Procurement Programs (DA/FPA-led Distribution)
Players Mentioned in the Report:
Atlas Fertilizer Corporation
BASF Agricultural Solutions Philippines
Bayer Crop Science Philippines
Corteva Biologicals / Symborg (via PH partners)
East-West Seed (agri-inputs alliances)
Harbest Agribusiness Corporation
Koppert Philippines
Lallemand Plant Care
Novonesis (Novozymes)
Planters Products, Inc.
Rizobacter / Bioceres (via PH distribution)
SEED Core Enterprises
UPL Philippines
UPLB-BIOTECH (Bio-N)
Yara Philippines
Key Target Audience
Plantation Groups & Estate Operators (sugar, banana, coconut)
Commercial Growers’ Cooperatives & Federations
Input Distributors & Agri-Dealer Chains
Food Processors & Exporters (Residue-sensitive supply programs)
Agri-eCommerce & B2B Marketplaces (Fulfilment partners)
Investments & Venture Capitalist Firms (impact & agrifood investors)
Government & Regulatory Bodies
Banks & Rural Finance / Microfinance Institutions (input credit lines)
Time Period:
Historical Period: 2019-2024
Base Year: 2025
Forecast Period: 2025-2030
Explore Flexible Purchase Options or Have Limited Budget?
Pay only for relevant chapters • Customizable report sections
Table of Contents
Choose individual sections to purchase. Mix and match as you like.
4.1. Delivery Model Analysis for Biofertilizers (bulk dealer sales, demo-based, LGU/government tenders, direct plantation contracts, digital retail)
4.2. Revenue Streams for Philippines Biofertilizers Market
4.3. Business Model Canvas for Philippines Biofertilizers Market
5.1. Domestic Manufacturers vs. Import Distributors (production base, import share, formulation diversity)
5.2. Investment Model (local SME units, public R&D commercialization, venture/impact funds, DA grants, co-op participation)
5.3. Comparative Analysis of Government vs. Private Distribution (DA procurement flow, LGU targeting, plantation direct supply)
5.4. Biofertilizer Procurement Budgets by Agency and Private Sector (DA/FPA, sugar mills, plantation groups, organic farms)
8.1. Revenues (historical trajectory; CAGR based on DA/FPA records and private-sector supply)
9.1. By Market Structure (domestic manufacturing vs. imported; organized vs. informal)
9.2. By Microbial Type (Rhizobium, Azospirillum, Phosphate-Solubilizing Bacteria, Mycorrhiza, Trichoderma, Cyanobacteria)
9.3. By Crop/End Use (rice, corn, sugarcane, coconut, banana, vegetables)
9.4. By Company Type (plantations, SMEs, co-operatives, government farms, agritech distributors)
9.5. By Farmer Segment (smallholders, commercial growers, estate managers)
9.6. By Formulation (liquid, carrier-based, granulated, encapsulated, consortium blends)
9.7. By Application Method (seed inoculation, root dip, soil drench, foliar, in-furrow)
9.8. By Region (Luzon, Visayas, Mindanao, BARMM)
10.1. Farmer and Plantation Cohort Analysis (farm size, credit access, awareness levels, adoption curve)
10.2. Decision-Making Process (price sensitivity, dealer influence, extension reach, product demo impact)
10.3. ROI and Yield Improvement Analysis (cost/ha vs. yield uplift %, net benefit calculation)
10.4. Gap Framework (awareness gap, supply gap, trust/quality gap, finance gap)
11.1. Trends and Developments (microbial consortia, liquid inoculants, carrier innovation, e-commerce channel growth)
11.2. Growth Drivers (import substitution, soil restoration programs, DA incentives, organic certification)
11.3. SWOT Analysis
11.4. Issues and Challenges (shelf life, cold storage, counterfeits, fragmented regulation)
11.5. Government Regulations (FPA registration, product testing, labeling, compliance timelines)
12.1. Market Size and Potential for E-commerce and B2B Marketplace Integration (Biofertilizers through Lazada/Amazon/agrimarket apps)
12.2. Digital Business Models and Revenue Streams (subscription delivery, digital demos, advisory bundling)
12.3. Channel Strategy (direct vs. aggregator-led)
15.1. Market Share of Key Players (basis revenues, hectares served, registered strains)
15.2. Benchmark of Key Competitors (company overview, USP, business strategy, business model, production capacity, pricing/pack size, technology used, top crops served, major clients, strategic tie-ups, marketing strategy, recent developments)
15.3. Operating Model Analysis (R&D to distribution flow, dealer incentives, field demo networks)
15.4. Comparative Strategic Framework (innovation aggressiveness, integration depth, ESG alignment)
15.5. Competitive Positioning Matrix (niche, challenger, leader, innovator quadrants)
16.1. Revenue Projections (medium-term CAGR and growth potential by microbial type and crop base)
17.1. By Market Structure (organized vs. unorganized)
17.2. By Microbial Type (consortia-led vs. single strain)
17.3. By Crop Segment (rice, corn, sugarcane, banana, coconut, vegetables)
17.4. By Company Type (plantations, SMEs, co-ops, digital distributors)
17.5. By Formulation (liquid and encapsulated leading growth)
17.6. By Application Method (mechanized in-furrow, foliar integration)
17.7. By Region (Visayas sugar belts, Mindanao plantations, Luzon rice clusters)
Discuss a Customized Research Scope
Custom research scope • Tailored insights • Industry expertise
Research Methodology
Step 1: Ecosystem Creation
Map the ecosystem and identify all the demand-side and supply-side entities for the Philippines Biofertilizers Market. Based on this ecosystem, we will shortlist leading 5–6 biofertilizer providers in the country based on their financial indicators, market reach, and institutional client base. The demand-side includes farmers and cooperatives (7.41 million agricultural operators), plantation groups (sugarcane, banana, coconut), organic-certified farms, government procurement units (Department of Agriculture, Fertilizer and Pesticide Authority, LGUs), and agri-input dealers. The supply-side comprises local manufacturers (UPLB-BIOTECH, PCAARRD Nutrio® Consortium, Atlas Fertilizer Corporation), international biological companies (Novonesis, Rizobacter, Koppert, Lallemand, UPL), distributors, importers, logistics providers, and testing laboratories. Sourcing is conducted through industry articles, FPA licensing databases, PSA agricultural datasets, World Bank agricultural land data (127,226 sq. km), and IMF economic indicators (GDP USD 497.5 billion) to collate reliable, multi-layered market-level information.
Step 2: Desk Research
Subsequently, we engage in an exhaustive desk research process by referencing diverse secondary and proprietary databases. This approach enables us to conduct a detailed analysis of the Philippines Biofertilizers Market, aggregating industry-level insights. We examine variables such as registered products under FPA, fertilizer consumption at 285 kg/ha, the number of agricultural operators (7.41 million), and cropping intensity across rice, corn, and sugarcane belts. Data from press releases, government tenders, trade bulletins, PCAARRD R&D publications, and company websites are used to analyze business models, production capacity, and regional distribution reach. This process establishes a foundational understanding of both the market and the entities operating within it, forming the basis for player-level profiling and future market validation.
Step 3: Primary Research
We initiate a series of in-depth interviews with C-level executives, agronomists, R&D heads, and other stakeholders representing various Philippines Biofertilizers Market companies and end-users. This interview process serves a multi-faceted purpose: to validate market hypotheses, authenticate statistical data, and extract valuable operational and financial insights from these industry representatives. A bottom-to-top approach is undertaken to evaluate revenue contributions for each player, aggregating toward the overall market. Respondents include manufacturers (UPLB-BIOTECH, Novonesis, Rizobacter, Koppert), institutional buyers (DA, PCAARRD, LGUs), and large cooperatives. As part of our validation strategy, our team executes disguised interviews wherein we approach each company under the guise of potential clients. This enables validation of product pricing (Bio-N sachet at PHP 60), dealer margins, batch-wise volumes, and inventory turnover. These interactions also provide an extensive understanding of distribution structures, value chains, and agronomic pricing mechanisms, cross-checked against secondary data.
Step 4: Sanity Check
A bottom-to-top and top-to-bottom analysis, along with market size modeling exercises, is undertaken to assess the sanity of the research process. In the top-down model, we scale potential demand using macro parameters such as agricultural land (127,226 sq. km), farm operator base (7.41 million), and average fertilizer application intensity (285 kg/ha), applying conservative microbial adoption ratios for rice, corn, sugarcane, and vegetables. In the bottom-up model, player-level shipment data, registered product counts from FPA, and primary interview insights are aggregated to determine micro-level adoption and revenue flow. These two models are iteratively reconciled to ensure consistency between reported, estimated, and validated figures. The outcome is a fully cross-verified, data-backed, and statistically coherent assessment of the Philippines Biofertilizers Market, built upon reliable public datasets and on-ground validation.
See What's Inside the Report
Get a preview of key findings, methodology and report coverage
Frequently Asked Questions
The Philippines Biofertilizers Market holds strong growth potential, supported by the country’s vast agricultural base and increasing focus on sustainable farming practices. With 127,226 sq. km of agricultural land and an economy valued at USD 497.5 billion, the market benefits from government-backed nutrient efficiency programs and rising adoption of biological inputs across major crops such as rice, corn, and sugarcane. The Department of Agriculture’s Balanced Fertilization Strategy and Fertilizer and Pesticide Authority’s licensing drive further support market expansion by promoting the use of locally produced microbial inoculants like Bio-N and phosphate-solubilizing bacteria.
The Philippines Biofertilizers Market features a mix of public research centers, domestic producers, and multinational companies. Key players include UPLB-BIOTECH (Bio-N), PCAARRD Nutrio® Consortium, Novonesis (formerly Novozymes), Rizobacter/Bioceres, and Koppert Biological Systems Philippines. Supporting entities such as UPL Philippines, Atlas Fertilizer Corporation, and Planters Products Inc. complement the market through distribution and product integration. These companies dominate due to their strong government partnerships, established dealer networks, and proven microbial strains suited for tropical conditions, which enhance crop nutrient efficiency and yield sustainability.
Major growth drivers include the country’s large agricultural operator base of 7.41 million and the high fertilizer application rate of 285 kg per hectare, both of which underline the need for nutrient-use efficiency. The government’s focus on soil regeneration under the Department of Agriculture’s National Soil Health Program has encouraged integration of microbial inputs. Additionally, agricultural trade worth USD 27.22 billion ensures availability of imported strains and logistics support for distribution, enhancing market penetration across Luzon, Visayas, and Mindanao.
The market faces key challenges around quality control, regulatory throughput, and smallholder adoption. Only 7 FPA-recognized laboratories are currently accredited for fertilizer and pesticide analysis, creating testing and certification bottlenecks. Additionally, the average farm size of 0.83 hectares limits economies of scale for inoculant application and training. Moreover, dependence on USD 4.34 billion worth of imported agricultural inputs per quarter exposes the supply chain to currency and logistical risks, making consistent distribution and farmer education critical challenges for market maturity.
License Options
PDF + Excel
Complete report package
$4,000
Excel Only
Data and analytics
$2,500
Custom Sections
Starts from $100
$0